All content reflects personal Elliott Wave analysis and is not intended to serve as financial advice or trading signals. Always conduct your own due diligence.
$BITF — Quantum Model Projection
Bullish Alt.📈 Scenario | Weekly
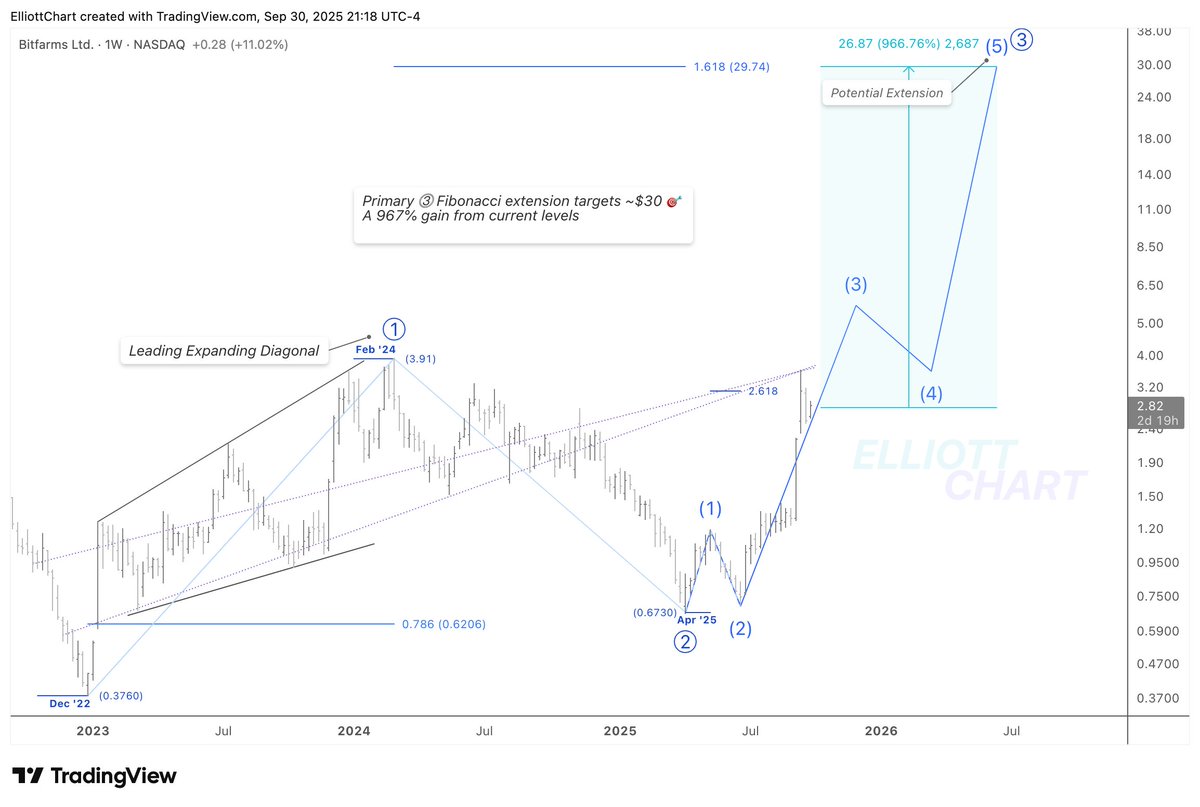
Based on the bullish case (projected since September), the Primary-degree trend in Wave ⓷ targets the 1.618 Fib-extension level at $29 in 2026, structurally necessitating an extension.
Wave | Trend Analysis
Preserving the structural integrity of the bullish interpretation, the internal wave profile indicates that Int. Wave (3) exhibits impulsive characteristics rather than forming an extension — reinforcing the expectation that Int. Wave (5) will unfold as the extending wave within the Primary degree sequence.
Moreover, the deep correction in Int. Wave (4), which neutralized the remaining bearish sentiment, has cleared the path for Int. Wave (5) to unfold as an Extension.
As illustrated on the chart, the revised Res → Q-Structure λ₁ projects a Q-Target of 22.22💫 into December.
🔖The outlook is derived from insights within my Quantum Models framework. Within this methodology, Q-Targets represent high-probability scenarios generated by the confluence of equivalence lines. These Quantum Structures also serve as structural anchors, shaping the model's internal geometry and guiding the evolution of alternative paths as price action unfolds.
$CryptoStocks $CryptoMining $QuantumModels
$BITF
Wave Analysis — Bullish Alternative Scenario📈
The formation of an Expanding Leading Diagonal in Primary Wave ⓵ hints at a transitional phase from prior bearish exhaustion into a bullish accumulation. This early-stage motive structure often precedes strong impulsive advances and supports the broader case for Cycle Wave III (not shown in this frame) potentially is underway.
Following this, Primary Wave ⓶ completed a deep corrective retracement, terminating near the 78.6% Fibonacci level of Wave ⓵ — a commonly observed retracement depth for second waves following diagonals in the wave one position. This deep correction likely served to neutralize remaining bearish sentiment, clearing the path for the initiation of Primary Wave ⓷.
Technical Commentary (Within Primary Impulsive📈 Wave ⓷)
Currently within Primary Wave ⓷, the ongoing impulse of Intermediate Wave (3) has paused near the apex of the equivalence lines drawn from the Expanding Leading Diagonal in Wave ⓵ — a key confluence zone in my personal technical framework.
This area represents a notable technical inflection point, where price is interacting with structural geometry from the base of the trend — potentially a reactive zone before further continuation.
Using Fibonacci extension measurements, the projected target for the completion of Primary Wave ⓷ lies near $30🎯, which would represent a 967% gain from current levels.
#StocksToWatch #MarketAnalysis #TechnicalAnalysis #ElliottWave #WaveAnalysis #TrendAnalysis #FibLevels #FinTwit #TradingView #Investing #BITF @Bitfarms_io #BitfarmsLtd #Canada #DataCenters #BitcoinMining #CryptoMining #AIStocks #HPC #AI #BTC #Bitcoin #BTCUSD $BTC $AI $BTCUSD $BITCOIN
bitcoin:native
Retesting $62K 🎯 through the final decline of Minor Wave 5, following a Triangle correction in Minor Wave 4, as projected.
The double bottom at $62K could now mark the extreme low of Primary Wave Ⓑ—further confirmation is still required.
bitcoin:native — HIEQ Model
Could the marked $62K retest be the clean confirmation before $144K 🎯?
As shown on the daily chart below, price bars are contracting along the converging zone of the defined TS HIEQ Structure Δ, forming a Triangle correction in Minor Wave 4 (identified on the 4H chart).
The final decline in Minor Wave 5 could follow, potentially marking the extreme low of Primary Wave Ⓑ.
Like the wolf, sitting quietly at the heights, gazing toward the summit. Not restless, not distracted—just focused on the path ahead! ✨⛰️🐺
Primary-degree Wave ⓸ corrections can be overwhelmingly boring and exhausting. Withdraw your attention from all distractions, remain patient, and make decisions aligned with the right direction ahead. $KEEL 📈, $IREN 📈, $CIFR 📈, $WULF 📈
bitcoin:native — HIEQ Model
Could the marked $62K retest be the clean confirmation before $144K 🎯?
As shown on the daily chart below, price bars are contracting along the converging zone of the defined TS HIEQ Structure Δ, forming a Triangle correction in Minor Wave 4 (identified on the 4H chart).
The final decline in Minor Wave 5 could follow, potentially marking the extreme low of Primary Wave Ⓑ.
bitcoin:native — HIEQ Model
TQ Analysis | What Depth Have We Reached on This TS Map?📉
BTC continued the decline of Primary Wave Ⓑ, with price holding stable around the defined HPQ Target ➤ $65K (on the daily chart linked below) at the converging zone of TS Ray γ (newly designed). The $62K level could mark the depth of this correction.
I've also shifted Trend Ray Advance B to the May timeline while maintaining the Anchoring Level—preserving the same HPQ Target ➤ $144.4K 🎯.
🔖 HIEQ Model ⇒ Highly Integrated & Entangling Quantum Model
bitcoin:native — HIEQ Model
TQ Analysis | What Depth Have We Reached on This TS Map?📉
BTC continued the decline of Primary Wave Ⓑ, with price holding stable around the defined HPQ Target ➤ $65K (on the daily chart linked below) at the converging zone of TS Ray γ (newly designed). The $62K level could mark the depth of this correction.
I've also shifted Trend Ray Advance B to the May timeline while maintaining the Anchoring Level—preserving the same HPQ Target ➤ $144.4K 🎯.
🔖 HIEQ Model ⇒ Highly Integrated & Entangling Quantum Model
bitcoin:native — HIEQ Model
BTC has declined directly from the converging resistance zone of Ray α. As mentioned in the previous update, Intermediate Wave (C) of Primary Wave Ⓑ has extended to complete its structure as an impulsive sequence—a pattern that often follows a Leading Expanding Diagonal and its subsequent correction.
The newly designed TS HIEQ Structure Δ now points to the current HPQ Target ➤ $65.6K 🎯 by November 25.
bitcoin:native — HIEQ Model
BTC has declined directly from the converging resistance zone of Ray α. As mentioned in the previous update, Intermediate Wave (C) of Primary Wave Ⓑ has extended to complete its structure as an impulsive sequence—a pattern that often follows a Leading Expanding Diagonal and its subsequent correction.
The newly designed TS HIEQ Structure Δ now points to the current HPQ Target ➤ $65.6K 🎯 by November 25.
bitcoin:native reached the defined HPQ Target ➤ $72.7K 🎯.
The low at $72,668.77 could mark the completion of the Primary Wave Ⓑ correction. However, Intermediate Wave (C) does not yet appear structurally complete, as shown on the daily chart below.
$MVST — HIEQ Model
After an unexpected decline this week, I'll wait for the weekly close before drawing further conclusions.
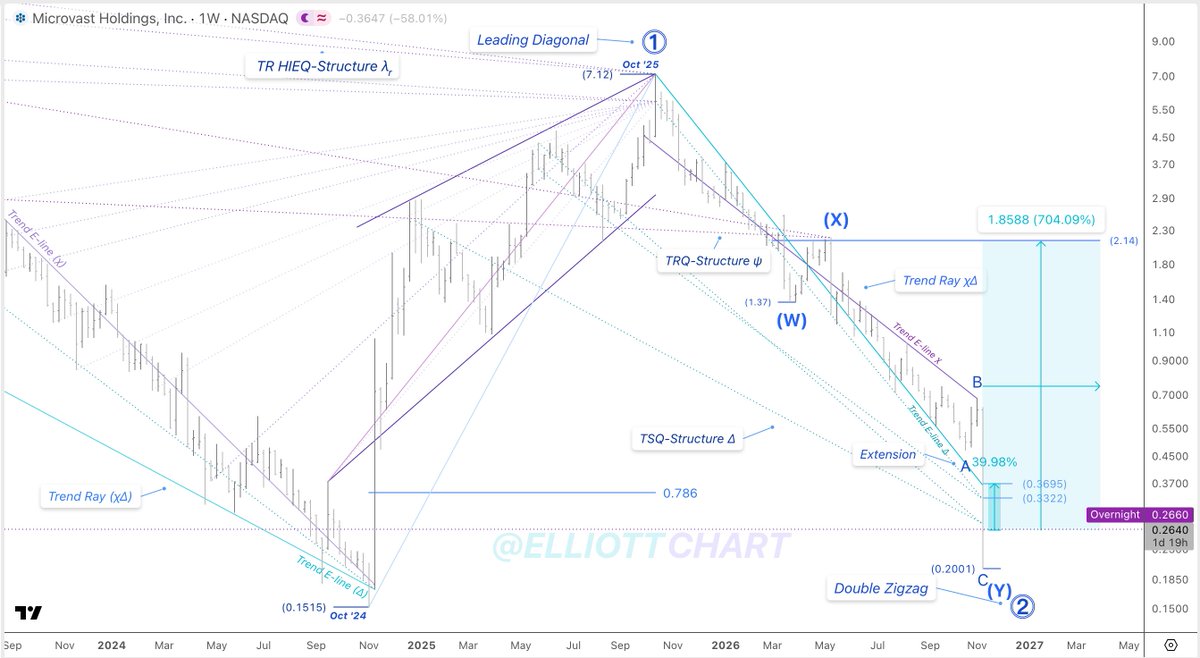
The entire correction in Primary Wave ⓶ is now interpreted as a Double Zigzag, concluding with the sharp decline in its Minor Wave C.
I've redesigned Trend Ray χΔ into Model X, placing its confluence at the midpoint of Intermediate Wave (X). I've also replaced the previous TSQ Structure with a newly designed Δ, illustrating potential confluence levels that may help define the weekly closing level:
Current price level, 0.333, 0.369.
I'll likely publish my final analysis on Friday, based on the price structure at the weekly close.
🔖 As noted earlier, my TQ analyses remain in the research and development stage. Time is required for the projected structures to unfold and their outcomes to become clearer. My analyses are intended to explore potential market infrastructures and project TS Maps, not to serve as financial advice or trading signals. Always conduct your own due diligence.
$MVST — HIEQ Model
TQ Analysis | Projecting Primary Uptrend ⓷ 📈
After a year-long corrective phase of Primary Downtrend ⓶, projected into a cymatic trendflow, MVST has broken out above Trend Ray χΔ, advancing 45%.
Holding the extreme low ➤ $0.47, defined by TS HIEQ-Structure Δ, together with two consecutive weekly closes above TR E-line χ, strongly confirms that Primary Uptrend ⓷ may have initiated.
I’ll publish the HIEQ Model projection for the advancing impulsive phase of Wave ⓷ — TS Map 📈.
🔖 HIEQ Model ⇒ Highly Integrated & Entangling Quantum Model
#StrategicAnalysis #TrendAnalysis #FutureVision #TimeSpaceMap #TSMap
bitcoin:native reached the defined HPQ Target ➤ $72.7K 🎯.
The low at $72,668.77 could mark the completion of the Primary Wave Ⓑ correction. However, Intermediate Wave (C) does not yet appear structurally complete, as shown on the daily chart below.
bitcoin:native — HIEQ Model
TQ Analysis | What Depth Have We Reached on This TS Map Now? 📉
BTC remains on track, as projected since Sep. 22, with the Primary Wave Ⓑ underway—approaching the defined confluence of the TS Rays ➤ χ and γ.
Primary Wave Ⓑ may conclude around the HPQ Target ➤ $72.7K 🎯, where the defined TS Rays converge with the highly entangling E-line ψ on this TS Map.
🔖 HIEQ Model ⇒ Highly Integrated & Entangling Quantum Model
#StrategicAnalysis #QuantumEntanglement #FutureVision #CymaticTrendflow #TimeSpaceMap #TSMap
Agreed, let a potential reversal reaction determine its own timing.
Regarding CIFR, yes, I previously projected its ATH through an Ending Diagonal expanding along that TRQ-Structure λᵣ, with the HPQ Target ➤ $33 🎯. However, due to the June 19 market holiday and the resulting missing data, the projected move only reached the $30.14 level.
Thanks for reminding me of that ATH projection!
I'll likely provide an updated analysis of CIFR this week.
$IREN — HIEQ Model
TQ Analysis | Trend Reversal 📈
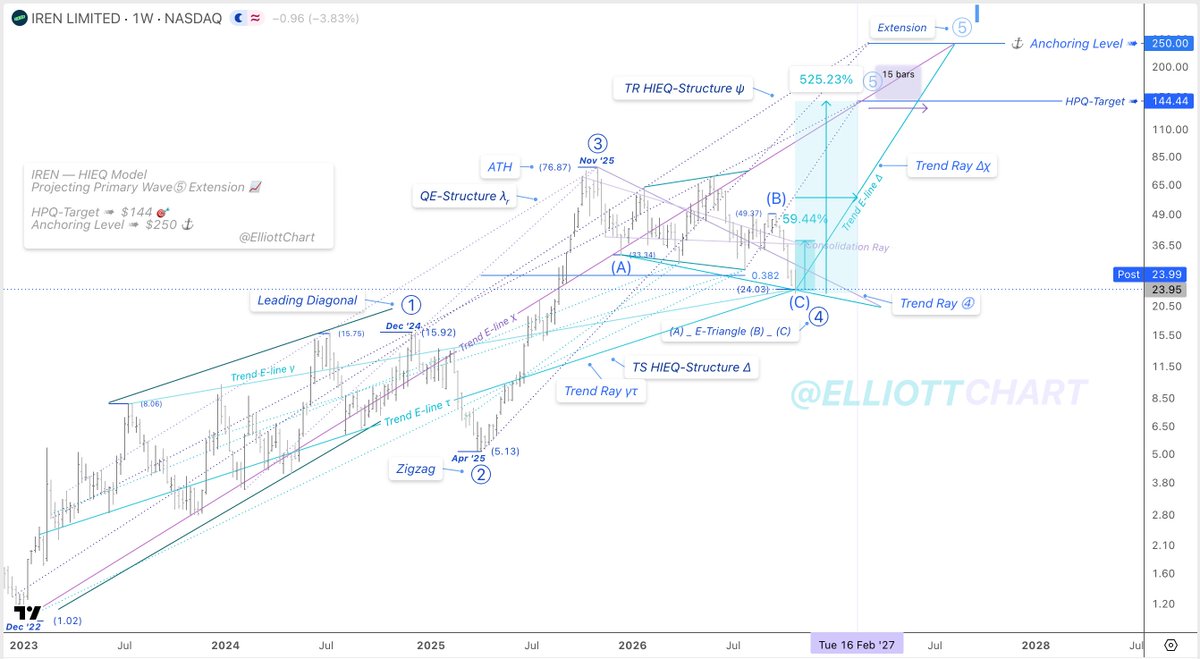
IREN reversed sharply, gaining 24.5% intraday, with the weekly close at $21.64—landing precisely at the confluence of Transition Support HIEQ-Structure φ and Trend Support Ray γτ.
As noted earlier, the TS HIEQ Structures ➤ Trend Support Δ and accompanying Transition φ have already laid the infrastructure for materializing impulsive energy through high vibrations as Primary Wave ⓹ advances across the projected expansive space of the Trend Ray Δχ.
The defined HPQ Target ➤ $144 🎯 remains intact, with an ultimate climax projected to extend into August 27, toward the HP Anchoring Level ➤ $250 ⚓️.
$IREN — HIEQ Model
TQ Analysis | Trend Reversal 📈
IREN has surged 11% today, bringing the TS HIEQ-Structure φ confluence ➤ $21.86 into focus as a potential extreme low of the Primary Wave ⓸ corrective phase.
So, the HIEQ Structures ➤ Trend Support Δ and accompanying Transition φ have already provided the infrastructural foundation for materializing impulsive energy through high vibrations as Primary Wave ⓹ advances across the projected expansive space of the Trend Ray Δχ.
The defined HPQ Target ➤ $144 🎯 remains unchanged.
🔖 HIEQ Model ⇒ Highly Integrated & Entangling Quantum Model
I understand your concern and appreciate you expressing it respectfully. You're right that the interpretation has evolved as IREN's price structure has developed, and I recognize how that can look like moving the goalposts.
Although the HPQ Target ➤ $144 remains my current primary projection, price bars ultimately have the final say.
I'd rather let the model be tested by the market than convince anyone through words alone. That said, I don't expect every projection to be correct, nor do I expect you to take it on faith. The real test is whether the projected structural levels, defined confluences, and potential pathways continue to hold up against actual market behavior.
$MVST — HIEQ Model
TQ Analysis | Projecting Primary Uptrend ⓷ 📈
After a year-long corrective phase of Primary Downtrend ⓶, projected into a cymatic trendflow, MVST has broken out above Trend Ray χΔ, advancing 45%.
Holding the extreme low ➤ $0.47, defined by TS HIEQ-Structure Δ, together with two consecutive weekly closes above TR E-line χ, strongly confirms that Primary Uptrend ⓷ may have initiated.
I’ll publish the HIEQ Model projection for the advancing impulsive phase of Wave ⓷ — TS Map 📈.
🔖 HIEQ Model ⇒ Highly Integrated & Entangling Quantum Model
#StrategicAnalysis #TrendAnalysis #FutureVision #TimeSpaceMap #TSMap
$MVST — HIEQ Model
TQ Analysis | Projecting Primary Uptrend ⓷ 📈
MVST has surged 24.4% this week, breaking out of Trend Ray χΔ and suggesting that the bottom-formation stage at its converging zone should be complete.
$0.47 may therefore hold as the extreme low, defined by TS HIEQ-Structure Δ—around the HPQ Target zone defined on the chart.
A close above the Trend Ray would provide stronger confirmation of the initiation of Primary Uptrend ⓷.📈Upon confirmation, I’ll publish the HIEQ Model for the advancing Wave ⓷ impulsive phase.
🔖 HIEQ Model ⇒ Highly Integrated & Entangling Quantum Model
#StrategicAnalysis #TrendAnalysis #FutureVision #CymaticTrendflow #TimeSpaceMap #TSMap
bitcoin:native — HIEQ Model
TQ Analysis | What Depth Have We Reached on This TS Map Now? 📉
BTC remains on track, as projected since Sep. 22, with the Primary Wave Ⓑ underway—approaching the defined confluence of the TS Rays ➤ χ and γ.
Primary Wave Ⓑ may conclude around the HPQ Target ➤ $72.7K 🎯, where the defined TS Rays converge with the highly entangling E-line ψ on this TS Map.
🔖 HIEQ Model ⇒ Highly Integrated & Entangling Quantum Model
#StrategicAnalysis #QuantumEntanglement #FutureVision #CymaticTrendflow #TimeSpaceMap #TSMap
bitcoin:native — HIEQ Model
QT Analysis | How Do HP Trend Rays Work?!
BTC surged 7.77% 📈, reaching the defined HPQ Target ➤ $87K 🎯, projected on this TS Map since July 1. Price is now pausing precisely at the apex of the Primary Trend Ray Advance Ⓐ.
As previously outlined, the impulsive advance of Intermediate Wave (5) has emerged through the interaction between the defined E-line ψ and Trend E-line Δ.
🔖 The Primary-degree Trend Ray Advance Ⓐ was first anchored by the HIEQ-Structure λᵣ confluence ➤ $87,777.77 ⚓️ ݁˖
#StrategicAnalysis #QuantumEntanglement #CymaticTrendflow #FutureVision #TimeSpaceMap #QuanTrendAnalysis #TSMap
$KEEL — HIEQ Model
TQ Analysis | Trend Reversal 📈
KEEL rose 13.33% today, closing the week at the TS Ray 1 confluence.
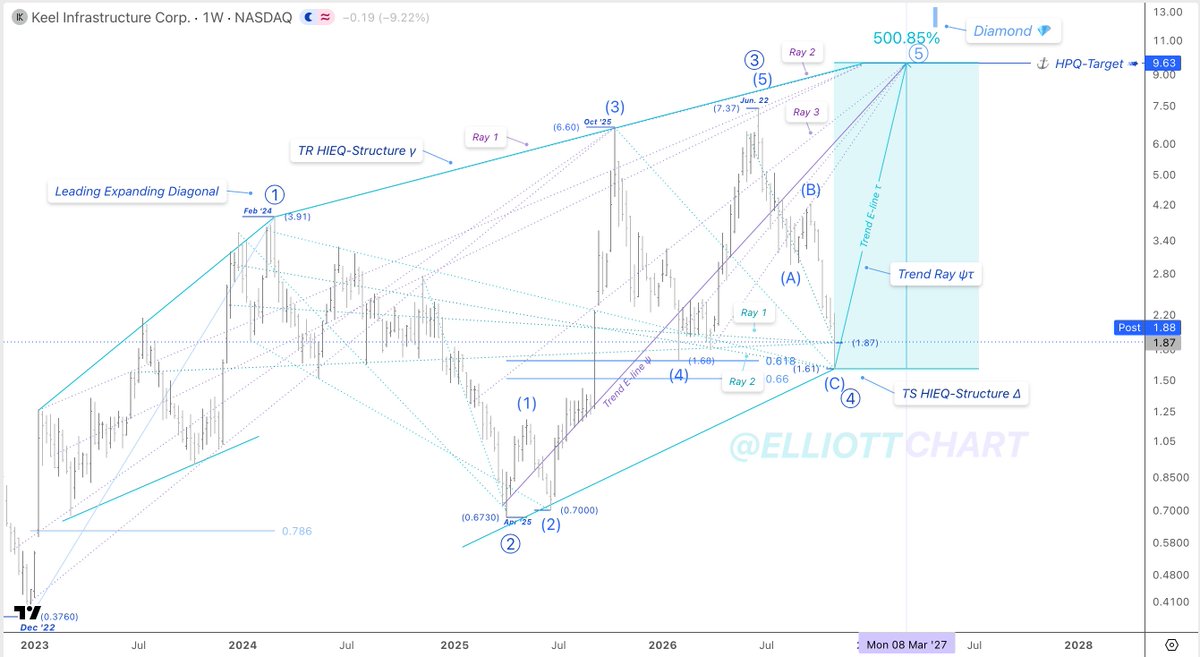
With the retracement approaching the 0.66 Fibonacci level, the recent low ➤ $1.61 may be recognized as the origin point of the projected advance in Primary Wave ⓹.
I've redesigned the TS HIEQ-Structure Δ into two Rays to define the extreme zone of the retracement in Primary Wave ⓸.
$KEEL — HIEQ Model
TQ Analysis | Trend Reversal 📈
KEEL rose 17.46% intraday, marking a strong rally since mid-September. This reinforces confidence that the recent low ➤ $1.86 could represent the extreme point of the Primary Wave ⓸ retracement, as the potential origin of Trend E-line τ—now illustrated through the Anchoring Level ➤ $9.63 ⚓️.
Holding above the TS HIEQ-Structure Δ confluence, followed by a confirming weekly close, would provide stronger evidence of a trend reversal—supporting the projected Primary Wave ⓹ as an extension. 📈
The HPQ Target ➤ $9.63 🎯 remains unchanged.
Detailed Structural Breakdown:
Weekly Close ➤ $21.64: Landing precisely at the apex of Trend Support Ray γτ.
TS HIEQ-Structure φ confluence ➤ $17.16: Identifies the extreme low of the Primary Wave ⓸ correction.
bitcoin:native — HIEQ Model
Finally, the interaction between Rays α and γ has unfolded into an impulsive reaction, marking the development of Minor Wave A within the ongoing Intermediate (B) correction.📈
Therefore, Intermediate Wave (A), as an Expanding Diagonal, could have completed at $75.6K.
Intermediate Wave (B) could continue developing into mid-November, with an HPQ Target ➤ $74.7K 🎯.
🔖 HIEQ Model ⇒ Highly Integrated & Entangling Quantum Model
$IREN — HIEQ Model
TQ Analysis | Trend Reversal 📈
IREN has surged 11% today, bringing the TS HIEQ-Structure φ confluence ➤ $21.86 into focus as a potential extreme low of the Primary Wave ⓸ corrective phase.
So, the HIEQ Structures ➤ Trend Support Δ and accompanying Transition φ have already provided the infrastructural foundation for materializing impulsive energy through high vibrations as Primary Wave ⓹ advances across the projected expansive space of the Trend Ray Δχ.
The defined HPQ Target ➤ $144 🎯 remains unchanged.
🔖 HIEQ Model ⇒ Highly Integrated & Entangling Quantum Model
$IREN — HIEQ Model
How Designed HP Rays Define the Closing — TS Map
IREN closed the week precisely at the support E-line of Transition Trend Ray ⓸, with no refinement.
The TS HIEQ-Structure Δ continues to provide coherent support for the corrective structure ⓸, as the turn into the Primary uptrend ⓹ extension📈 is now projected.
The HPQ Target ➤ $144 🎯 remains unchanged, with the same projected timeline of mid-February.
$KEEL — HIEQ Model
TQ Analysis | Trend Reversal 📈
KEEL rose 17.46% intraday, marking a strong rally since mid-September. This reinforces confidence that the recent low ➤ $1.86 could represent the extreme point of the Primary Wave ⓸ retracement, as the potential origin of Trend E-line τ—now illustrated through the Anchoring Level ➤ $9.63 ⚓️.
Holding above the TS HIEQ-Structure Δ confluence, followed by a confirming weekly close, would provide stronger evidence of a trend reversal—supporting the projected Primary Wave ⓹ as an extension. 📈
The HPQ Target ➤ $9.63 🎯 remains unchanged.
$KEEL — HIEQ Model
TQ Analysis | Projecting the Primary Impulsive Advance ⓹ 📈
KEEL has surged 14.5% from the HIEQ-Structure Δ confluence, suggesting that the Primary Wave ⓸ retracement should have ended at $2.06. The Primary-degree advance in Wave ⓹ has now initiated.
The HPQ Target ➤ $9.63 🎯 remains unchanged, with the projected timeline now extending to early March.
🔖 As noted earlier, my TQ analyses remain largely in the research and development stage. Time is required for the projected structures to unfold and their outcomes to become clearer. My analyses are intended to explore potential market infrastructures and project TS Maps, not to serve as financial advice or trading signals. Always conduct your own due diligence.