Postdoc positions open now at the FGI:
🌊Digital Waters project
🚁Drone Technologies
🗺️Geoinformatics
📡 Laser Scanning
🛰️Satellite Navigation
📏Geodetic Reference Frames
🌌Space Geodesy
This is a unique opportunity, take a chance and apply!
https://t.co/WJYQzx9xet
! Come work with us !
We are looking for a "Postdoctoral Researcher - laser scanning" for a 3-year position.
Details here: https://t.co/ZUqyQbw681
Call open until 31 December.
See also the other six positions opened up with the @Maanmittaus in @fgi_nls.
https://t.co/PHNWmyYPnl
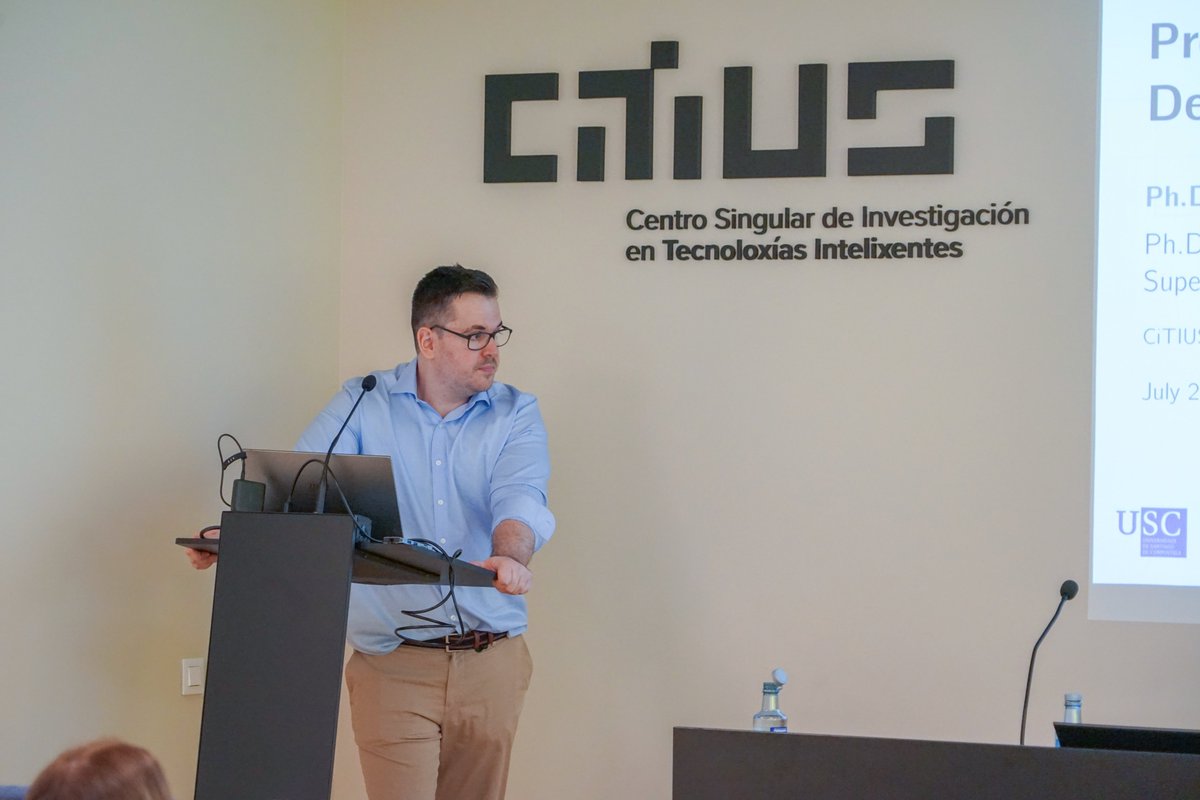
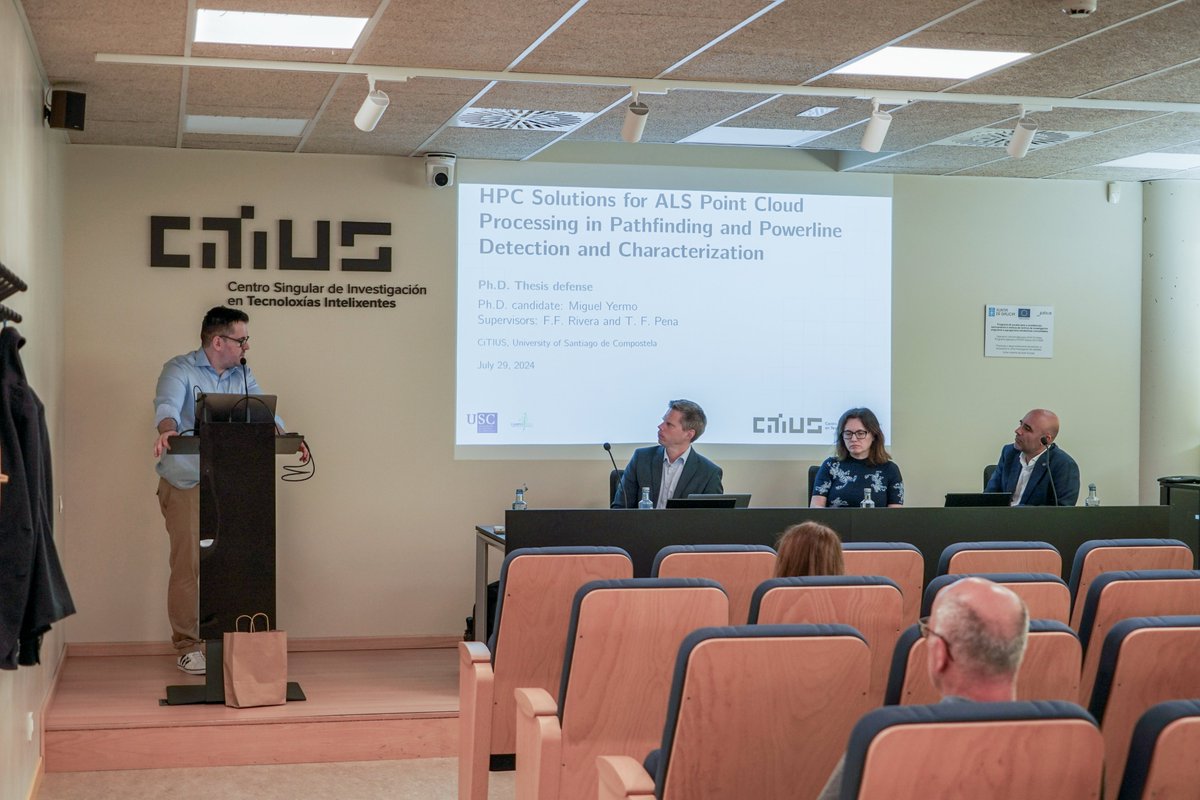
Warmest congratulations to Miguel Yermo García for his successful thesis defense on #HPC solutions for #LiDAR#ALS#PointClouds, pathfinding, and powerline detection.
Your #CiTIUSPhD in high-performance computing is truly inspiring. Well done!
🔗 https://t.co/Wk5hXbCG3l
The 4D & 5D datasets can be used for point cloud time series visualizations, method testing, as course material, or in 4D TLS experiment planning.
For any questions, drop me a DM or en email.
Have fun!
17/n
Today, the experiments have evolved into a more permanent forest monitoring setting with our Lidar Phenology unit (LiPhe).
With LiPhe, we are monitoring many interesting phenomena in forest structure over the seasons:
13/n
@AShcherbacheva et al. (2024), "A study of annual tree-wise LiDAR intensity patterns of boreal species observed using a hyper-temporal laser scanning time series", https://t.co/C6hIMZykoc
16/n
Puttonen et al. (2015)
https://t.co/DeMowuwmn7
Puttonen et al. (2016)
https://t.co/y6LGBSSrQz
The 5D test data (215MB) measured in Finland is available here:
https://t.co/A0qc2Vim9h
12/n
These experiments were inspired by the results we found in earlier studies with TLS time series (5D TLS).
The results showed peculiar changes in reflection spectra and branch direction overnight that warranted further investigations:
11/n
Parts of the data have already been used in publications, but there's more to look into.
Puttonen et al. (2019), "A Clustering Framework for Monitoring Circadian Rhythm in Structural Dynamics in Plants From Terrestrial Laser Scanning Time Series"
https://t.co/SGgWbbjsVB
6/n
About 30 (August) and 20 (October) individual target objects are manually delineated in their own point clouds for quick viewing.
Full point clouds are provided for every fifth scan.
5/n
Open 4D TLS test data (9.3GB) to try with:
"Three Terrestrial Laser Scanning Point Cloud Time Series Measured Overnight in Finland in August and October 2016"
https://t.co/8MhsPIdT5s
A thread 🧵:
The data are provided in .laz (1.4) format.
The August data are registered in the same rectilinear coordinate frame, the October data in their own.
4/n
Each experiment site has tens of scans collected with short intervals using two (October) or three scanners (August).
The experiment site had both natural and artificial target objects.
3/n
We did three overnight TLS experiments in southern Finland in 2016.
Two nights had leaf-on (late August) and one night leaf-off (middle of October) conditions.
2/n