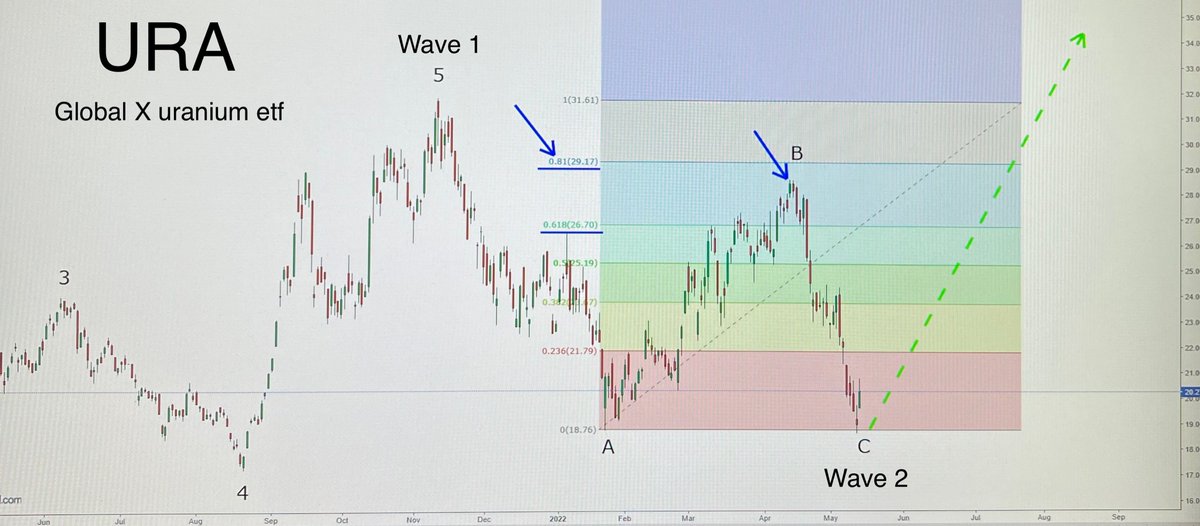
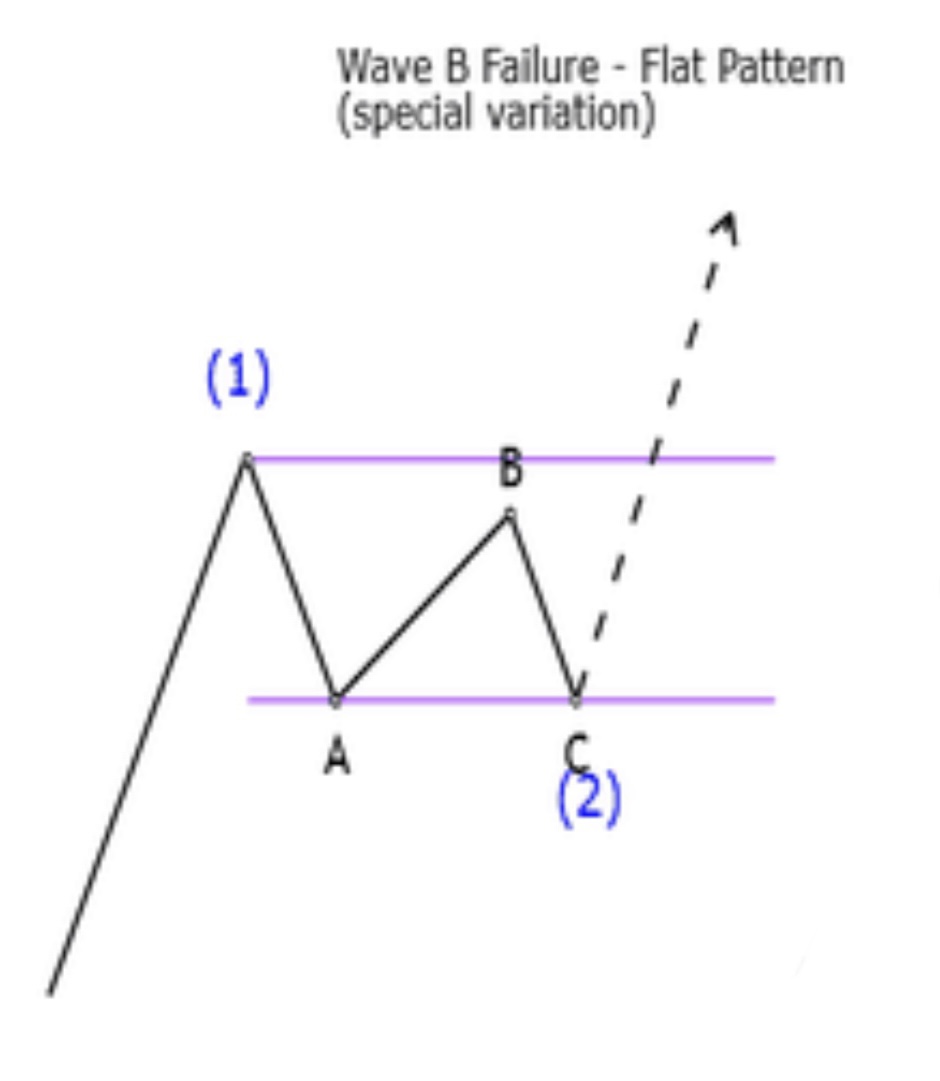
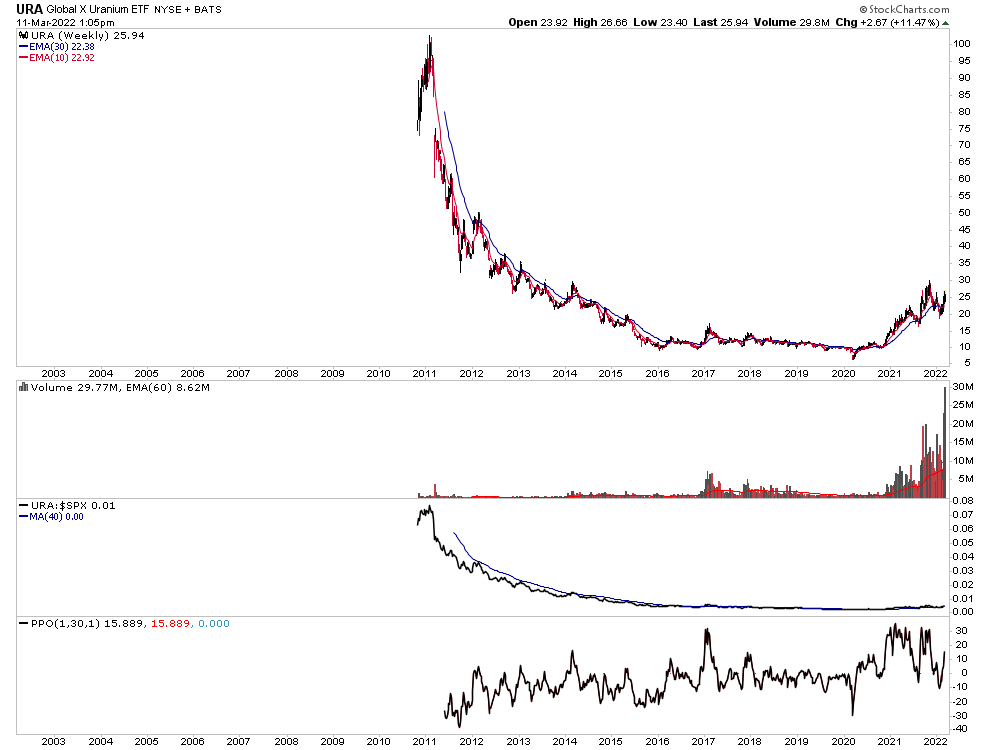
$ura#uranium The Wave B stop before the previous high between the two level of fibonacci 61,8-81 and the Wave C stop at the same level of the wave A ! This is exactly what is happening now 👇
$URA #uranium back to back weeks of the biggest volume in the history of this ETF. Stage 2 bull market only started in early 2021, still early and a new Stage 2 continuation breakout these past two weeks on monster volume. 👀
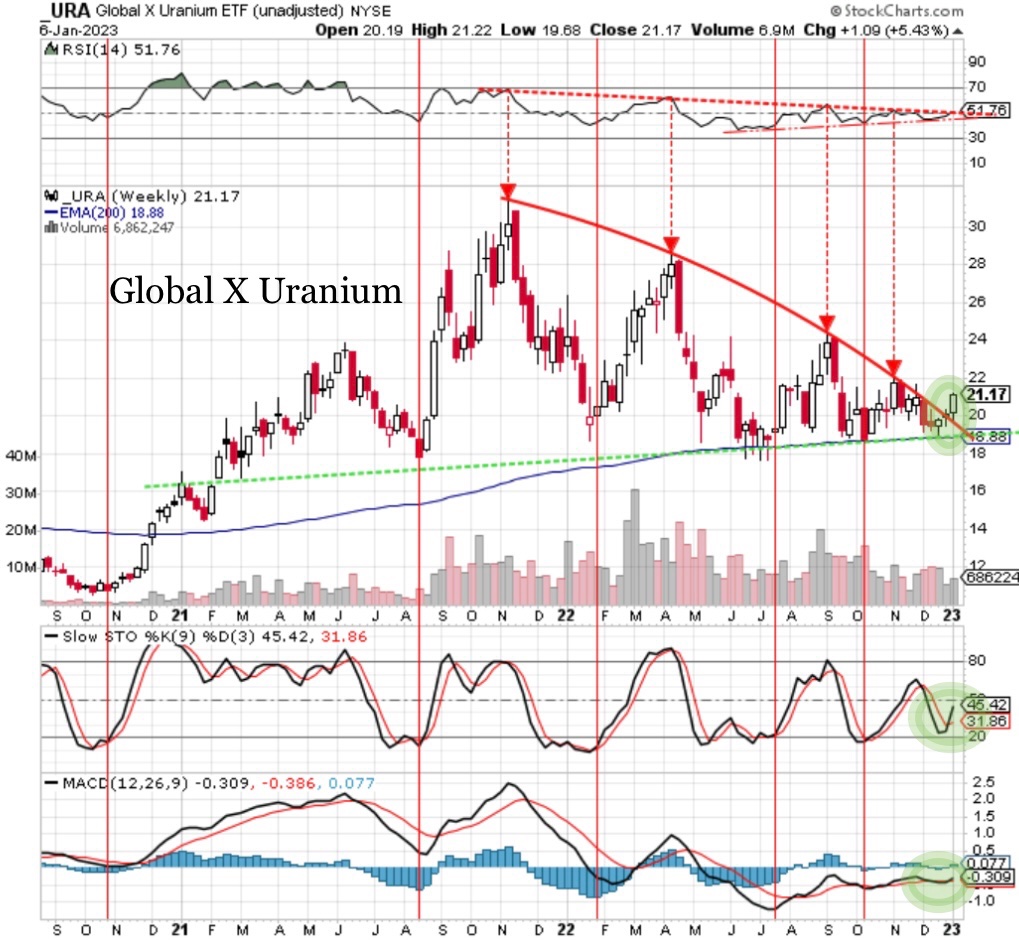
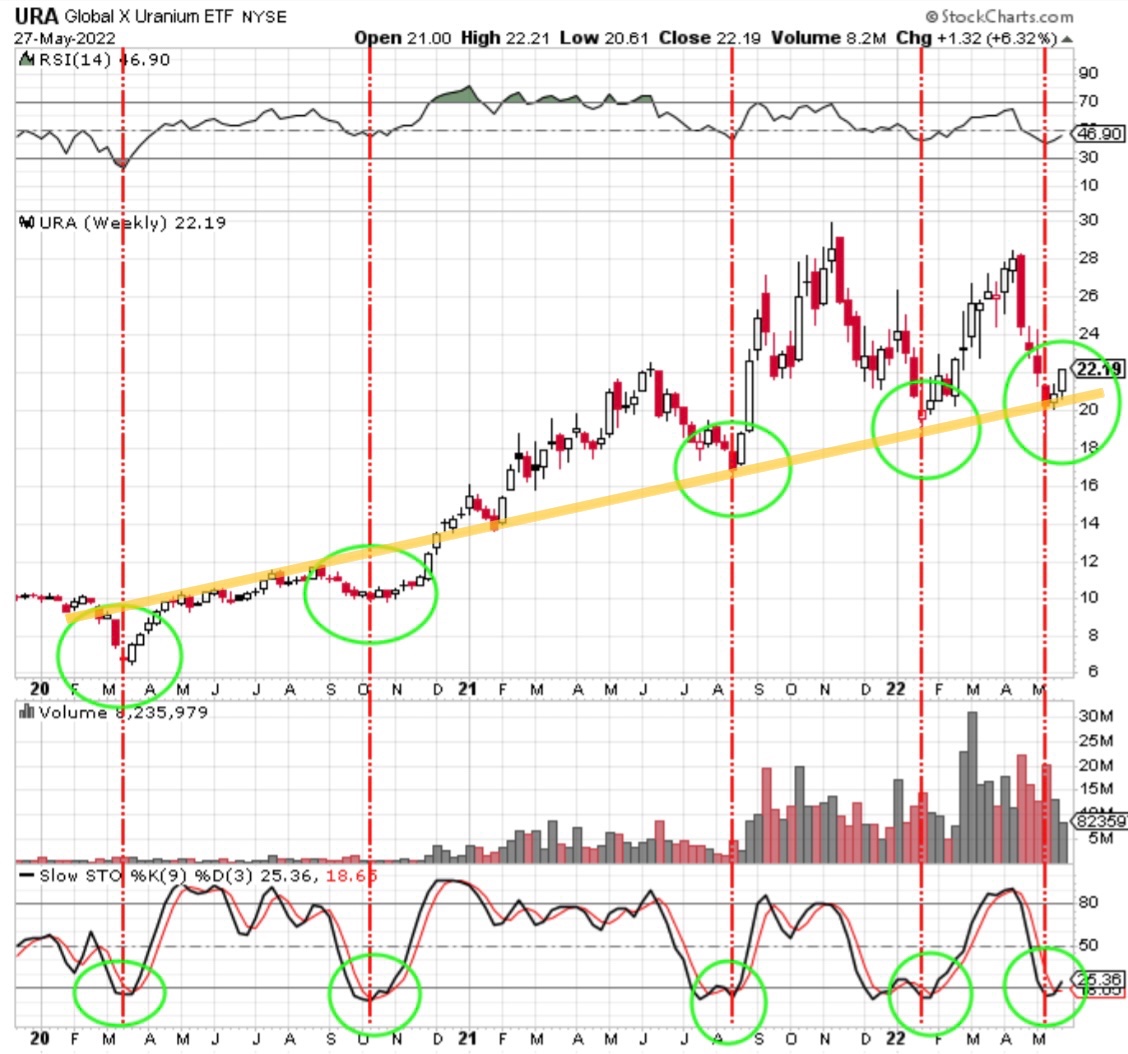
we can also see the same bearish attack(1)(2) in the weekday chart which coincides with a major trend line! Additionally the red quarterly average acts as a huge long term support which is also represented in the weekly chart. $URA
In the long term, ( quarterly ) we must stay above the blue and red averages which clearly act as support and the rsi must go back above the 50 to resume the long term uptrend. $Ura