Today we are excited to launch DABEST Version 2 aka “Ondeh” , which adds entirely new statistical graphics for paired proportions, standardized delta-delta effect size, and gives new options for dot swarms. 🧵1/6
We hope you get a chance to use DABEST v2024.03.29 in your work. We hope to hear your feedback here and on GitHub. Refreshed documentation and tutorial can be found at https://t.co/vVg65O5U3U 🧵6/6
Today we are excited to launch DABEST Version 2 aka “Ondeh” , which adds entirely new statistical graphics for paired proportions, standardized delta-delta effect size, and gives new options for dot swarms. 🧵1/6
Contributors to this update were: Zinan LU (https://t.co/bObOT5OwIz), Kah Seng LIAN (https://t.co/ySuRtI7Cxg), A. Rosa Castillo (https://t.co/RoDRhTLPLy). 🧵5/6
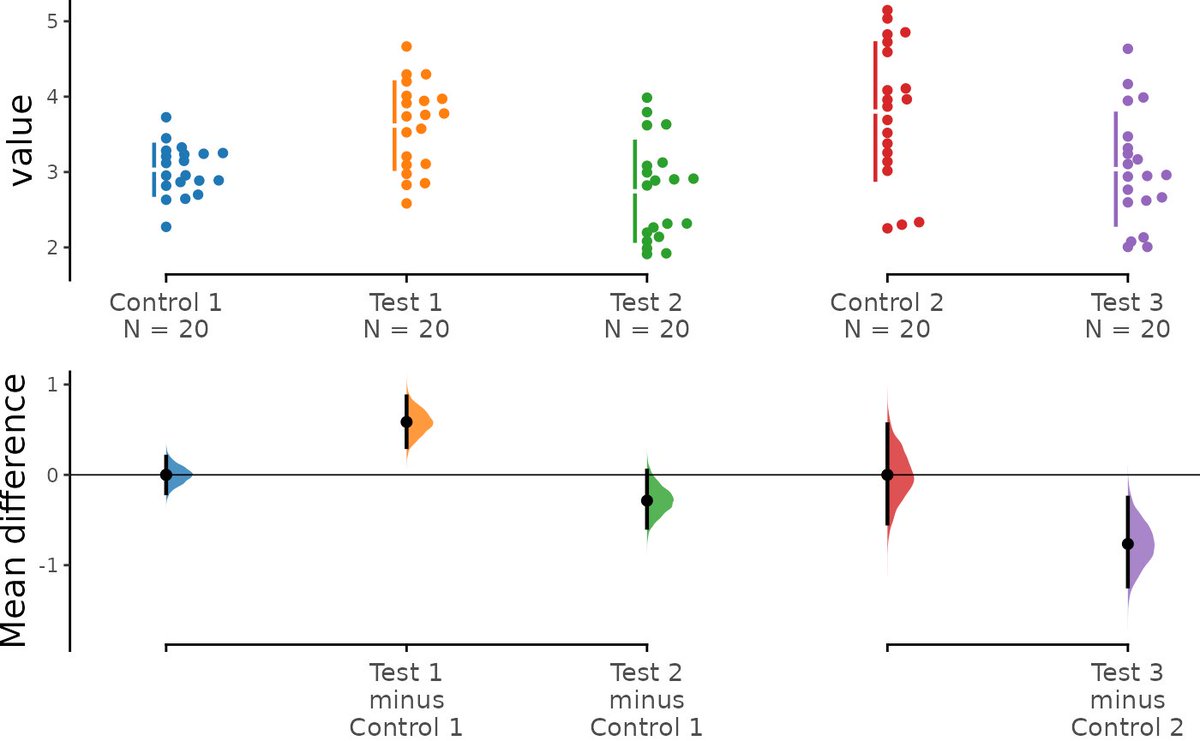
② Users may add a baseline error curve to shared control contrast plots, displayed below the control group. This is the distribution of the bootstrapped mean differences from comparing the control against itself and is a measure of inherent variability within the control group.
We have also added several features not yet present in the Python version of the package:
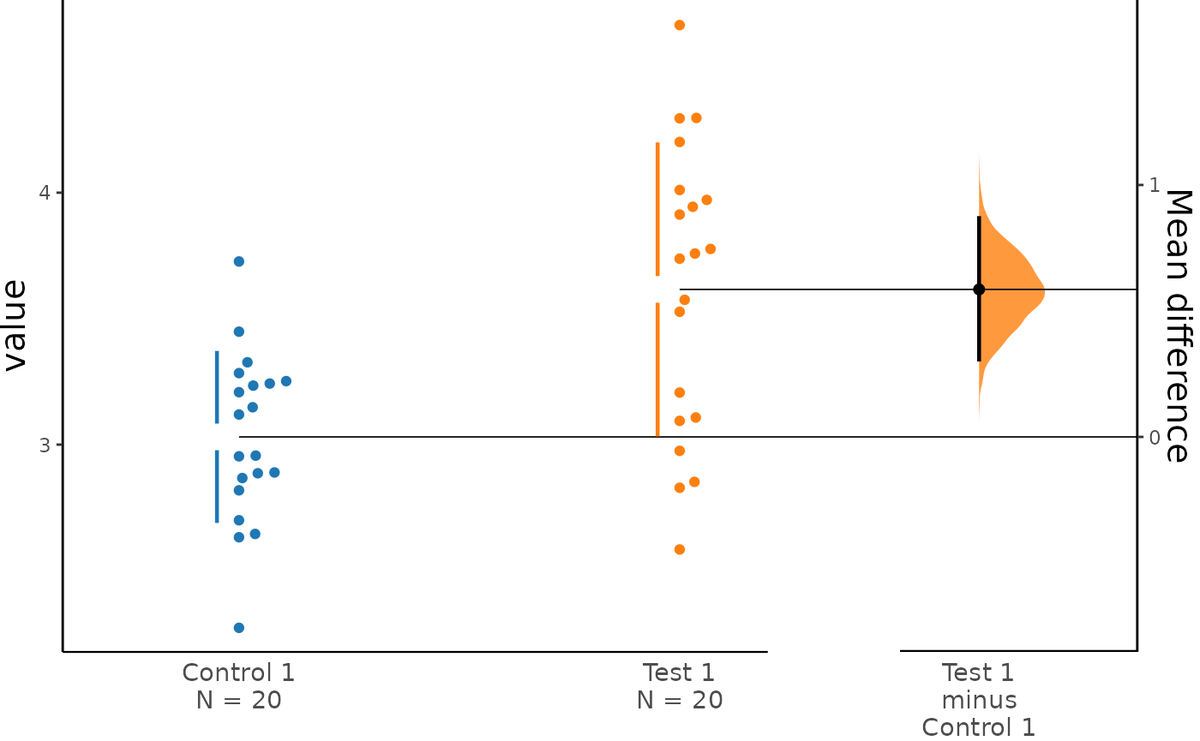
① As you may have noticed from the images in the thread below, we have adopted asymmetrical swarmplots, thereby better showing the distribution underlying the raw data.
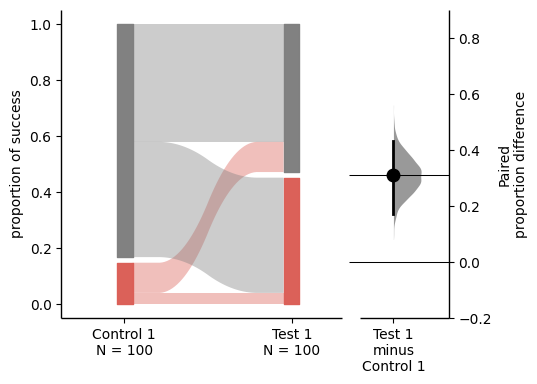
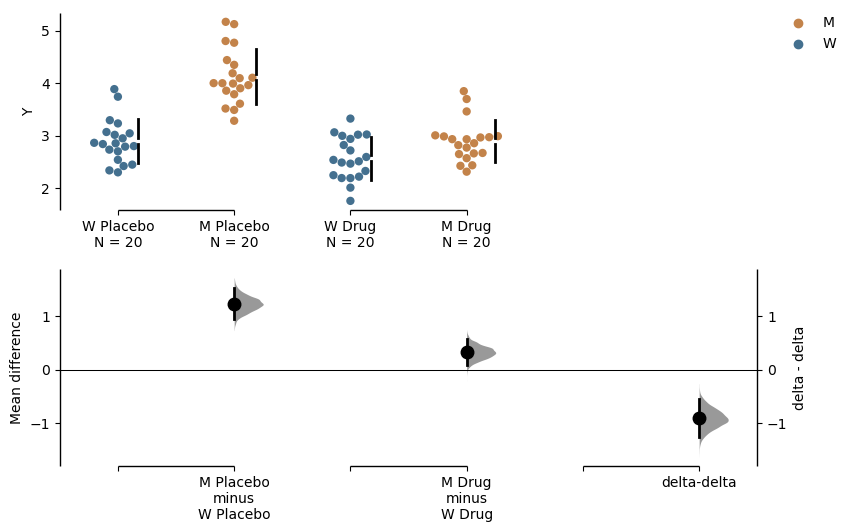
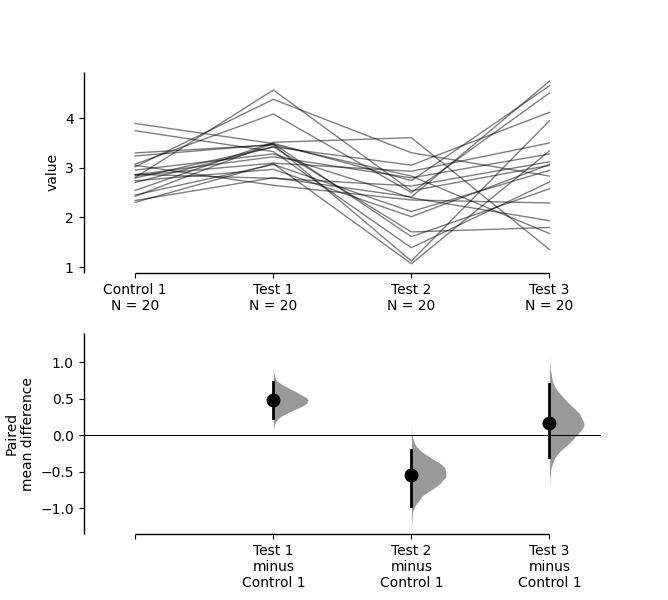
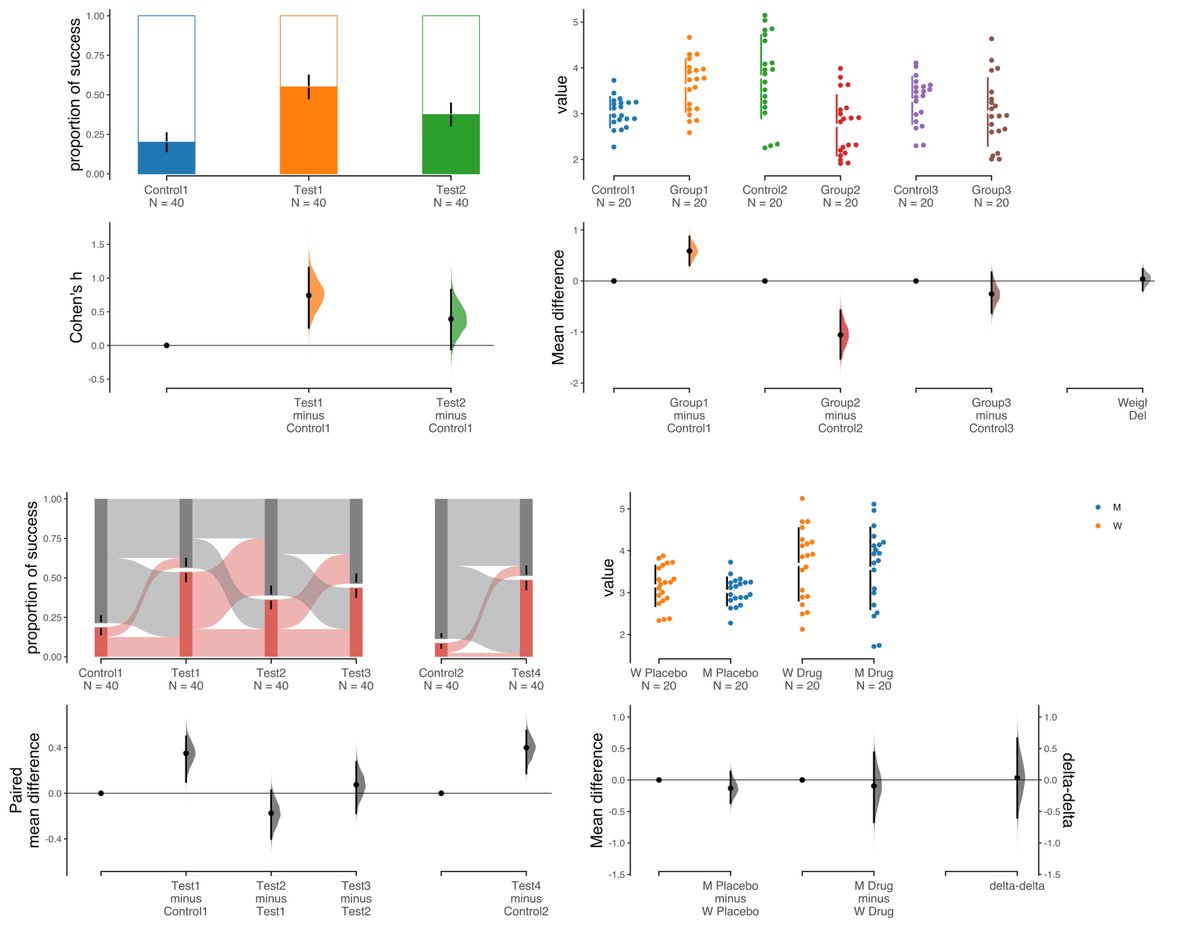
Exciting news for dabestr users! We are releasing dabestr version “Lapis” (v2023.9.12), which adds estimation graphics for four new data types: repeated measures, 2 × 2 designs, proportions, and easy meta-analyses. 🧵
Exciting news for dabestr users! We are releasing dabestr version “Lapis” (v2023.9.12), which adds estimation graphics for four new data types: repeated measures, 2 × 2 designs, proportions, and easy meta-analyses. 🧵
Contributors to this update were:
Kah Seng LIAN (https://t.co/LqYPdTI1y7),
Zhuoyu WANG (@LucasZhuoyu, https://t.co/nBjy0VvtJ0),
and Jun Yang LIAO (https://t.co/MWJs63oxDX)
📢To our R users: We will soon release a new version of dabestr (https://t.co/h6B1b5vSnc) with brand new goodies such as repeated measures, proportion plot, mini-meta and delta-delta. #rstats#datascience We want to know how you prefer to get the package (poll in next tweet): 1/2
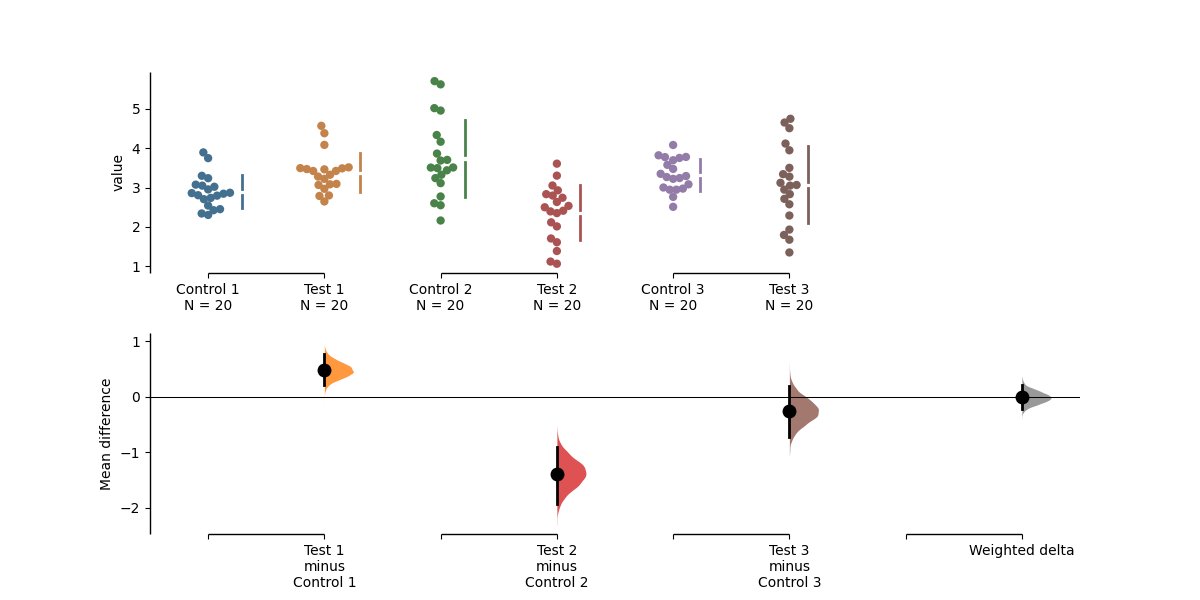
Today we are excited to launch DABEST’s first major update. The Python library now offers four new functions: repeated measures, the ∆∆ plot (‘delta-delta’), proportional plot, and mini-meta plot. These expand DABEST’s capabilities to more complex experimental designs. 🧵1/13