I am hiring two #postdoctoral fellows in #DataScience#Education. One position is to teach in the @UBCMDS grad program, another is to help develop undergrad courses @UBC. We are building a passionate & excellent #DataScience educator team here, join us!
https://t.co/uEyghjwe0f
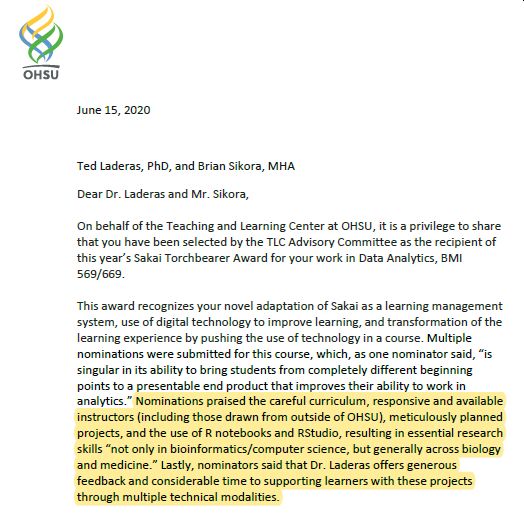
It feels strange to post this now, but I needed a win. Our Data Analytics course just won an award!
Chuffed, because I did not nominate myself, and grateful for the multiple nominations from our students. Thank you so much!
The second in our series of webinars with @techoregon is happening tomorrow! Tune in to learn how the Knight Campus Graduate Internship Program at @uoregon is training small cohorts of students in hands-on data science. Get the details and register: https://t.co/rqXs65HeGg
New blog post! Exploring gradient descent with linear regression. I program an algorithm from scratch in #rstats, and end up producing gifs like this, showing how the algorithm learns! #MachineLearning#ML https://t.co/dxy9TavX9g
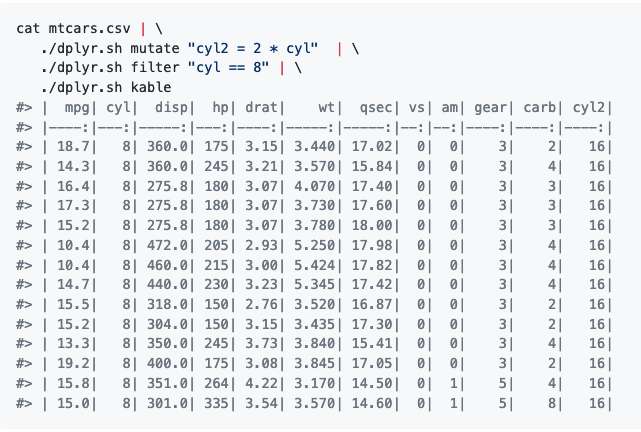
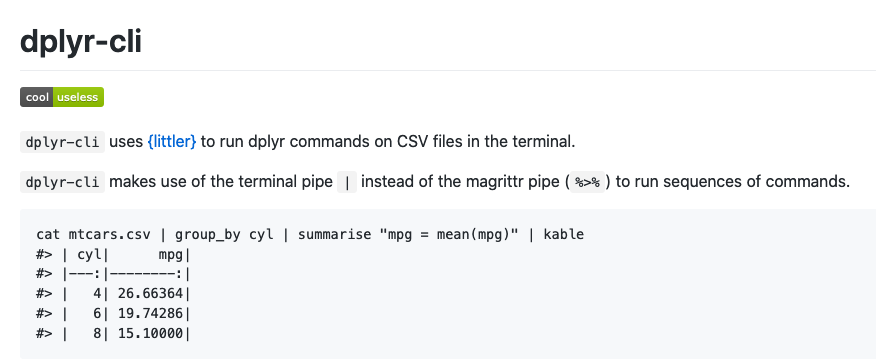
Introducing 'dplyr-cli' - a method for manipulating CSV files in bash/shell/terminal using #dplyr
Ever wanted to run a quick filter on a CSV file in the terminal without switching to #RStats? 'dplyr-cli' is for you!
github: https://t.co/YY3Ql36gGF
post: https://t.co/sS7nCnZpJb
CRAN is currently in the process of migrating the default toolchain for R 4.0 on Windows to the new rtools40 (gcc-8). There may be a bit of disruption while everything is being synchronized...
Verbal description:
0) Install your preferred WSL distro, e.g. Ubuntu
1) In RStudio: "Tools > Terminal > Terminal Options"
2) In the dropdown menu for "New terminals open with", select "Bash (Windows Subsystem for Linux)"
3) Refresh your RStudio Terminal (Alt+Shift+R)
4) Profit
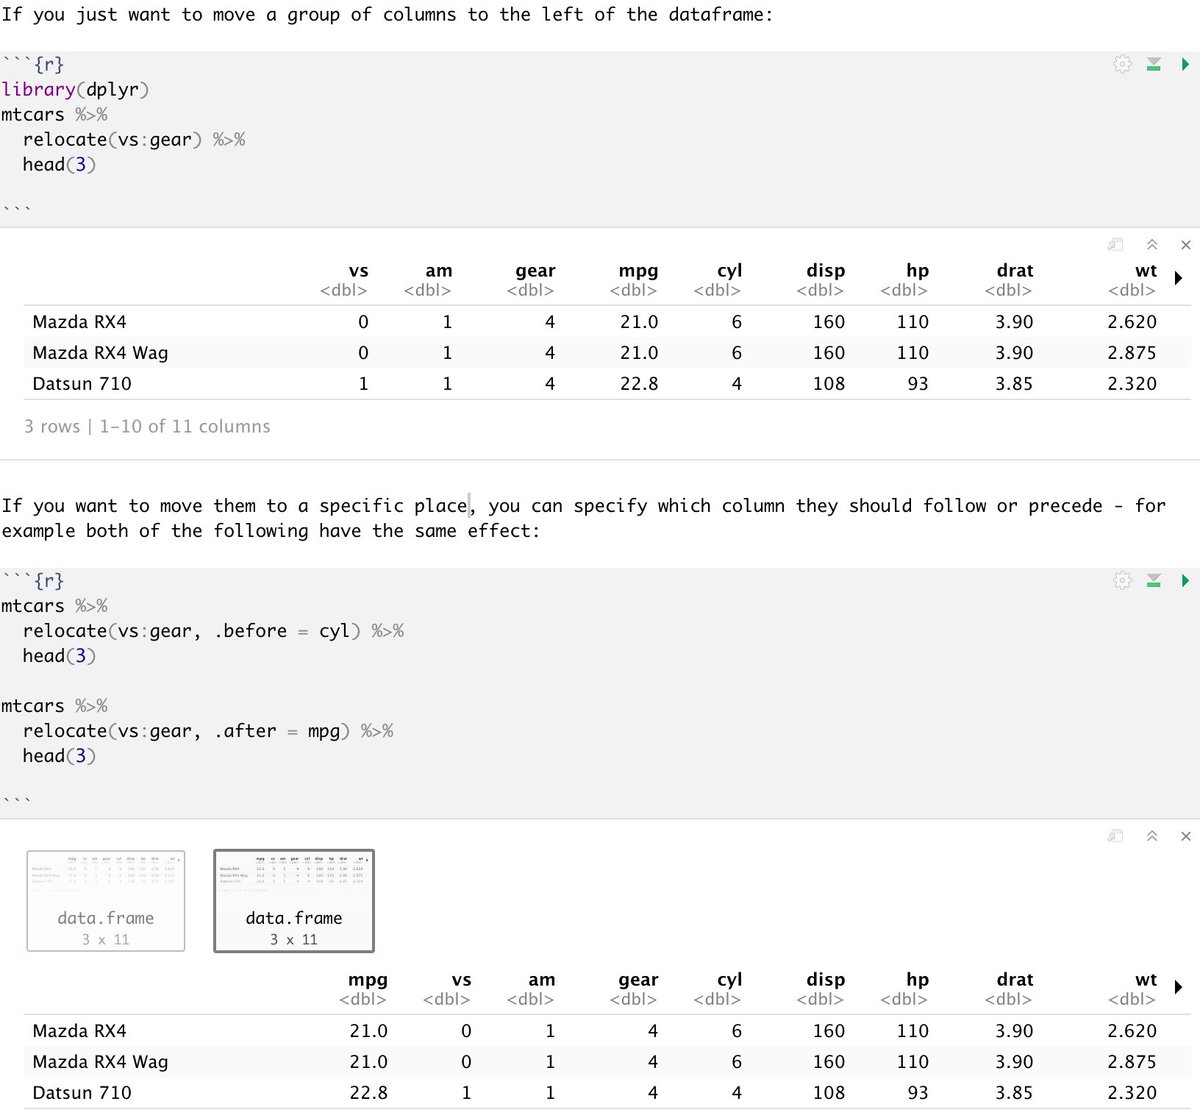
The new dplyr::relocate() function is for those of you who spend far too much time retyping column orders in dplyr::select() because your boss has data-OCD - or you do :) #rstats#r4ds#datascience#tidyverse
It's official! Data science is set to debut as @uoregon's newest major this fall. 🎓 View degree requirements and information on applying for the major: https://t.co/HJiolZinKh
My paper w/ @mijkenijk on how to conduct power analysis to detect a target effect in SEM (e.g., between latent factors) is in press at AMPPS! https://t.co/OEbF2kIBdv
With it, I am excited to introduce pwrSEM, an app for SEM power analysis: https://t.co/FkUnuRE1sY
Thread: 1/13
Introducing {ggpattern} - pattern & image fills for #ggplot
Heaps of fun! Bedazzle those plots!
My fav: placeholder kittens!
code: https://t.co/z5R7GgNLtl
Plenty of examples/vignettes are on display on the pkg site: https://t.co/3ZZ0J0c2qQ
#RStats#ggpattern
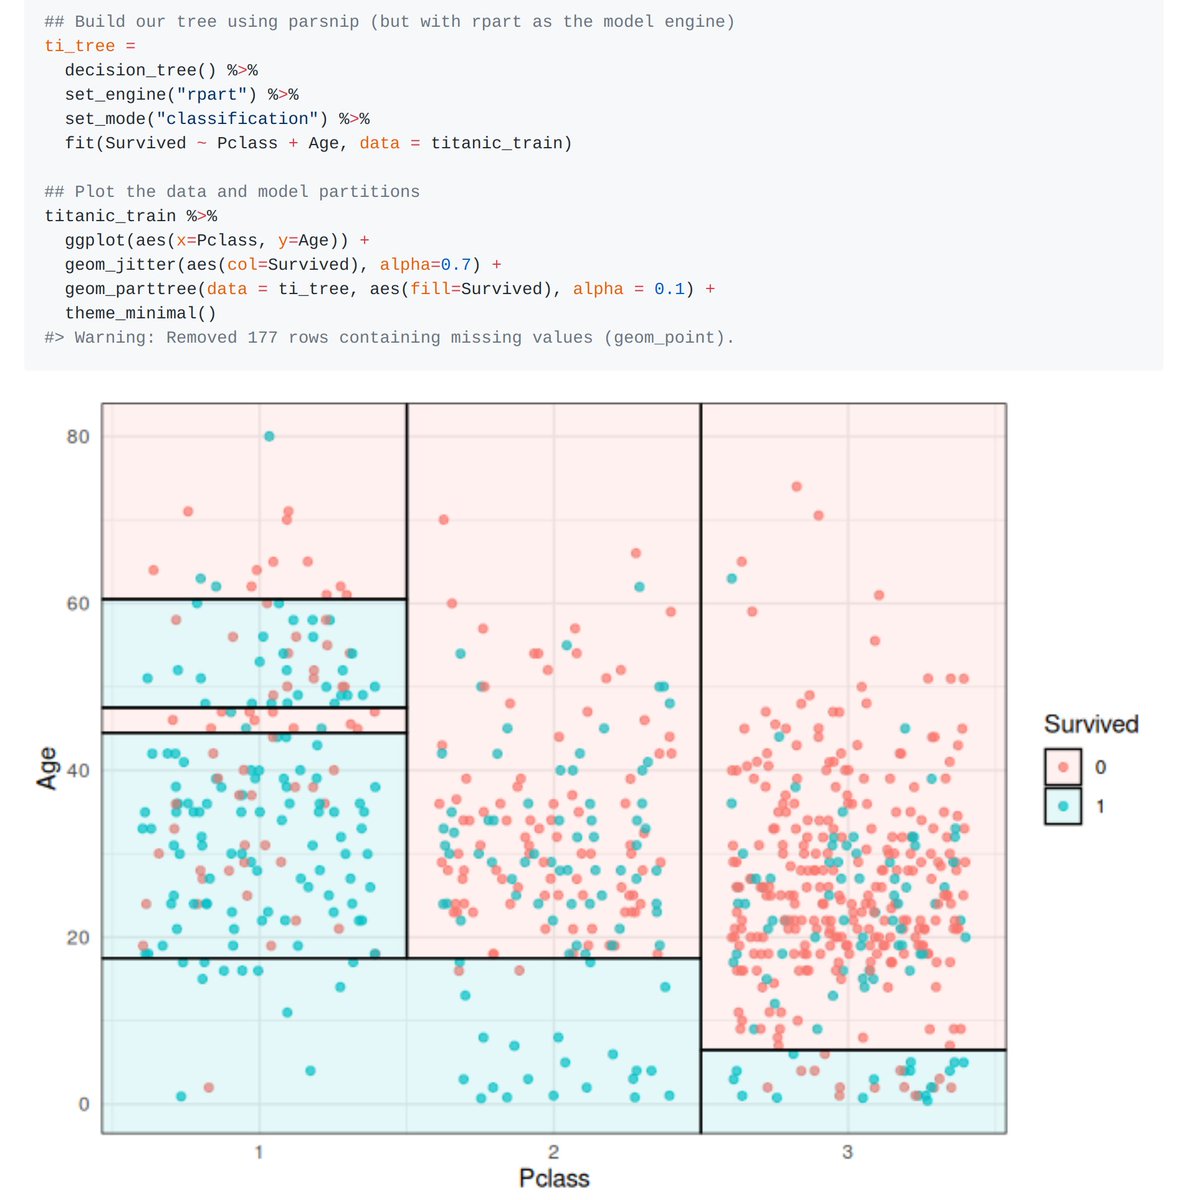
In teaching some intro-to-ML stuff, I've noticed that there's not a nice automated way to visualize decision tree partitions in #ggplot2.
So I packaged up some simple functions in my spare time (ha ha, I know). Feel free to kick the tyres. https://t.co/5bi4oR88ZB #rstats
Come join the conversation! R Consortium has started a new Slack channel to discuss COVID-19 related data visualizations tools and projects - https://t.co/3zDYeb3Mhg