$ITA
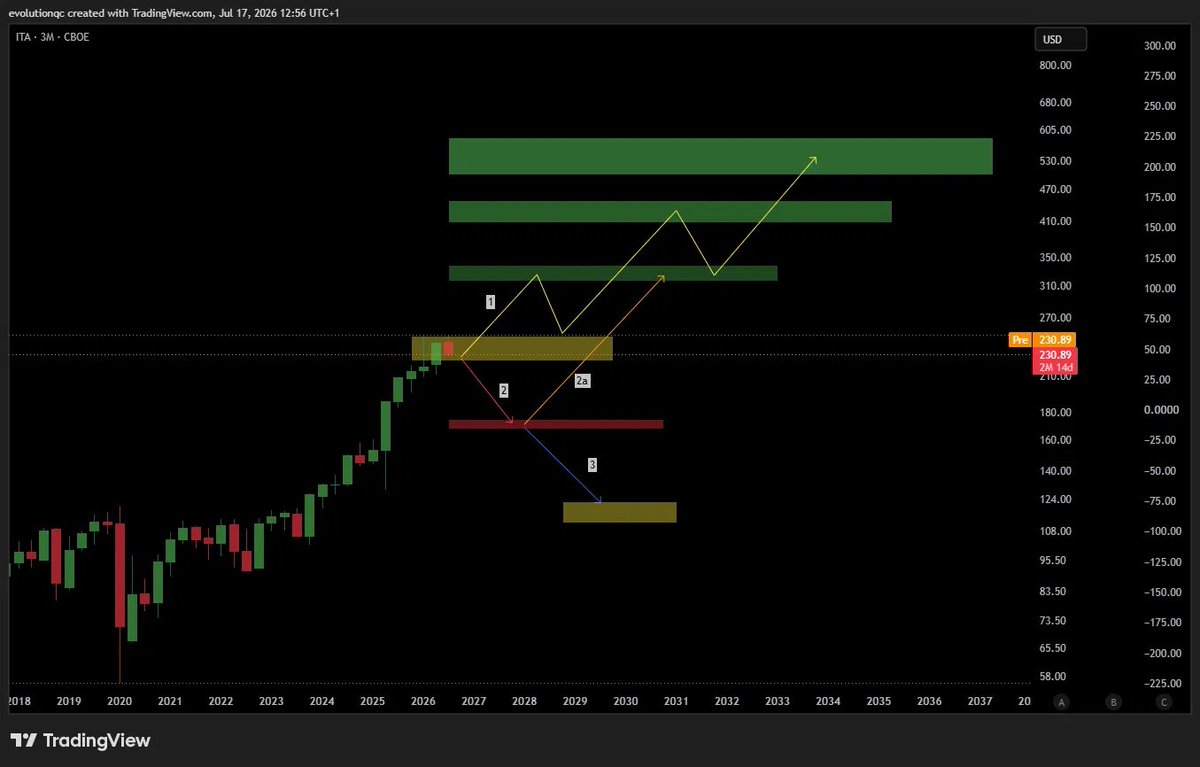
The defense sector has been in a steady structural advance for years, and price is now resting inside a zone of interest formed at the highs. Above it, three institutional areas sit stacked like floors of a building that has not been visited yet. Below, two support zones wait in silence, one shallow, one deep.
Scenario 1: the current zone holds. Price consolidates, builds energy, and begins the staircase climb, reacting at each overhead area, pulling back, and continuing. Trend continuation in its purest form.
Scenario 2: the zone fails first. Price rotates down into the shallow support area, the kind of reset long-term trends use to shake out weak hands before the real move.
Scenario 2a: from that reset, demand steps back in and the staircase resumes, this time with cleaner fuel underneath it.
Scenario 3: the shallow zone breaks. Then the deeper area becomes the destination, and the structural conversation changes entirely.
On a quarterly chart, patience is not a virtue. It is the entire strategy. The zones are drawn.
The path will reveal itself one candle at a time, and each candle takes three months.
$USOUSD
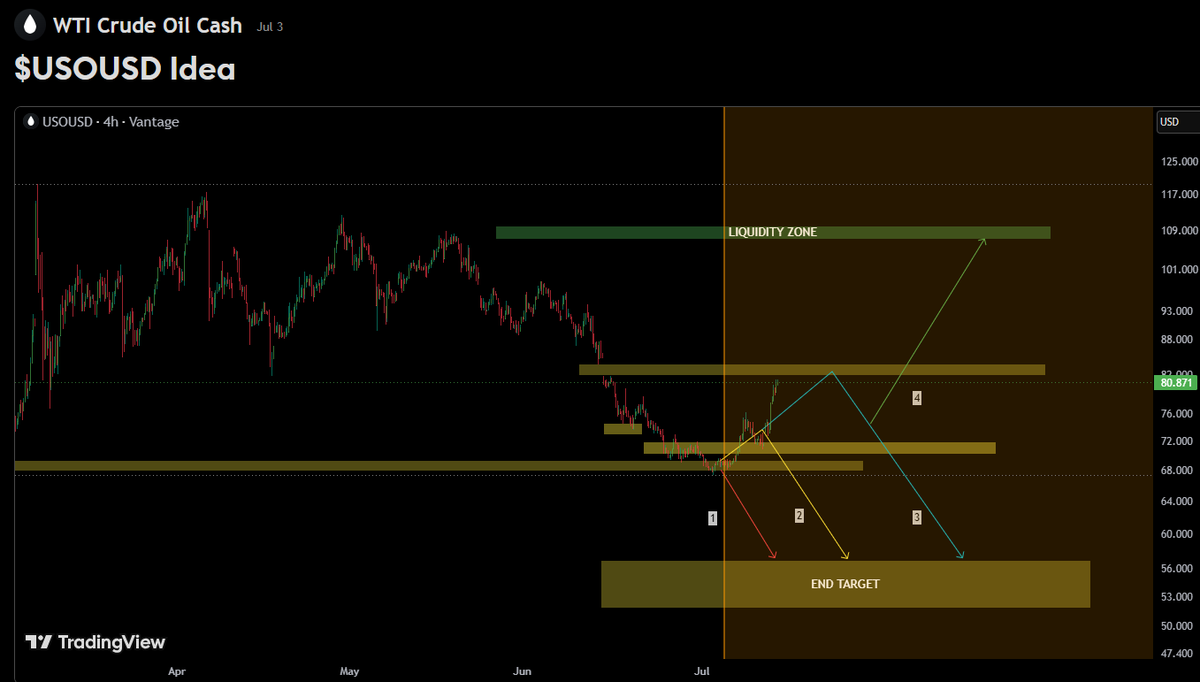
Two weeks ago oil sat on a weak low at 69 with four paths ahead. Paths 1 and 2 are gone. The low held, the 72-74 resistance cluster fell without a fight, and price ran straight into the gap at 81.7-82.2.
This is the decision zone. Only two paths remain.
Path 3: sellers defend the gap, the bounce dies here, and price rotates back down to collect the liquidity at 53-56. Deep retracement, same destination.
Path 4: buyers reclaim the gap and hold it. Structure flips bullish and the market hunts the liquidity above the strong high at 108-112. Two weeks ago this was the path nobody was positioned for. Today it is knocking on the door.
The reaction inside 81.7-82.2 decides everything. We do not predict it, we follow it.
Hidden in plain sight. EQC.
https://t.co/MJxBKOdOMC
https://t.co/yOP5RwpQFb
#WTI #CrudeOil #USOUSD #PriceAction
Follow, Boost, Join, Thank You!
Financial Disclaimer: This post is not financial advice. I am not your financial advisor, your life coach, or your legally responsible adult. Always do your own research and never trade based solely on internet comedy.
EQC Sector Rotation Analysis - 2026-06-14.
Where is the money moving this week?
Benchmark: SPY 1W: +0.6%
1W sector performance vs market:
Materials: +3.1% vs MKT +2.5%
Cons. Staples: +2.9% vs MKT +2.3%
Technology: +2.5% vs MKT +1.9%
Financials: +2.0% vs MKT +1.4%
Aero / Defense: +1.9% vs MKT +1.3%
Cons. Cyclical: +1.5% vs MKT +0.9%
Leaders: Materials Cons. Staples
Laggards: Comms Energy
Defensive rotation detected - money moving to low-beta sectors.
Normal inter-sector correlation (0.20).
Hidden in plain sight. EQC.
https://t.co/yOP5RwqouJ
#trading #ta #chartpatterns #tradingsetup #marketstructure #bullish #bearish #quanttrading #algotrading #stocks #forex #commodities #indices #crypto #eqc #evolutionqc #priceaction #technicalanalysis #investing #financialmarkets
Follow, Boost, Thank You! Warning: Financial Disclaimer: This post is not financial advice. I am not your financial advisor, your life coach, or your legally responsible adult. Always do your own research and never trade based solely on internet comedy.
bitcoin:native Three paths mapped above.
Path 1: demand holds, clean move to overhead supply. Path 2a: rally, deeper correction, same destination.
Path 2b: correction first, then the move. All three point to the same place.
But there is a rectangle at the bottom of this chart that nobody is talking about.
It sits far below everything else. It has been there since the foundation of this cycle. It is not a prediction. It is structure. And structure does not forget.
The system maps all of it. The comfortable paths and the one that makes people uncomfortable.
Hidden in plain sight. EQC.
#Bitcoin #BTC #Crypto #TechnicalAnalysis #MarketStructure
Follow, Boost, Thank You! ⚠️ Financial Disclaimer: This post is not financial advice. I am not your financial advisor, your life coach, or your legally responsible adult. Always do your own research and never trade based solely on internet comedy.
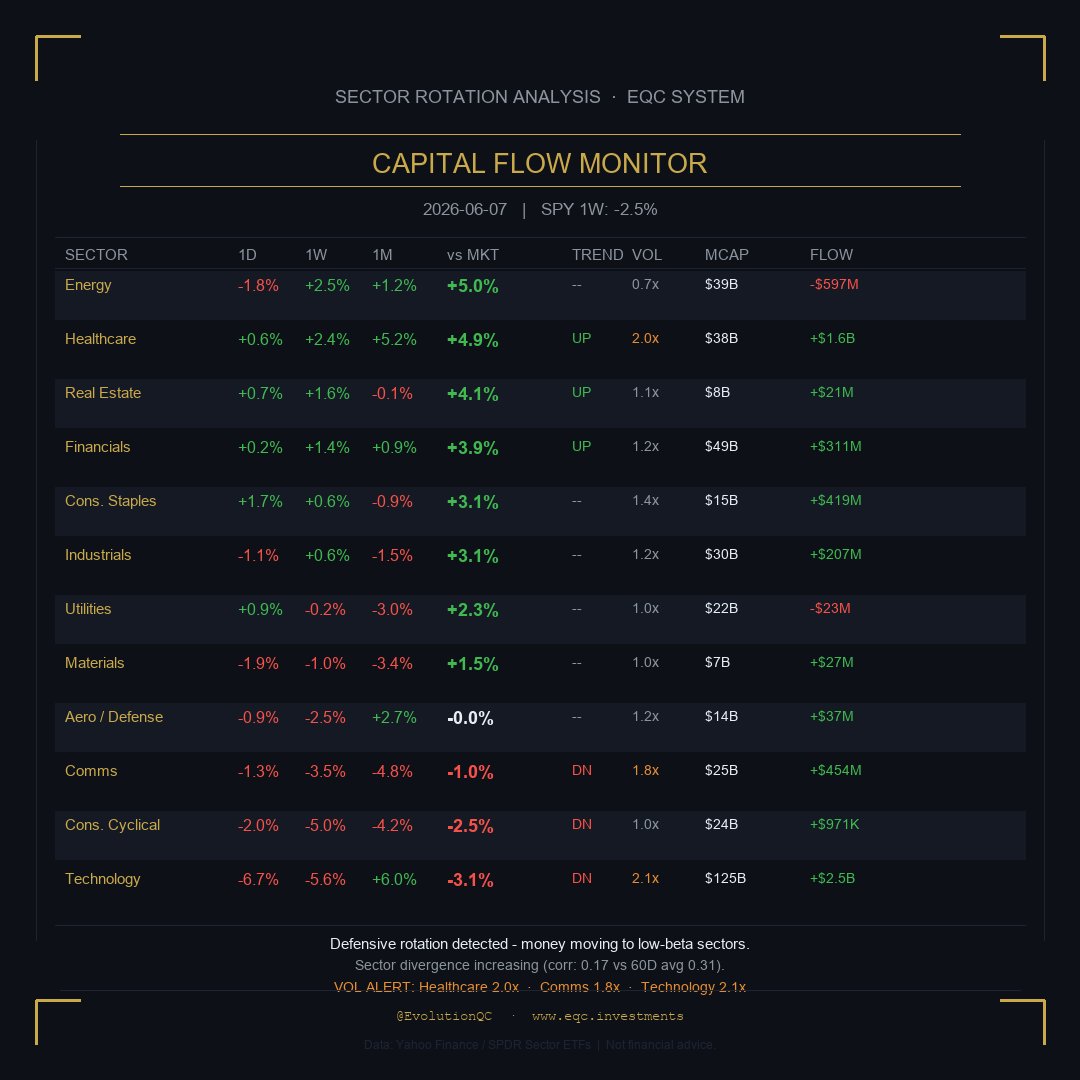
EQC Sector Rotation Analysis - 2026-06-07.
Where is the money moving this week?
Benchmark: SPY 1W: -2.5%
1W sector performance vs market:
Energy: +2.5% vs MKT +5.0%
Healthcare: +2.4% vs MKT +4.9%
Real Estate: +1.6% vs MKT +4.1%
Financials: +1.4% vs MKT +3.9%
Cons. Staples: +0.6% vs MKT +3.1%
Industrials: +0.6% vs MKT +3.1%
Leaders: Energy Healthcare
Laggards: Cons. Cyclical Technology
Unusual volume detected: Healthcare (2.0x avg volume), Comms (1.8x avg volume), Technology (2.1x avg volume)
Defensive rotation detected - money moving to low-beta sectors.
Sector divergence increasing (corr: 0.17 vs 60D avg 0.31).
Published weekly. Full analysis on TradingView.
Hidden in plain sight. EQC.
https://t.co/yOP5RwpQFb
#trading #technicalanalysis #tradingview #priceaction #chartanalysis #marketanalysis #riskmanagement #quantitative #systematictrading #tradingstrategy #stocks #investing #financialmarkets #marketstructure #eqc #hiddeninplainsight #swingtrading #chartpatterns #tradeideas #portfoliomanagement
Follow, Boost, Thank You! Warning: Financial Disclaimer: This post is not financial advice. I am not your financial advisor, your life coach, or your legally responsible adult. Always do your own research and never trade based solely on internet comedy.