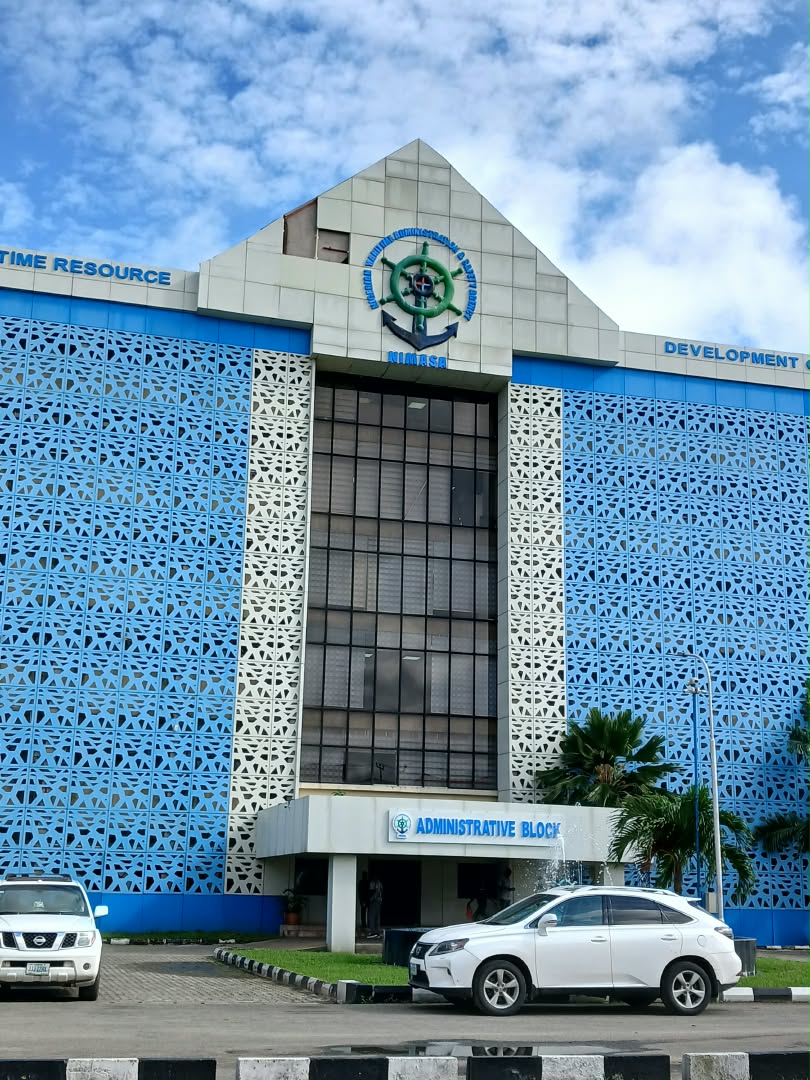
Excited to announce that I’ve started my Industrial Training at NIMASA in the Ballast Water Unit! 🚢⚓ I'll be applying marine biology & data analytics to ballast water management and invasive species control. Ready to learn, analyze, and build! 🌊📈#NIMASA#MarineBiology
As someone working at the intersection of Marine Biology and Data Analytics, seeing the foundations of our maritime heritage reinforces why protecting our marine ecosystems today matters so much for tomorrow. 🚀📊
Connecting the dots between historical navigation tools, early shipping logs, and modern maritime environmental management shows how rapidly the industry has evolved. 🌊
@Japa_Queen Having an inspriring, encouraging and helpful sister is just what your younger sister would desire in an elder sister
Cheers to grateness✨️
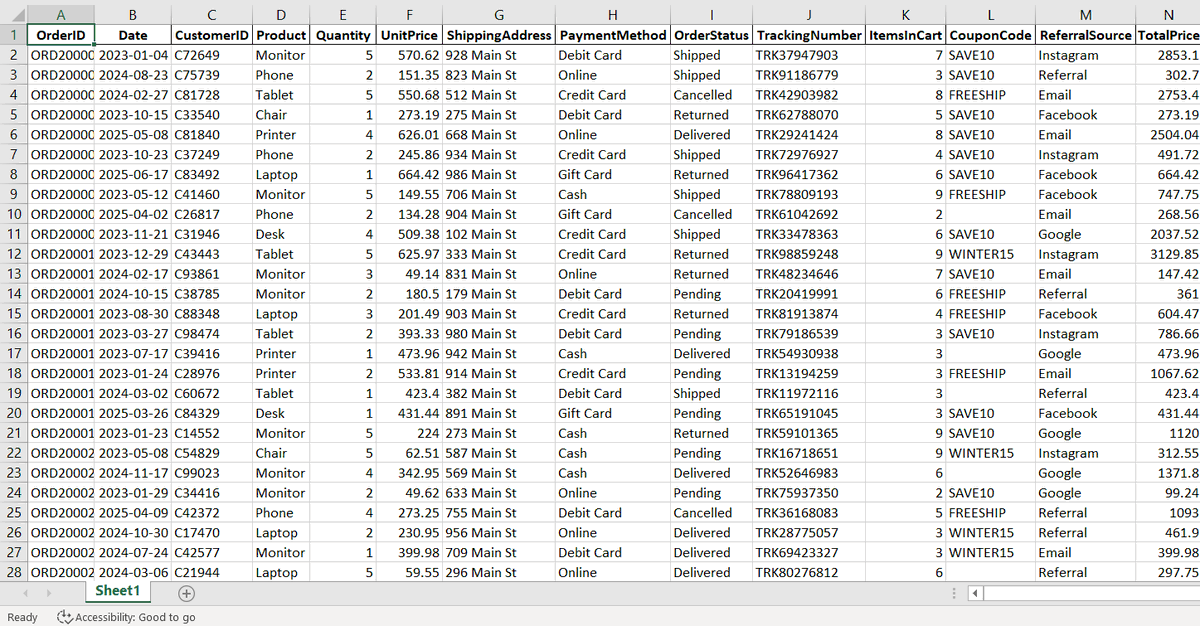
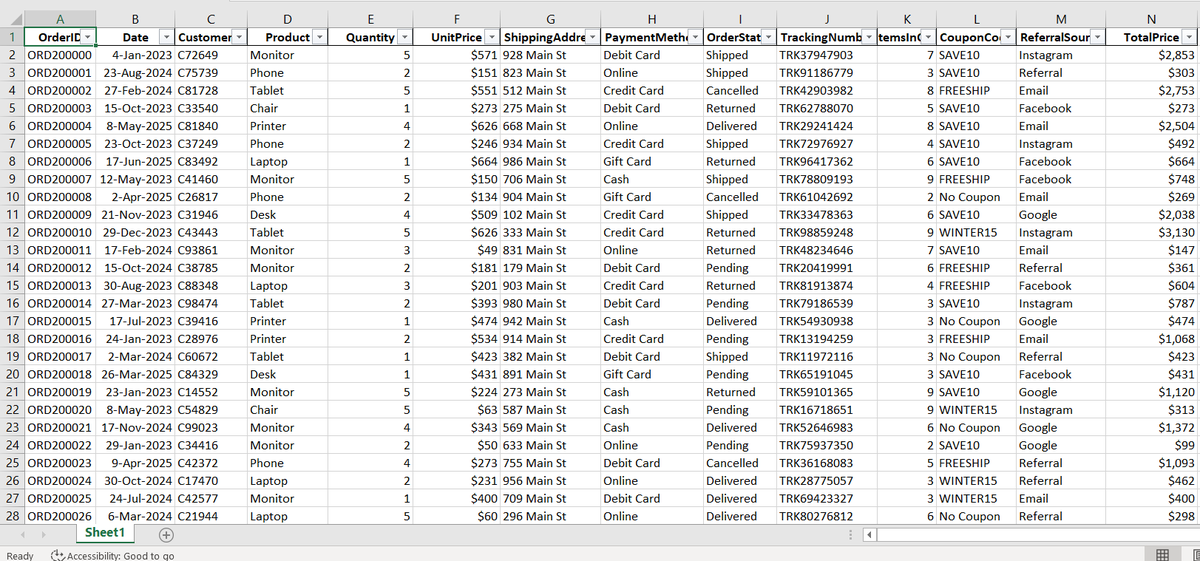
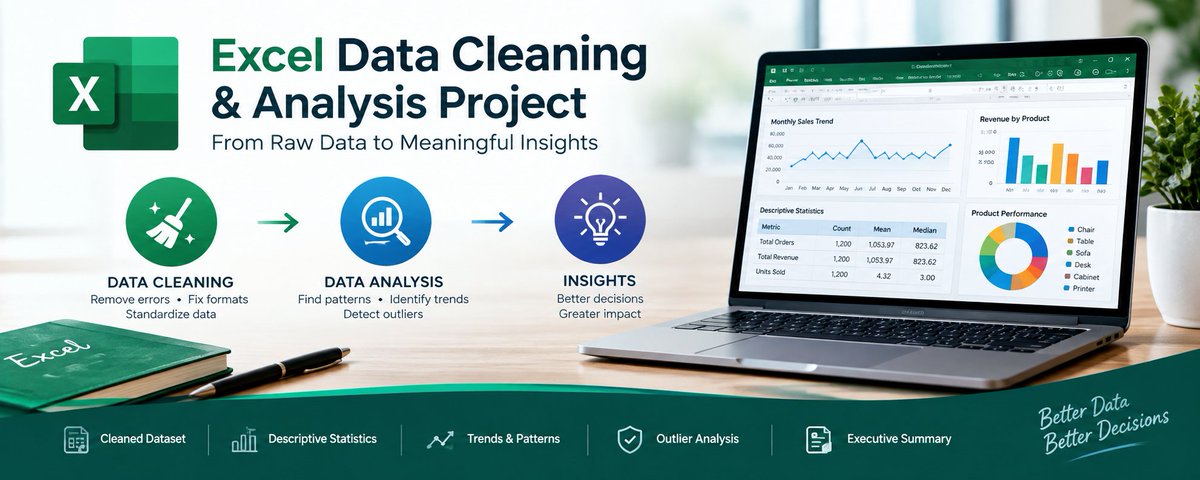
I completed my first internship project: an Excel Data Cleaning Project.
I worked on:
• Handling missing values
• Checking duplicates
• Standardizing dates & numbers
• Cleaning text fields
• Validating data for analysis
Raw → Cleaned → Analysis-ready.
#Excel#DecodeLab
Built using Power BI and Power Query, prioritizing a dark-mode UI/UX layout to minimize visual noise for stakeholders.
From writing SQL queries to perfecting interactive dashboards, I'm ready for the industry and open to Junior Data Analyst roles! Let's connect! 📊🚀
It's official! 🎓 I’ve successfully completed my Data Analysis certification with @NewHorizonsKSA . It’s been an incredible journey mastering the tools needed to turn messy datasets into clear business strategies. A brief thread on what I built to graduate
I put my skills to work building this E-Commerce Dashboard tracking $3.14M in revenue (2020-2026).
Key insights: • US is the primary revenue engine, led by Electronics. • Mid-tier categories like Sports & Outdoors show stable transactional velocity.
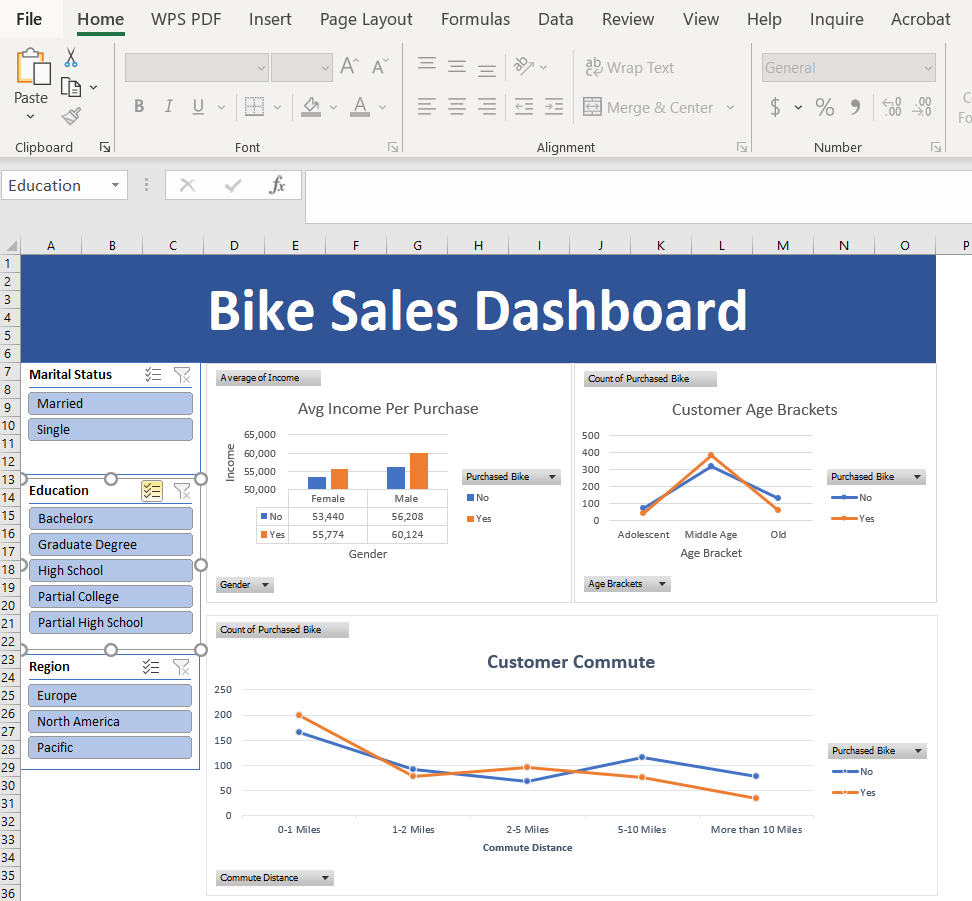
I spent some time turning raw transactional data into a story. I built this Bike Sales Dashboard to understand what drives customer purchasing behavior. Here is a quick breakdown of what the data revealed...
I built this using Pivot Tables, dynamic slicers, and multi-series charts to make it fully interactive for stakeholders.
I'm an aspiring Data Analyst deep-diving into Excel, SQL, and Power BI. If you’re part of #DataTwitter, let's connect!
The 3 key insights that stood out were:
• Middle-aged customers show the highest purchase rate.
• Customers with shorter commute distances are more likely to buy.
• Income levels act as a clear driver for conversion.
Hello #DataTwitter! 👋
I'm Oduwole Samuel, an aspiring Data Analyst currently deep-diving into Excel, SQL, and Power BI.
I’ll be sharing my projects, learning hurdles, and insights as I build in public. Looking forward to connecting with this amazing community! 📊🚀"