Being an investor means owning a business and participating in everything that business creates: its earnings, its cash flows, its growth.
Being a speculator means chasing prices and hoping the market cooperates.
Ben Graham said it best:
“A stock is not just a ticker symbol or an electronic blip; it is an ownership interest in an actual business, with an underlying value that does not depend on its share price.”
When you buy a good business at a good value, you are not just buying a stock. You are buying the right to participate in the growth of the business itself.
If you overpay, the math works against you. You now need the business to grow faster than expected, or you are relying on someone else to bail you out at a higher price.
When you purchase a business at a great value and you can sleep well at night because your focus is on the strength of the business itself.
Speculate on prices and you will lose your mind watching a stock quote that changes every second of every trading day.
Be the investor. Not the speculator.
#investing
Most investors have never heard of $AMT but they depend on their towers every day.
Here’s our deep dive into American Tower
VALUATION (from @FASTGraphs):
Blended P/AFFO: 16.81x
Normal P/AFFO: 22.20x
24% below its own historical multiple
AFFO yield: 5.95%
Dividend yield: 3.80%
Market cap: $86.20B
S&P credit rating: BBB+
Note: FAST Graphs values REITs on Adjusted Funds From Operations, not GAAP earnings. A tower depreciates on paper for decades while collecting the same rent, so reported earnings understate what the asset produces. Last quarter GAAP EPS was $1.64. AFFO per share was $2.87. Value this on earnings and it looks expensive. Value it on the cash the towers generate and it is trading at a discount to its own historical multiple.
THE BUSINESS:
American Tower owns communications towers across the United States and internationally, plus the CoreSite data center business. Carriers pay rent to hang antennas on the structure, under multi-year contracts with annual escalators built in. The second and third tenant on an existing tower cost almost nothing to add, which is where the margin comes from. AT&T, Verizon and T-Mobile are the anchor tenants in the US.
THE FUNDAMENTALS (2022 to 2025):
Revenue: $10.71B to $10.64B
Operating income: $3.11B to $5.04B
Operating margin: 29.01% to 47.36%
Operating cash flow: $3.70B to $5.46B
Return on invested capital: 5.39% to 9.32%
LT debt to capital: 84.32%
Revenue was flat for three years, partly from selling the India business. Operating income rose 62% anyway and operating margin expanded 18 points. The company shed its lowest-margin assets and got more profitable on the same top line.
AFFO HISTORY:
2013: $3.43
2017: $6.72
2021: $9.65
2025: $10.76
2028 estimate: $12.37
Dividend: $1.10 in 2013 to $6.72 in 2025, with $7.97 estimated by 2028. The quarterly payout was just raised 5.3%.
AFFO nearly tripled from 2013 to 2021, then stalled. Analysts model 3.35%, 4.36% and 6.59% growth through 2028.
On the Performance tab since 2011, AFFO per share is up 312.72% and the price is up 208.51%. AFFO growth outran the price meaning the multiple compressed.
Annualized returns: 20 years, 9.91% vs 9.59% for the S&P 500. Five years, -5.00% vs 11.85%.
THE CATCH:
Growth stalled after 2021. Sprint's merger into T-Mobile and then DISH's pullback meant tenants coming off towers. Rates rose, and a company with LT debt to capital of 84.32% feels every basis point. Enterprise value is $136B against an $86.20B market cap, roughly $50B of net debt.
The 22.20x normal multiple was earned during a decade of double-digit AFFO growth. A business growing 3% to 6% may not earn it back.
Management raised full-year guidance for the third time on Tuesday and called 2026 the trough year for AFFO growth, with acceleration expected in 2027.
The Forecasting tab shows what different multiples produce on the 2028 AFFO estimate of $12.37.
At the 5-year normal of 21.86x, the price would be $270.35, a 22.25% annualized return with dividends. At the current 16.81x, it is about $208 before dividends, closer to high single digits annualized with the 3.80% yield.
These are not predictions. The tab exists so you can see what you are implicitly assuming when you buy.
Two things to watch: whether 2027 AFFO growth lands above the 4.36% modeled, since management is calling 2026 the bottom, and how management uses the $2B buyback authorization approved last week.
$MEDP is trading at $660, up from $609 last week, when we posted this deep dive after posting earnings that beat expectations and expanding its buyback program.
Definitely a stock worth following.
$MEDP is up 1,603% since December 2016, and most investors have never heard of it.
VALUATION (from @FASTGraphs):
Blended P/E: 35.69x
Normal P/E: 29.78x since 2017, 34.18x over the last 5 years
Fair Value Ratio: 24.67x on the historical graph (P/E set equal to the 24.67% long-term earnings growth rate), 15.00x on the Forecasting tab (forward growth is 11.05%, and between 5% and 15% FAST Graphs applies a 15x multiple)
EPS yield: 2.80%
Dividend: none
Since December 2016, the price is up 1,603%, and earnings are up 1,017%. EPS growth did most of the work. Multiple expansion provided the rest of the return with the P/E roughly 50% higher today than in 2016.
THE BUSINESS:
When a biotech wants to test a drug, it usually doesn't have a large enough staff to run the trial so they hire a contract research organization like Medpace.
Medpace designs the study, recruits sites and patients, monitors data, manages regulators, and writes up results from Phase I through Phase IV; its labs also handle blood work and imaging. $MEDP has about 6,500 employees in 46 countries, and their customers are mostly small and mid-sized biotechs; the top five accounted for 31% of revenue over the last 12 months.
August Troendle reviewed drug applications at the FDA, ran cholesterol drug development at Sandoz, and founded Medpace in Cincinnati in 1992. Private equity bought an 80% stake in 2011 for $285 million. It sold that stake again in 2014 for about $900 million. The IPO came in August 2016 at $23 a share, and the proceeds paid down the buyout debt. Troendle is still chairman and CEO and owns 19.1% of the company.
Two things make the economics unusual for a services company. Customers pay up front: on June 30 Medpace held $905 million of advance billings against $442 million of receivables, and net days sales outstanding was negative 59.6. Clients fund the working capital, so operating cash flow runs well above net income: $713 million vs. $451 million last year. And it needs almost no capital. Investing cash flow was $31 million on $2.5 billion of revenue.
THE FUNDAMENTALS (2022 to 2025):
Revenue: $1.46B to $2.53B (20.11% CAGR)
Gross income: $410M to $732M (21.33% CAGR)
Operating income: $279M to $535M (24.27% CAGR)
Net income: $245M to $451M (22.53% CAGR)
Operating cash flow: $388M to $713M (22.49% CAGR)
Operating margin: 19.09% to 21.14%
Return on equity: 60.38% to 118.82%
Return on invested capital: 35.80% to 86.22%
LT debt/capital: 23.36% to 19.07%
Profit grew faster than revenue, and revenue slightly overstates growth: it includes costs Medpace bills through to clients without markup, $615 million of the $1.41 billion in the first half of 2026. The 118.82% return on equity is a buyback artifact. Medpace spent $913 million repurchasing shares in the first half of 2025 and equity fell from $826 million to $459 million. The diluted share count has gone from 39.8 million in 2017 to 28.6 million last quarter, down 28%, with no borrowings. The LT debt/capital figure is lease liabilities, and TEV is $17.04B against a $17.02B market cap.
EPS HISTORY:
2017: $1.52
2018: $2.59
2020: $3.84
2022: $7.28
2024: $12.63
2025: $15.28
2026 estimate: $17.59
2027 estimate: $19.27
2028 estimate: $21.56
$1.52 to $15.28 in eight years, about 33% a year, with one down year, a 1% dip in 2017. The company guides 2026 to $17.25 to $17.95. Analysts model 15%, 10% and 12% from here.
THE CATCH:
Growth is slowing while the multiple remains near all-time highs. The 24.67% rate behind the Fair Value Ratio covers 2017 to 2025. The Forecasting tab uses the forward rate, 11.05%, and at that growth FAST Graphs sets fair value at 15x, which is $323 on 2028 EPS of $21.56. So if the multiple compresses to 15x the stock would be down nearly 50%
At its 5-year normal P/E of 34.18x, the share price would be $736.92 in FY28 which would be an estimated annual return of 8.91%. At the long term normal multiple of 29.78x the share price would be $642, about 5% above today with no dividend along the way.
A strong return from here depends on investors continuing to pay about 34 times earnings for 11% growth.
Predictability is 33/100. Earnings are highly volatile. Shares fell 15% in February when net bookings came in at 1.04 times revenue versus the expected 1.15. Shares fell 22% on April 23 when the ratio fell to 0.88 and cancellations jumped. Then shares were up 18% after the close on July 22 when it reached 1.13 and net new awards hit a record $795.7 million.
On the July call, Troendle said cancellations are completely beyond his ability to predict. Revenue grew 21.7% in the first half while backlog grew 4.9% because Medpace is converting backlog to revenue at 24% per quarter, up from a historical rate near 18%. The guidance of $2.805 billion to $2.885 billion implies second-half revenue growth of 2% to 7.5%. Oncology accounted for more than half of bookings in Q2, and the large cardiometabolic programs behind much of the recent growth are winding down.
The founder has been selling. Troendle's filings show 5,653,390 shares in March and 5,396,508 in September, with August sales between $600 and $628.
If you enjoyed this post give us a follow @FASTGraphs and check out our previous deep dives into $XPEL, $KNSL, $HEI and $CASY in the comments below 👇
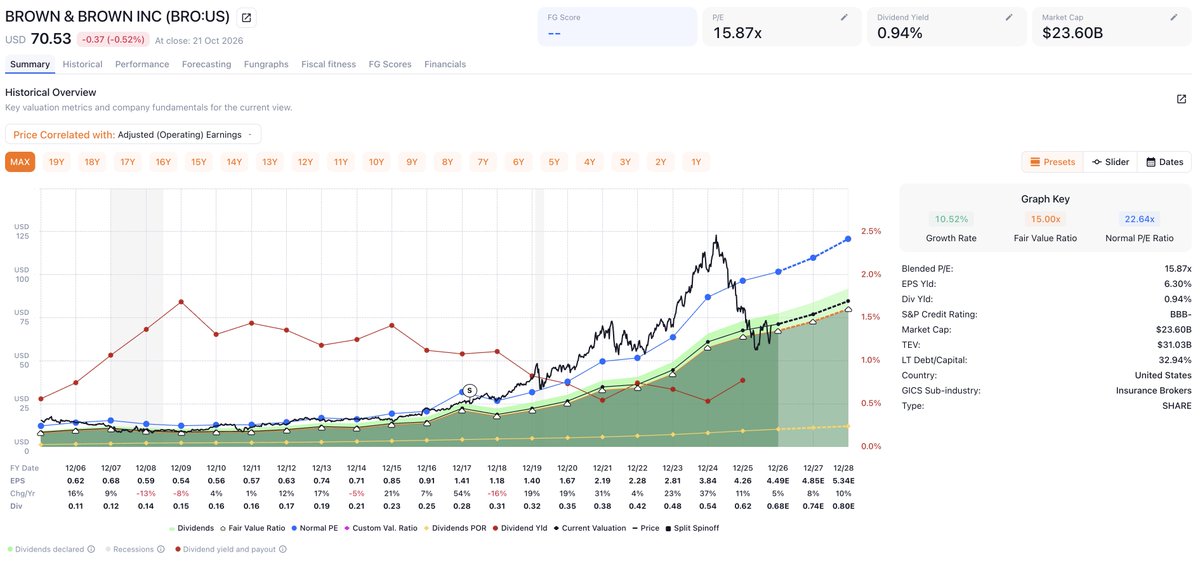
$BRO has raised its dividend for 33 years in a row, but the stock is down 43%.
Is this a buying opportunity or a falling knife?
VALUATION (from @FASTGraphs):
Blended P/E: 15.87x
Normal P/E: 22.64x over 20 years
5-year normal P/E: 26.31x
EPS yield: 6.30%
Dividend yield: 0.94%
Since December 2006, earnings are up 729%, while the stock price is up 361%, lowering the P/E from roughly 28x in 2006 to 16x today.
The stock peaked near $125 in March 2025, at a P/E of roughly 29x. Four quarters later it's at $70 and a blended P/E near 16x.
THE BUSINESS:
When a trucking company, a hospital, or a city needs insurance, it usually does not call an insurer. It calls a broker, who shops the risk to carriers, negotiates the terms, and collects a commission on the premium every year the policy renews. Brown & Brown is one of the world's five largest insurance brokers: $5.9 billion in revenue in 2025, about 23,000 employees, and more than 700 offices.
It carries no underwriting risk. The carriers pay the claims.
$BRO was founded in Daytona Beach in 1939. Hyatt Brown joined the family agency in 1959, bought it out, became CEO in 1961, and ran it for 48 years, listing it on the NYSE in 1993.
His son Powell has served as CEO since 2009, and Hyatt remains chairman. The company grew through hundreds of acquisitions of smaller agencies with operating margins near 30%, and it joined the S&P 500 in 2021. One segment sells insurance and benefits to businesses, governments and individuals. The other sells to other brokers and runs insurance programs on behalf of carrierBsR.
THE FUNDAMENTALS (2022 to 2025):
Revenue: $3.57B to $5.90B (18.25% CAGR)
Operating income: $1.04B to $1.70B (17.56% CAGR)
Net income: $659M to $1.04B (16.53% CAGR)
Operating cash flow: $881M to $1.45B (18.05% CAGR)
Operating margin: 29.23% to 28.72%
Return on equity: 15.03% to 9.62%
Return on invested capital: 9.35% to 7.32%
LT debt/capital: 44.23% to 34.87%
Profit grew with revenue, and margins held. In 2025, the company doubled in size.
Total assets went from $17.80B to $30.65B, equity from $6.44B to $12.57B, and the company spent $7.91B on acquisitions, with $7.71B raised in stock and debt.
Return on equity and invested capital fell because the new capital arrived in June and the acquired earnings only started in August. After the acquisition, Enterprise value stands at $31.03B against a $23.60B market cap.
EPS HISTORY:
2006: $0.62
2011: $0.57
2016: $0.91
2020: $1.67
2023: $2.81
2024: $3.84
2025: $4.26
2026 estimate: $4.49
2027 estimate: $4.85
2028 estimate: $5.34
EPS growth has depended on the strength of the broader insurance market. No growth for five years from 2006 to 2011. Then $0.57 to $4.26 over 14 years, about 15% a year. The 54% jump in 2017 and 16% drop in 2018 on the chart are the 2017 tax law passing through the numbers. Analysts model 5%, 8%, and 10% from here. The dividend went from $0.11 to $0.62 over the same 20 years, requiring roughly 15% of earnings.
THE CATCH:
Revenue grew 35% in Q1 and 30% in Q2. Almost all of that growth was from acquisitions. The core Brown & Brown business grew 10.4% in 2024, 2.8% in 2025, was flat in Q1 of 2026, and -0.7% in Q2, excluding contingent commissions. A broker's commission is a percentage of the premium, so when rates fall, the same clients pay less. Catastrophe property rates fell 15% to 35% last quarter, and management expects more. The last time rates fell like this is the 2006 to 2011 stretch on the chart.
The company bought Accession Risk Management for $9.825 billion, its largest deal to date, closing on August 1, 2025. It paid with about $4 billion of new stock sold at $102 a share in June 2025, another $1.2 billion of stock issued to Accession's owners at $110.57, and debt. The stock is at $70.53 today, 31% below the offering price, and the company has since bought back about $500 million of shares in the 60s. A $400 million note comes due in December. The market's other worry is that software replaces the middleman. Management announced AI partnerships this year and says the benefits will arrive in three to five years.
In its favor: adjusted EPS still grew 7.8% in the first quarter and 3.9% in the second, with zero organic growth, because Accession's earnings came in. The FAST Graphs Analyst Scorecard shows Brown & Brown beat both the one and two-year estimates 55% of the time and hit estimates the other 45%, with no misses.
On the Forecasting tab, 2028 EPS of $5.34 at the 5-year normal P/E of 26.31x results in a share price of $140.37, a 37.57% estimated annual return with dividends.
At the 20-year normal P/E of 22.64x, the share price would be $121. At the 15x fair value multiple, it would be $80.
These scenarios are based on analyst estimates, which can be wrong. They are not predictions or recommendations to buy or sell the stock.
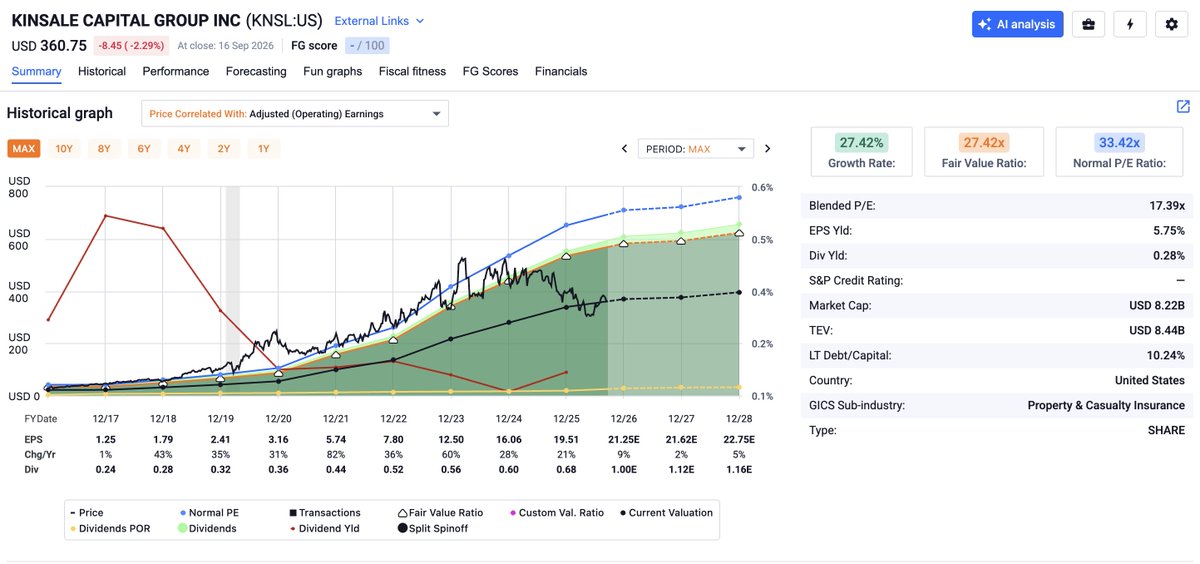
$KNSL might be the best business most investors have never heard of.
THE BUSINESS:
Kinsale writes excess & surplus insurance. These are the commercial risks standard carriers won't touch: the contractor with a rough loss history, the niche operation nobody has priced before. It's one of the few corners of insurance where underwriting skill still decides who wins.
Kinsale built its own technology to quote these risks faster and at a lower expense ratio than competitors, and it's founder-led with real insider ownership.
THE FUNDAMENTALS (2022 to 2025):
Revenue: $819M to $1.87B (31.73% CAGR)
Net income: $159M to $504M (46.81% CAGR)
Operating margin: 24.43% to 34.42%
Return on equity: 28.25%
LT debt/capital: 20.80% down to 10.27%
Net income grew faster than revenue. Margins expanded nearly 10 points. Debt got cut in half. The business got better as it grew,
EPS HISTORY:
2017: $1.25
2025: $19.51
Over 15x in eight years. Not a single down year.
VALUATION (from @FASTGraphs ):
Blended P/E: 17.39x
Normal P/E: 33.42x
Trading near HALF its historical multiple
THE CATCH:
EPS growth is slowing: 60%, 28%, 21%, then 9%, 2%, 5%.
The E&S market is softening after years of hard pricing. The business is still excellent. But the growth that earned a 33x multiple is not the growth analysts are modeling from here.
Cheap compared to its historical multiple. The question is what multiple will investors be willing to pay moving forward?
$MEDP is up 1,603% since December 2016, and most investors have never heard of it.
VALUATION (from @FASTGraphs):
Blended P/E: 35.69x
Normal P/E: 29.78x since 2017, 34.18x over the last 5 years
Fair Value Ratio: 24.67x on the historical graph (P/E set equal to the 24.67% long-term earnings growth rate), 15.00x on the Forecasting tab (forward growth is 11.05%, and between 5% and 15% FAST Graphs applies a 15x multiple)
EPS yield: 2.80%
Dividend: none
Since December 2016, the price is up 1,603%, and earnings are up 1,017%. EPS growth did most of the work. Multiple expansion provided the rest of the return with the P/E roughly 50% higher today than in 2016.
THE BUSINESS:
When a biotech wants to test a drug, it usually doesn't have a large enough staff to run the trial so they hire a contract research organization like Medpace.
Medpace designs the study, recruits sites and patients, monitors data, manages regulators, and writes up results from Phase I through Phase IV; its labs also handle blood work and imaging. $MEDP has about 6,500 employees in 46 countries, and their customers are mostly small and mid-sized biotechs; the top five accounted for 31% of revenue over the last 12 months.
August Troendle reviewed drug applications at the FDA, ran cholesterol drug development at Sandoz, and founded Medpace in Cincinnati in 1992. Private equity bought an 80% stake in 2011 for $285 million. It sold that stake again in 2014 for about $900 million. The IPO came in August 2016 at $23 a share, and the proceeds paid down the buyout debt. Troendle is still chairman and CEO and owns 19.1% of the company.
Two things make the economics unusual for a services company. Customers pay up front: on June 30 Medpace held $905 million of advance billings against $442 million of receivables, and net days sales outstanding was negative 59.6. Clients fund the working capital, so operating cash flow runs well above net income: $713 million vs. $451 million last year. And it needs almost no capital. Investing cash flow was $31 million on $2.5 billion of revenue.
THE FUNDAMENTALS (2022 to 2025):
Revenue: $1.46B to $2.53B (20.11% CAGR)
Gross income: $410M to $732M (21.33% CAGR)
Operating income: $279M to $535M (24.27% CAGR)
Net income: $245M to $451M (22.53% CAGR)
Operating cash flow: $388M to $713M (22.49% CAGR)
Operating margin: 19.09% to 21.14%
Return on equity: 60.38% to 118.82%
Return on invested capital: 35.80% to 86.22%
LT debt/capital: 23.36% to 19.07%
Profit grew faster than revenue, and revenue slightly overstates growth: it includes costs Medpace bills through to clients without markup, $615 million of the $1.41 billion in the first half of 2026. The 118.82% return on equity is a buyback artifact. Medpace spent $913 million repurchasing shares in the first half of 2025 and equity fell from $826 million to $459 million. The diluted share count has gone from 39.8 million in 2017 to 28.6 million last quarter, down 28%, with no borrowings. The LT debt/capital figure is lease liabilities, and TEV is $17.04B against a $17.02B market cap.
EPS HISTORY:
2017: $1.52
2018: $2.59
2020: $3.84
2022: $7.28
2024: $12.63
2025: $15.28
2026 estimate: $17.59
2027 estimate: $19.27
2028 estimate: $21.56
$1.52 to $15.28 in eight years, about 33% a year, with one down year, a 1% dip in 2017. The company guides 2026 to $17.25 to $17.95. Analysts model 15%, 10% and 12% from here.
THE CATCH:
Growth is slowing while the multiple remains near all-time highs. The 24.67% rate behind the Fair Value Ratio covers 2017 to 2025. The Forecasting tab uses the forward rate, 11.05%, and at that growth FAST Graphs sets fair value at 15x, which is $323 on 2028 EPS of $21.56. So if the multiple compresses to 15x the stock would be down nearly 50%
At its 5-year normal P/E of 34.18x, the share price would be $736.92 in FY28 which would be an estimated annual return of 8.91%. At the long term normal multiple of 29.78x the share price would be $642, about 5% above today with no dividend along the way.
A strong return from here depends on investors continuing to pay about 34 times earnings for 11% growth.
Predictability is 33/100. Earnings are highly volatile. Shares fell 15% in February when net bookings came in at 1.04 times revenue versus the expected 1.15. Shares fell 22% on April 23 when the ratio fell to 0.88 and cancellations jumped. Then shares were up 18% after the close on July 22 when it reached 1.13 and net new awards hit a record $795.7 million.
On the July call, Troendle said cancellations are completely beyond his ability to predict. Revenue grew 21.7% in the first half while backlog grew 4.9% because Medpace is converting backlog to revenue at 24% per quarter, up from a historical rate near 18%. The guidance of $2.805 billion to $2.885 billion implies second-half revenue growth of 2% to 7.5%. Oncology accounted for more than half of bookings in Q2, and the large cardiometabolic programs behind much of the recent growth are winding down.
The founder has been selling. Troendle's filings show 5,653,390 shares in March and 5,396,508 in September, with August sales between $600 and $628.
If you enjoyed this post give us a follow @FASTGraphs and check out our previous deep dives into $XPEL, $KNSL, $HEI and $CASY in the comments below 👇
$XPEL is up 71,115% since December 2011 and most investors have never heard of it.
VALUATION (from @FASTGraphs):
Blended P/E: 21.85x
Normal P/E: 27.14x
Fair Value Ratio: 33.53x (P/E set equal to the 33.53% long term earnings growth rate)
EPS yield: 4.58%
Since December 2011 EPS is up 6,886%. So price outran earnings by about 10 to 1. The stock is currently still roughly 50% below its 2021 peak when the stock hit $103 and traded at a 90x P/E multiple. Everything since has been the multiple coming down while earnings kept growing.
THE BUSINESS:
XPEL sells paint protection film: a clear urethane layer installed over a car's paint that takes the rock chips and scratches instead of the paint, and heals light marks with heat. It also sells window tint, ceramic coatings and architectural window film.
Surprisingly, the company got its start in San Antonio in 1997 as a software company. The founders built a database of digital cutting patterns so installers could plot film to fit a specific vehicle instead of trimming it by hand on the paint with a razor. That software, DAP, is key to XPEL's success. It is the industry's largest pattern library, installers run their shops on it, and switching film brands means giving it up.
Ryan Pape became CEO in February 2009 with the stock at $0.04 and a market cap near $1 million, and put company debt on his personal credit cards to keep it alive. Revenue was roughly $3 million that year and under Pape's leadership, has grown to $476 million as of FY 25. Along the way XPEL bought its distributors in Canada, France, Australia and India, took a majority stake in its China distributor in 2025, and built its own installation centers. It now owns the software, the distribution and a growing share of the installs.
THE FUNDAMENTALS (2022 to 2025):
Revenue: $324M to $476M (13.69% CAGR)
Gross income: $128M to $201M (16.38% CAGR)
Net income: $41.4M to $51.2M (7.37% CAGR)
Operating cash flow: $12.1M to $66.9M (77.05% CAGR)
Operating margin: 16.65% to 13.03%
Return on equity: 38.05% to 19.69%
Return on invested capital: 28.23% to 17.58%
LT debt/capital: 22.85% to 5.51%
Over the last few years, Gross margin went up while Operating margin went down. The difference is operating expenses, which nearly doubled from $73.6M to $139.0M with revenue growing 47%. Net income grew at about half the rate of revenue. Cash is the bright spot. Operating cash flow went from less than a third of net income in 2022 to 1.3 times net income in 2025, and long term debt was cut to almost nothing.
EPS HISTORY:
2017: $0.04
2018: $0.32
2021: $1.14
2023: $1.91
2024: $1.65
2025: $1.85
2026 estimate: $2.22
2027 estimate: $2.89
2028 estimate: $4.10
$0.04 to $1.85 in eight years with one down year. In 2024 revenue growth slowed to 6% and EPS actually fell 14% as their Chinese distributor worked down inventory and high end car sales cooled. EPS Growth came back at 12% in 2025 and analysts model 20%, 30% and 42% in FY 26, 27, and 28.
THE CATCH:
The 33.53% growth rate behind the Fair Value Ratio covers the whole period back to 2012, when EPS was $0.05. The last three years net income grew at 7.37%. A 33.53x fair value multiple only means something if growth returns to something close to the old rate, and the estimates assume it does: 20% this year, 30% next year, 42% in 2028.
XPEL is currently at a cross roads. The company has never manufactured its own film. Historically, it has bought film from a supplier, and its edge was software, brand and distribution, which is how it earned a 28% return on invested capital with very little capital required.
In 2025 and 2026 management committed about $110 million to bring manufacturing in house: a 435,000 square foot site in San Antonio and a film plant in China. The San Antonio site alone cost $60.4 million. Management expects the margin benefit to start in mid 2027. Until then, the asset light company that earned the historical multiple is becoming a manufacturer.
At 21.85x against a 27.14x Normal P/E and a 4.58% earnings yield, XPEL screens as cheap relative to its own history, and the recent quarters hold up: Q2 revenue grew 14.7% with gross margin at 44.1%.
Two things to check before treating the discount as an opportunity. Whether operating margin turns back up from 13.03% now that the acquisitions are in the numbers. And the second half: first half 2026 EPS was $1.02, up 13%, so the $2.22 full year estimate needs about $1.20 in the second half, up 26% from the same period last year.
That acceleration either shows up in the Q3 report in November or the 20% estimate comes down.
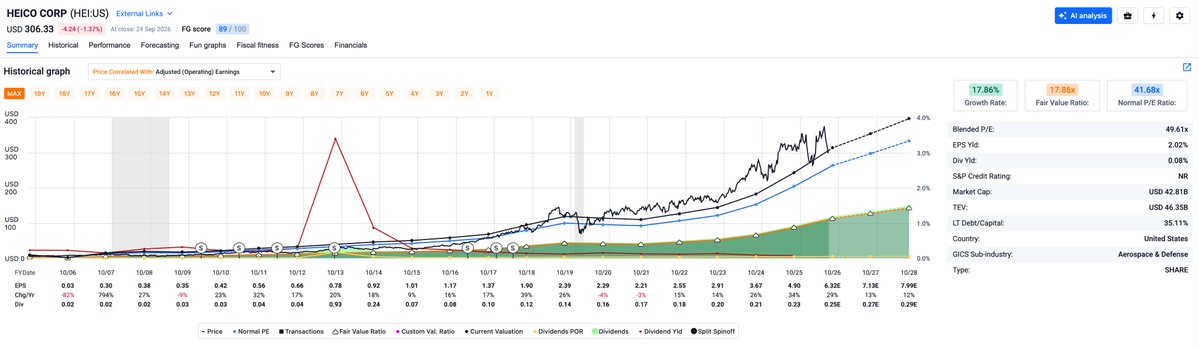
$HEI turned $10,000 into more than $13 million since 1990 and most investors have never heard of it.
VALUATION (from @FASTGraphs):
Blended P/E: 49.61x
Normal P/E: 41.68x
Fair Value Ratio: 17.86x (P/E set equal to the 17.86% long term earnings growth rate)
EPS yield: 2.02%
Since December 2005 the price is up 6,386% and earnings are up 3,315%. Investors today are paying roughly double the multiple they paid in 2005
Over 20 years the stock compounded at 20.71% a year against 9.84% for the S&P 500.
This is a long-term winner but the question investors have to ask is what P/E multiple does the business deserve moving forward?
THE BUSINESS:
When an airline needs a replacement part for a jet engine, the original manufacturer sets the price, and most of the manufacturer's profit is in those parts, not the new engine. HEICO reverse engineers the part, gets the FAA to approve it, and sells it for 30 to 50% less. It is the world's largest independent maker of FAA-approved jet engine replacement parts, and it owns a second business making electronics for defense, space and medical customers.
In 1990 it was a struggling company with one approved part, one factory in Hollywood, Florida, $26 million in revenue and a market cap about the same size. Laurans Mendelson and his sons Eric and Victor became the largest shareholders and took control. They have made close to 100 acquisitions since, usually buying from founders and usually leaving them with a stake, and the largest was Wencor for $2 billion in 2023. Lufthansa's maintenance arm has owned 20% of the replacement parts subsidiary since 1997, which tells you what the customers think of the product. Laurans died last September at 87. Eric and Victor, who have run the company day to day since 2009, are now co-chairmen and co-CEOs. Berkshire Hathaway took a small position in 2024.
THE FUNDAMENTALS (2022 to 2025):
Revenue: $2.21B to $4.49B (26.63% CAGR)
Gross income: $939M to $1.91B (26.65% CAGR)
Net income: $352M to $690M (25.21% CAGR) Operating cash flow: $468M to $934M (25.92% CAGR) Operating margin: 22.10% to 22.44%
Return on equity: 14.43% to 17.09%
Return on invested capital: 15.02% to 12.80%
LT debt/capital: 12.23% to 34.47%
FG Score: 89/100
Revenue doubled in three years. Gross margin was 42.5% at the start and 42.5% at the end, and operating margin held above 22% while the company digested the largest deal it has ever done which increased long term debt to capital from 12.23% to 44.61% in one year. However, debt has come down every year since.
Return on invested capital fell from 15.02% to 12.80% because the capital base got much bigger, and the 53/100 Financial Strength in the FG score is the result of the deal on $HEI's balance sheet.
EPS HISTORY:
2007: $0.30
2012: $0.66
2017: $1.37
2019: $2.39
2021: $2.21
2023: $2.91
2025: $4.90
2026 estimate: $6.32
2027 estimate: $7.13
2028 estimate: $7.99
THE CATCH:
The P/E multiple is basically at an all-time-high. At 49.61x, HEICO trades 19% above its own 20 year Normal P/E of 41.68x, which is already a rich multiple for 17.86% long term growth.
On the Forecasting tab, which uses the 13.07% growth analysts expect from here instead of the 20 year record, the Fair Value Ratio is 15x. But the price has been above that orange line for more than a decade.
Here is what $7.99 of 2028 earnings is worth in October 2028 depending only on the multiple the market pays.
If today's multiple of 49.61x holds: $396, up 29%
If it trades at its 20-year normal P/E of 41.68x: $333, up 9%
If the multiple contracts down to 22.50x: $180, down 41%
If it trades down to the 15.00x Fair Value Ratio: $120, down 61%
HEICO reported a record quarter on August 25: sales up 23%, net income up 33%, cash from operations up 49%. But the stock is down about 13% since. Earnings grew and the price fell, which is an example of multiple compression.
$CASY is up 2,595% since 2006 and most investors outside the Midwest have never heard of it.
VALUATION (from @FASTGraphs):
Blended P/E: 30.72x
Normal P/E: 21.03x over 20 years, 26.01x over 5 years
Fair Value P/E: 15x
EPS yield: 3.26%
Since 2006 the price is up 2,595% and earnings are up 1,535%. Meaning investors benefitted from significant EPS growth and the P/E multiple expanding. Over 20 years the stock returned 18.42% a year against 9.79% for the S&P 500. Over the last 5 years it returned 27.31% a year while EPS grew about 18% a year.
The stock hit $927.85 on June 11, about 48x the $19.16 EPS Casey's had just reported for fiscal 2026. On September 8 it reported a quarter with EPS up 27.7%, ahead of estimates, and fell about 14% the next day. At the October 2 close of $617.76 it is 33% below the high and still above both Normal P/Es.
THE BUSINESS:
Casey's runs 2,959 convenience stores in 19 states, about half of them in Iowa, Missouri and Illinois. It is the third largest convenience store chain in the country and the fifth largest pizza chain.
Don Lamberti opened the first store in 1968 in a converted gas station in Boone, Iowa. His third went into Waukee, population 1,500, and did better than the first two, so he built the company in towns of fewer than 5,000 people that the national chains skipped. About 71% of today's stores were opened in towns of fewer than 20,000.
Pizza arrived in 1984, and it explains the economics. In fiscal 2026 fuel was 60% of revenue and 35% of gross profit. The inside of the store was 36% of revenue and 62% of gross profit, and prepared food earned a 58.6% margin. Gas brings the customer in. The store makes the money.
Casey's owns most of its real estate, runs its own distribution centers and hauls most of its own fuel. In 2010 the owner of Circle K offered $1.9 billion for the whole company and went hostile when the board said no. Shareholders kept the board. The market cap today is $22.83 billion.
THE FUNDAMENTALS (fiscal 2023 to fiscal 2026):
Revenue: $15.09B to $17.56B (5.17% CAGR)
Gross income: $2.76B to $3.87B (11.95% CAGR)
Operating income: $643M to $1.04B (17.52% CAGR)
Net income: $447M to $714M (16.95% CAGR)
Operating cash flow: $878M to $1.38B (16.20% CAGR)
Operating margin: 4.26% to 5.94%
Return on equity: 17.59% to 18.73%
Return on invested capital: 11.67% to 11.87%
LT debt/capital: 38.70% to 40.68%
Revenue is mostly gasoline, so it follows the price of fuel and says little about the business. Net income grew more than three times as fast. The $1.145 billion purchase of 198 CEFCO stores in November 2024, the largest deal in company history, took LT debt/capital to 44.05% in fiscal 2025. It was 40.68% a year later.
EPS HISTORY:
2007: $1.25
2011: $2.65
2015: $4.62
2019: $5.51
2021: $8.38
2023: $11.60
2025: $14.64
2026: $19.16
2027 estimate: $21.40
2028 estimate: $23.51
2029 estimate: $26.17
EPS grew about 13% a year from fiscal 2007 to fiscal 2019 and about 19% a year since. Darren Rebelez became CEO in June 2019 after running IHOP, and food, new stores and acquisitions have been the plan since. Fiscal 2026 grew 30.87%. Analysts model 11.69%, 9.86% and 11.31% from here. The dividend went from $0.20 to $2.21 a share over the same 19 years and has been raised 27 years in a row. The yield is 0.42%.
THE CATCH:
A 33% drop left the stock at 30.72x, still above its own historical average. The current multiple leaves very little room for error. If they hit 2029 EPS estimates of $26.17 at the 5 year Normal P/E of 26.01x the price would be $680.60, an estimated annual return of 4.27% with dividends. At the 20 year Normal P/E of 21.03x, it would trade at roughly $550, below today's price.
These are scenarios built on analyst estimates, which can be wrong in either direction. They are not predictions.
$MCD is down about 30% from its February all-time high and on track for its worst year since 2002.
This month it traded below $230 for the first time since 2022.
Here's what happened.
On September 23, management said US sales would be slightly negative in Q3 and that it would give franchisees about $8.5 billion in rent relief and capital support through 2036. The stock fell 4.8% that day.
THE FUNDAMENTALS (from @FASTGraphs):
Blended P/E: 18.63x
Normal P/E: 21.52x
EPS yield: 5.37%
Dividend yield: 3.26%
LT debt/capital: 101.08% (shareholders' equity is negative)
FG Score: 57/100
THE SELL-OFF:
US same-store sales grew 0.8% in the second quarter. Burger King's grew 8.5%.
EPS HISTORY:
2023: $11.94
2024: $11.72
2025: $12.20
2026 estimate: $12.87
Earnings are not falling. EPS grew 6% in the first half of 2026. The multiple is what fell. At the February high the stock traded at about 28 times earnings, roughly 30% above its Normal P/E of 21.52x. Today it is 18.63x.
The dividend was just raised for the 50th straight year. On this year's estimate, the 15x Fair Value Ratio is $193 and the 21.52x Normal P/E is $277. The stock closed Thursday at $236.90, between the two.
Next up: US same-store sales in the Q3 report.
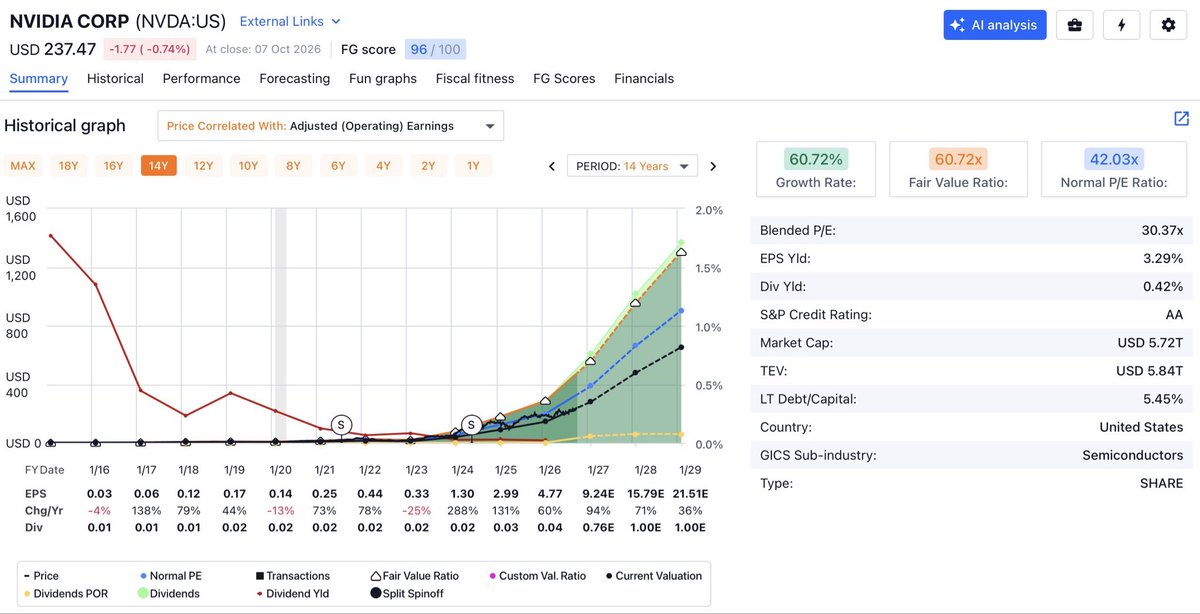
$AAPL vs $NVDA
Market cap: $4.91T vs $5.72T
TTM revenue: $467B vs $303B
Next FY revenue est: $528B vs $673B
Gross margin: 50% vs 75%
EPS growth estimates
AAPL: 19% (FY26), 12% (FY28)
NVDA: 94% (FY27), 71% (FY28), 36% (FY29)
Blended P/E vs Normal P/E (from @FASTGraphs)
AAPL: 37.98x, 63% above its 23.27x Normal P/E
NVDA: 30.37x, 28% below its 42.03x Normal P/E
Apple growing earnings at 12% trades at a 63% premium
Nvidia growing earnings 70%+ trades at a 28% discount