@Novarcharesk3@OMGTheMess So I should just forfeit my super? After paying into it for the duration of my working career, and am able to either take a lump sum or pension, because I chose to live overseas I should just forfeit my whole superannuation???
@MadsMelbourne@ksim77777 It's called 'ember attack'. The embers fall into tight spaces of a house, through vents etc.. next thing you know the house is going up in flames.
Upwards of 80% of property lost during bushfire are by ember attack.
Houses can go up miles from the fire front line.
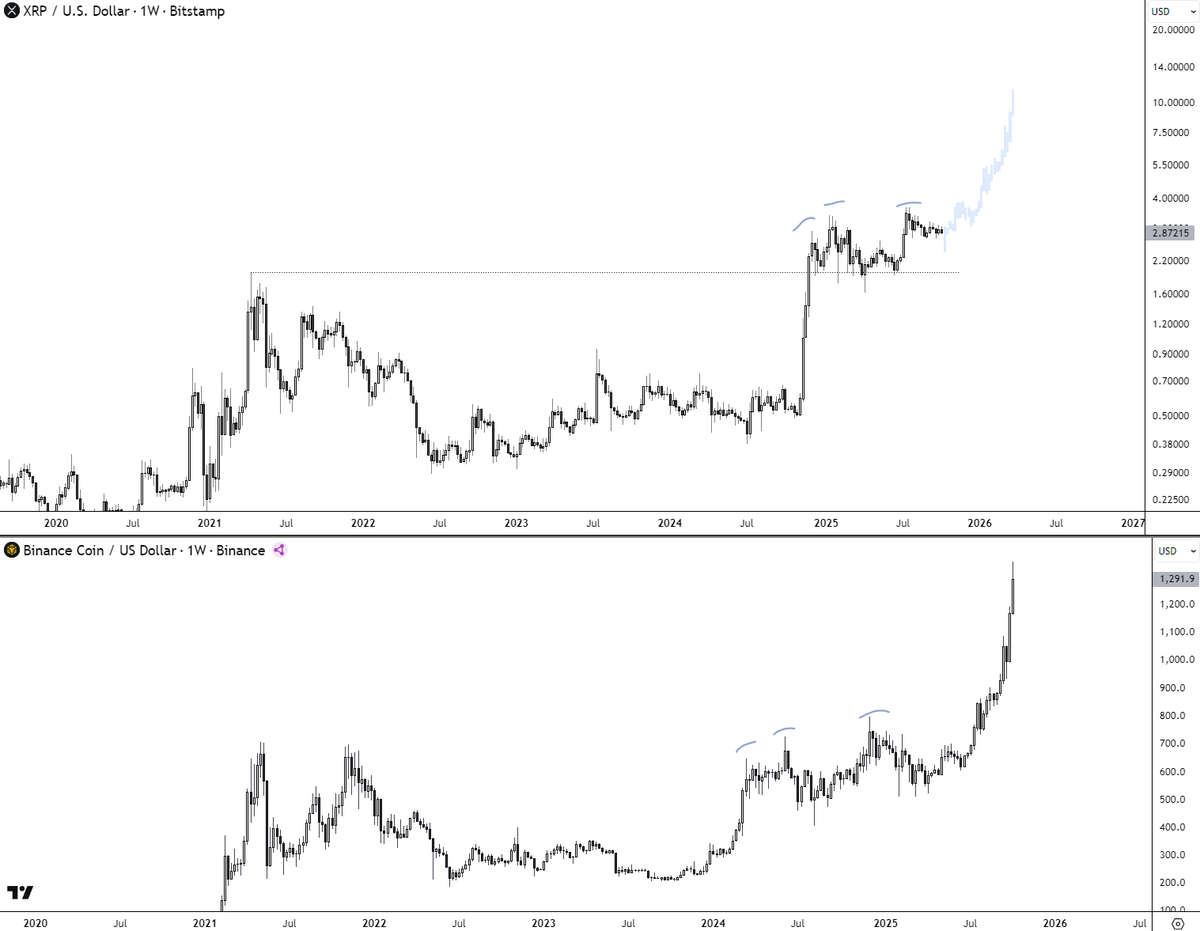
I think there is a more than decent chance we are going to see a similar type of outcome on $XRP as we saw on $BNB. The three tap into parabola breakout
So I'm asking again...
"At what point will people see #XRP not distributiong but re-accumulating? And do you think they manage to flip in time? Or cope all the way up?
In the past cycle it was the latter"
Imo #XRP > 10$ ain't out of the question. Obviously that outcome might not play straight tomorrow. Give the price room to wiggle
Bull run ends in 60 days.
Cycle Peak Countdown says BTC is 93% done (1,007 days in). Blowoff top odds are about to max out.
Now you'll retire your bloodline or get absolutely rekt.
Let me explain.
(Thread)🧵
This ATH breakout will surely take ethereum to $8,000+
Next few weeks are gonna be really wild.
I’ve put together all key lessons from this week to guide you through what's coming next & how to stop missing out.
Your alpha pack has landed.
(Thread)🧵
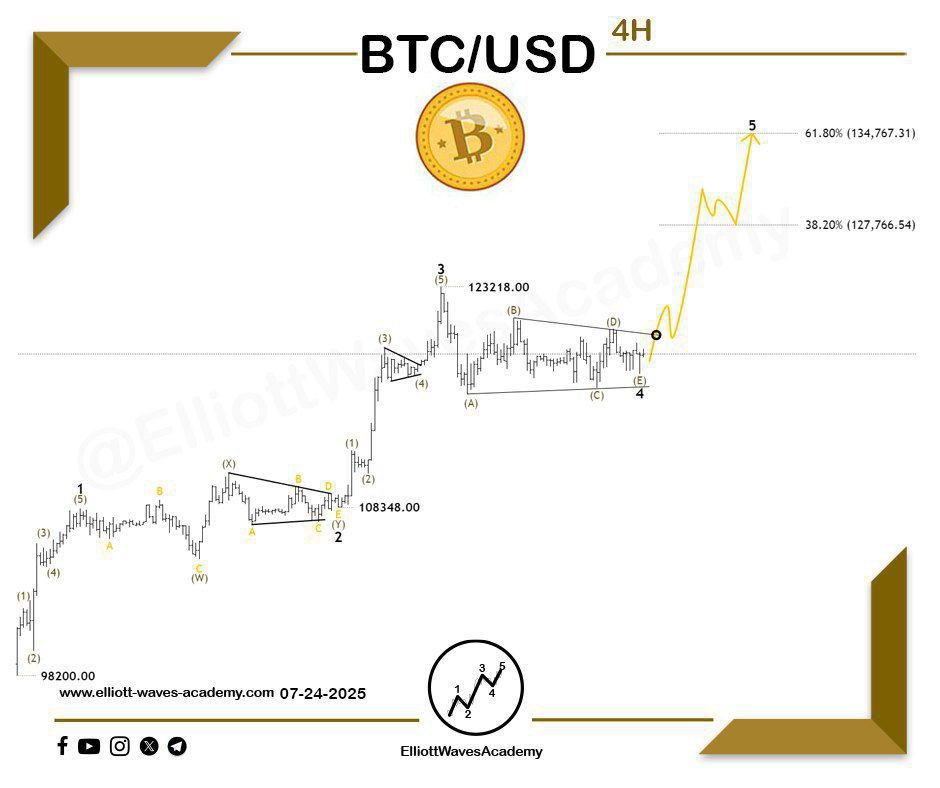
#Bitcoin vs USD 🇺🇸 – Wave Outlook on the 4-Hour Timeframe
*Bullish and Bearish Scenarios 📈*
Based on the wave movement currently forming in price action, two possible scenarios are emerging: 🧐
✨ *Scenario 1:* Suggests that the triangle pattern 🔼 is nearing completion of its sub-waves, with only a breakout of a key level remaining. This would confirm it as a fourth wave within a larger impulsive structure.
✨ *Scenario 2:* Indicates that a zigzag corrective wave in the upward direction may have already completed, and a downward move is expected — possibly in the form of a simple zigzag, double zigzag, or flat correction, as illustrated. 📈
🏹 The key level for each scenario is crucial in determining the next direction, in addition to identifying a breakout or breakdown from the pattern each model represents.
For Our Daily Premium Analysis 👉 : https://t.co/pzApvDSbYX
For Our Educational Program Analysis 👉 :
https://t.co/CRUph7e5PO
#elliottwave #tradingview #technicalanalysis #swingtrading #waveanalysis #BTCUSD #cryptocurrencies #btctrading #forexdubai #forexeurope #forexuk #ETHUSD #tradingstrategies #priceactiontrader #ethereumtrading #ethereuminvestment #ethereumprice #bitcoinsignals #priceactiontrading #forexmalaysia #forexespanol #forexfrance #tradingacademy #forexaustralia #bitcointrading #Dogecoin #BTCUSDT
Altseason Money Flow:
ETH> Major Caps > Mid and Micro Caps> Crash
This is outdated.
The money flow cycle has completely changed. Here's a Full Guide🧵:
Admittedly, there is a lot going on with this chart.
But if you look carefully at it, you'll see that #Bitcoin prints the same pattern each post-halving year.
Up in July-Aug
Down in Sep
Up into the market cycle top in Q4
Bear Market
Instead of trying to guess which news event is “cycle top” worthy, what if you just watched the cycle?
Because the one that’s always mattered is at the bottom.
$XRP detailed analysis (long post, read along)
Yesterday we saw XRP hit an ATH in USD terms, but there are a few other charts we have been tracking over the last year that haven't really signaled full bull just yet
I think of all these pairings as launch checklists, the more that check the box, the stronger the trend can be
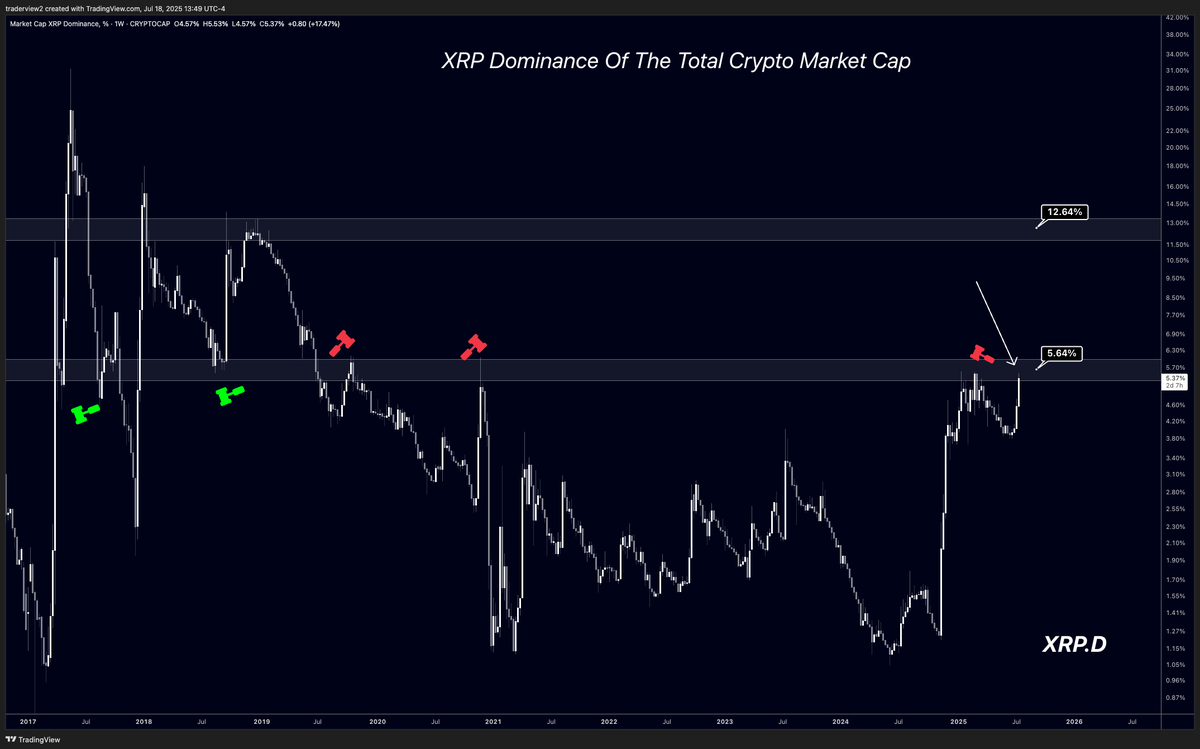
First one - $XRP.D:
I tracked this chart a lot earlier this year when XRP first hit $3 and here we are back to the resistance level that has held it down for over 2200 days.
Despite $XRP/USD signaling a full break of structure, the dominance chart has yet to do so.
Anytime $XRP.D broke the current resistance in the past, we saw a 2x shortly after. If history repeated after a successful break, this would land us near a target of $7-$10 depending on how much the rest of the market moves
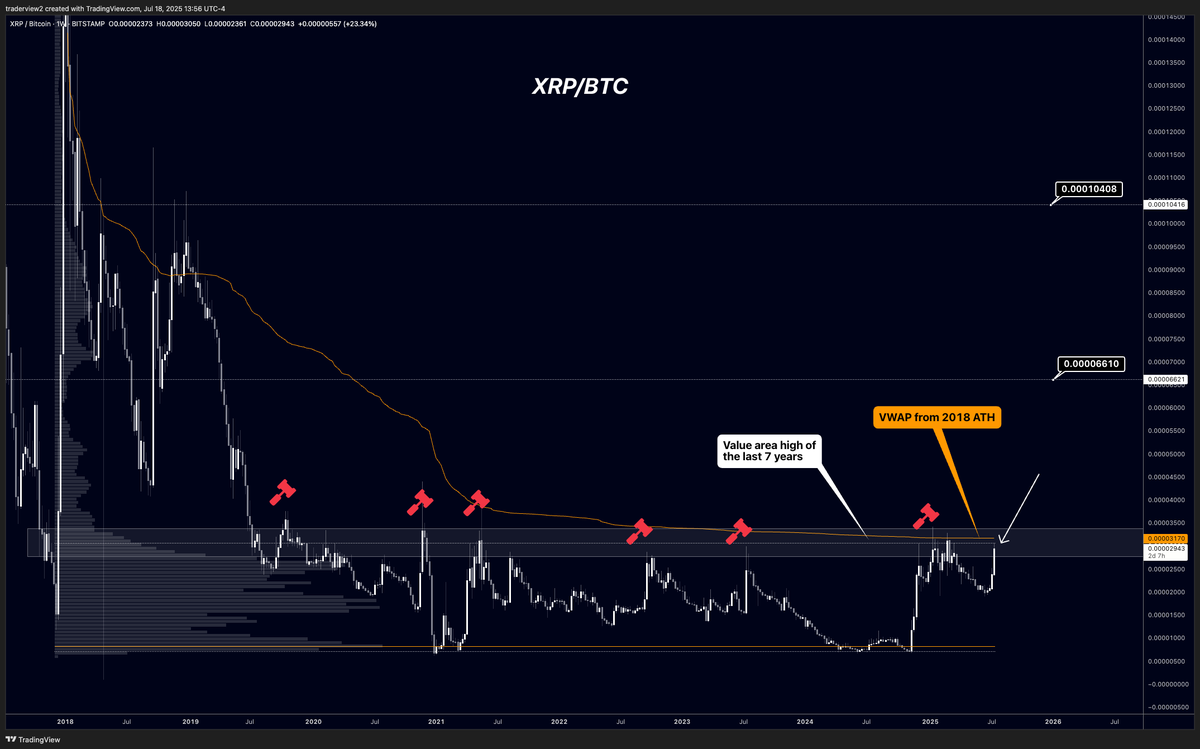
2nd chart - $XRPBTC:
This is another one we heavily tracked ~8 months ago when $XRP first was attempting to break it
Now here we are again, attempting to break the 2200+ day resistance that has rejected XRP over 8 times
Similar to the $XRP.D chart, anytime this has been reclaimed in the past, an explosive move occurred shortly after
I think that is implied, considering there have been 8+ rejections over the last 7 years...
Targets are shown once the level is cleared. I think this one is very important, so alerts are set on my end and will continue to update any advancements
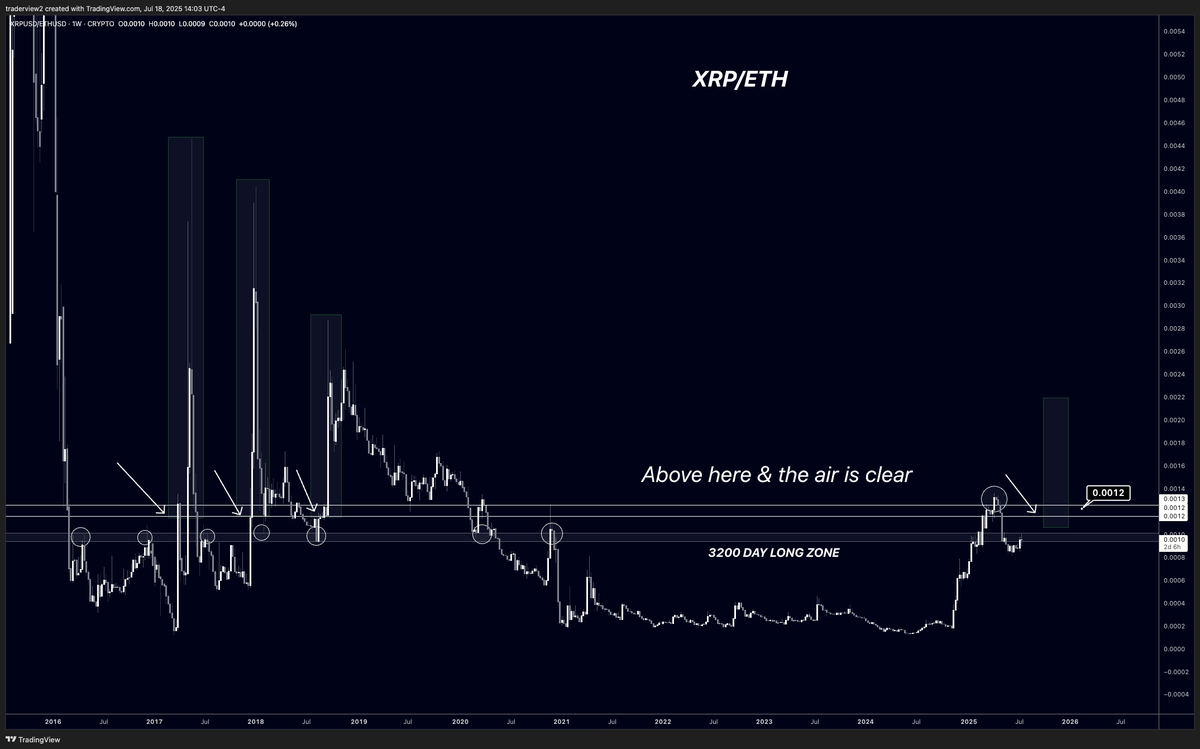
3rd chart - $XRPETH:
I was heavily updating this chart a few months ago right when we were attempting to break this 3200 day long zone, but XRP fell short and didn't see any follow through
Based on how $ETH has been performing, there is a chance this one is even more delayed than the previous two, but the idea stays firm
Anytime price has fully flipped the zone shown, we've only ever seen an explosive move
This is one I continue to watch, but lighter than the previous two
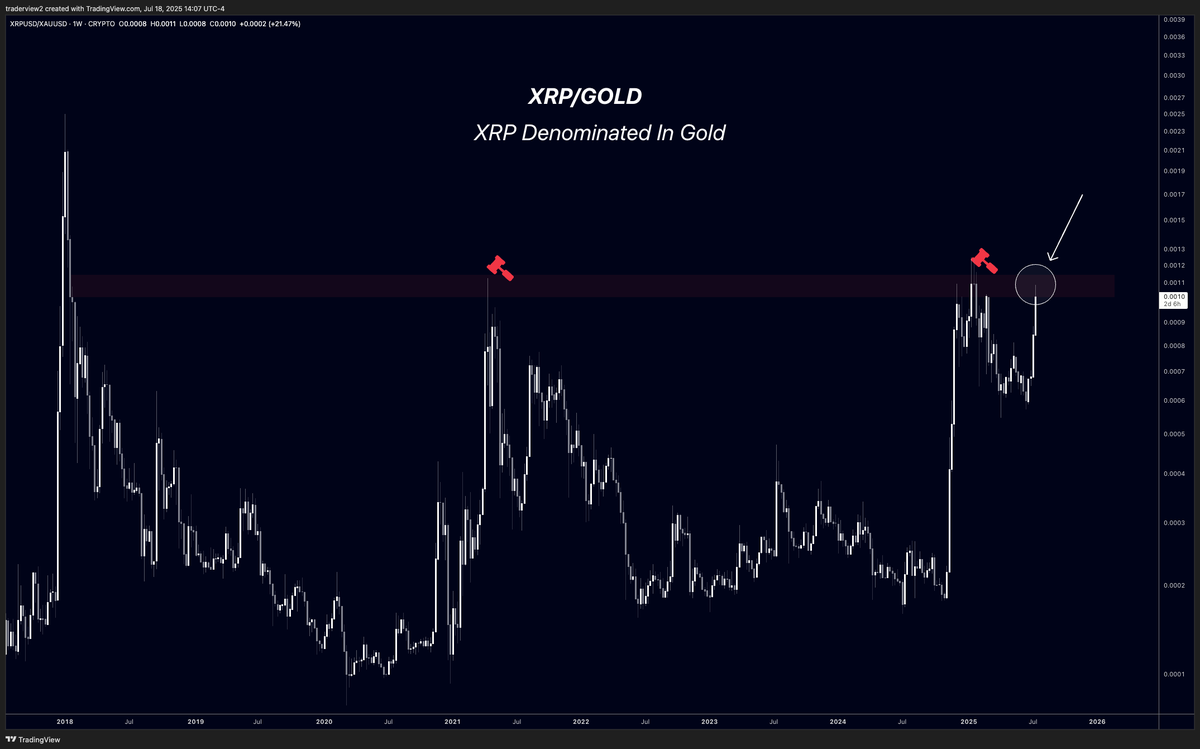
Last chart - $XRP / $XAU (Gold)
I really like this one, considering gold is a much harder asset to price anything against, compared to USD. It gives a truer value representation, effectively eliminating some of the inflation effect of USD pairs
As we can see, XRP is still under the zone that rejected it back in 2021
Removing inflation, $XRP technically has not yet hit an ATH in "value" terms. Think of all the money printing we have seen since 2018
So this chart will be on the top of my radar. Once we clear the current zone, I think it'll be aligned with the chance of a true price discovery pump, above $5.
Thanks for reading. I hope this paints an interesting picture of the checks needed IMO for a true bull trend into the high single digits.
I'll be watching and updating these in the weeks to come.