One of the cooler things I've seen built with Lovable recently is a tool that translates complex energy market data into plain English.
It shows electricity prices, volatility, forecasts across Europe, through simple visual dashboards.
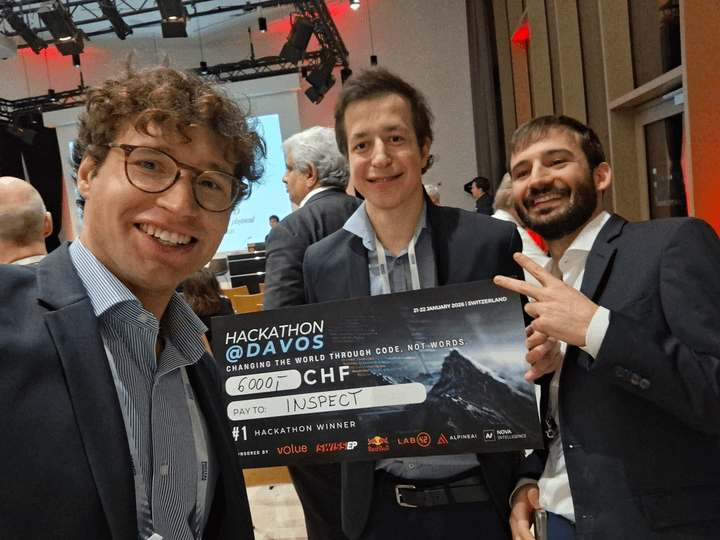
A student built it and won the official hackathon at the World Economic Forum in Davos!