New chapter for this account: crypto through data, not hype.
📊 Weekly market recaps
🔄 Where we are in the cycle
🔓 Unlocks & macro calendar
🧪 Public experiments: bots & token deep dives, wins AND losses
Always disclosed. Never financial advice.
Cycle thread drops Tuesday.
30-day performance (as of Sep 29):
$SOL +19.2%
$ETH +13.4%
$BTC +8.7%
Alts have outperformed BTC for a month, yet BTC dominance only slipped from 59.5% to 58.6%.
Alts are moving, but dominance hasn't cracked. That's the number to watch.
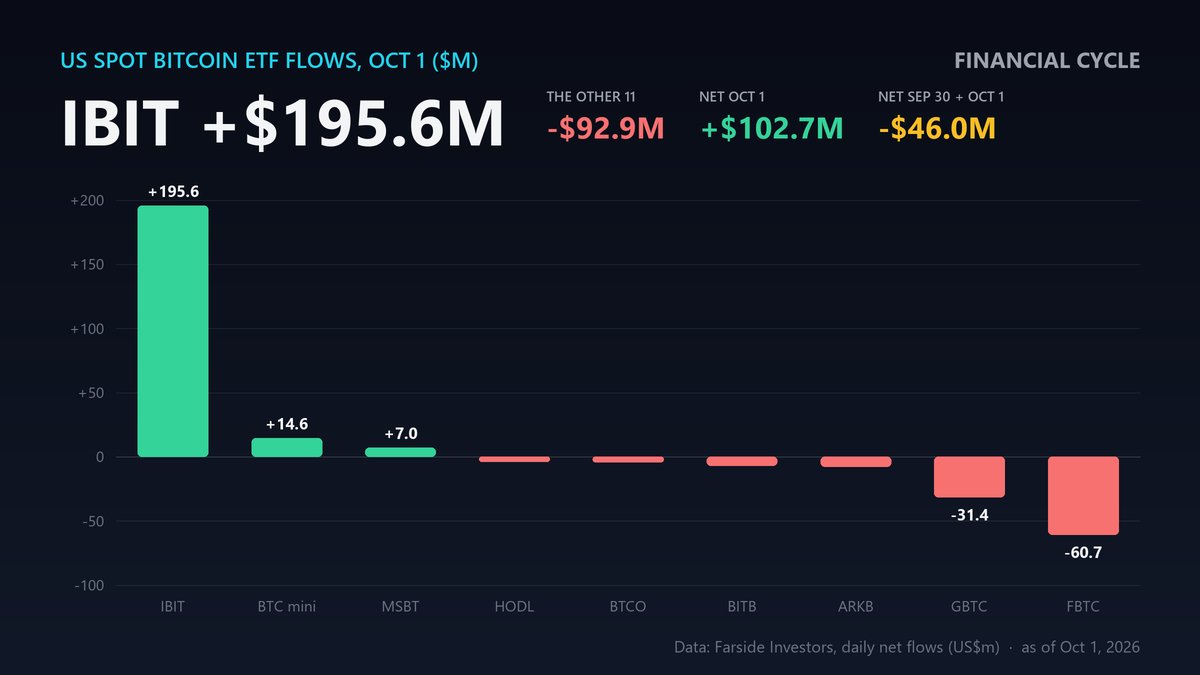
IBIT took in $195.6M on Oct 1.
The other 11 spot $BTC ETFs: -$92.9M (FBTC -$60.7M, GBTC -$31.4M).
Net: +$102.7M. Add Sep 30 (-$148.7M) and the two-day total is -$46.0M.
Less "institutions are back", more money switching tickers.
Is IBIT just eating everyone else's share?
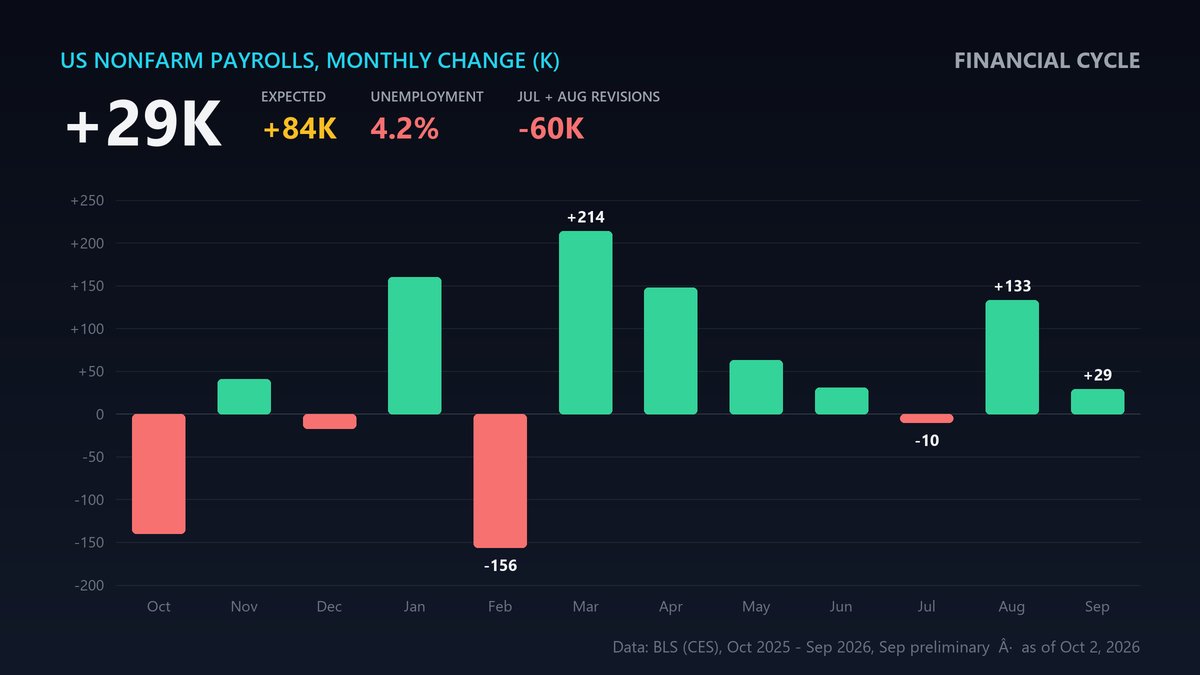
The US added just 29K jobs in September (vs 84K expected). Unemployment rose to 4.2% and July + August were revised down by 60K.
Odds of an October Fed hike: 17%, down from ~36% a week ago.
$BTC spiked to $87.2K on the print, then faded to $85.2K.
Why the fade? December is still priced as a hike. A weak report buys the Fed time, it doesn't end the hiking cycle.
Two details worth watching:
Wage growth slowed to 3.0% y/y, the lowest since May 2021.
Unemployment rose mostly because 485K people joined the labor force (participation 61.8%, highest since May), not because of a layoff wave.
Softer jobs, softer inflation, but still well above 2%. Does the Fed still hike in December?
"Uptober" by the numbers 📊
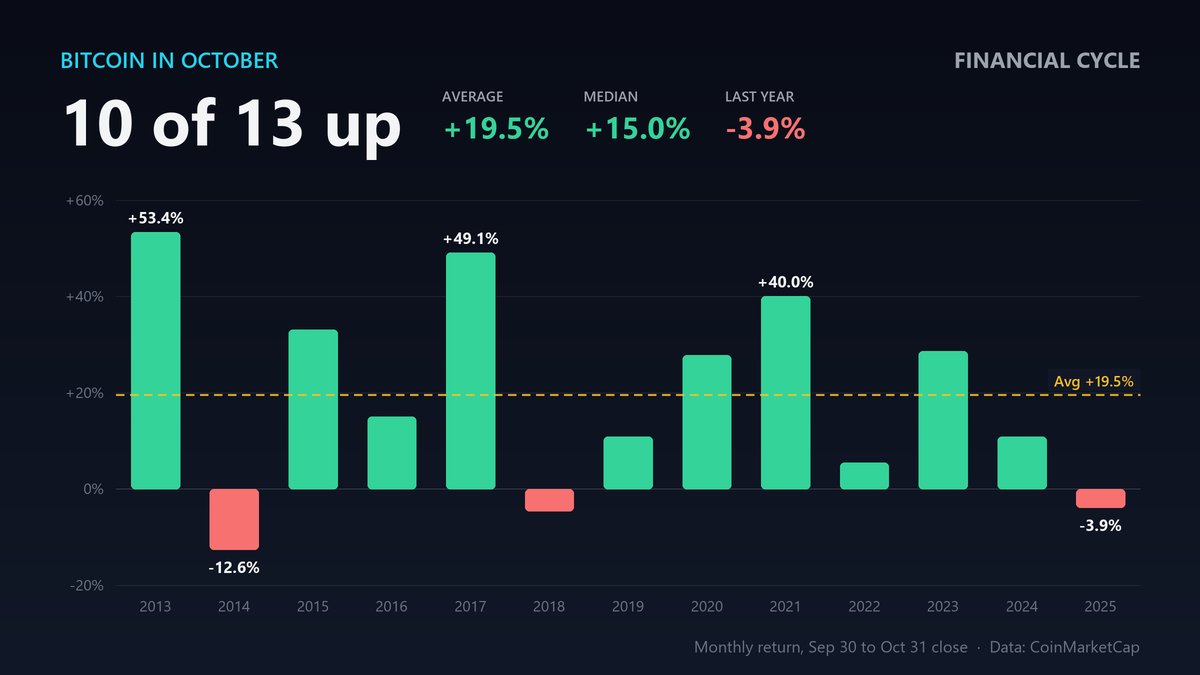
$BTC October returns, 2013-2025:
Positive in 10 of 13 years
Average: +19.5%
Median: +15.0%
Best: +53.4% (2013)
Worst: -12.6% (2014)
Last year: -3.9%.
Seasonality is a tendency, not a promise. Will this October follow the pattern?
🚨 US ECONOMY IS STILL STRONG, AND THIS'LL CONFUSE THE FED.
Just now, US ISM PMI data was released, and it came in at 54.5.
This is the 9th consecutive print above 52 and shows that the US economy is in the expansion phase.
Strong ISM data also means higher inflation expectations, and that's not what the Fed wants.
So, this leaves them with two choices.
Hold the rates and just wait.
But doing that will push yields higher as the market knows inflation isn't going away soon.
Hike the rates to push down inflation.
But doing so will cripple the economic growth and bring even bigger challenges.
This means one thing is clear: the Fed has no easy path left now.
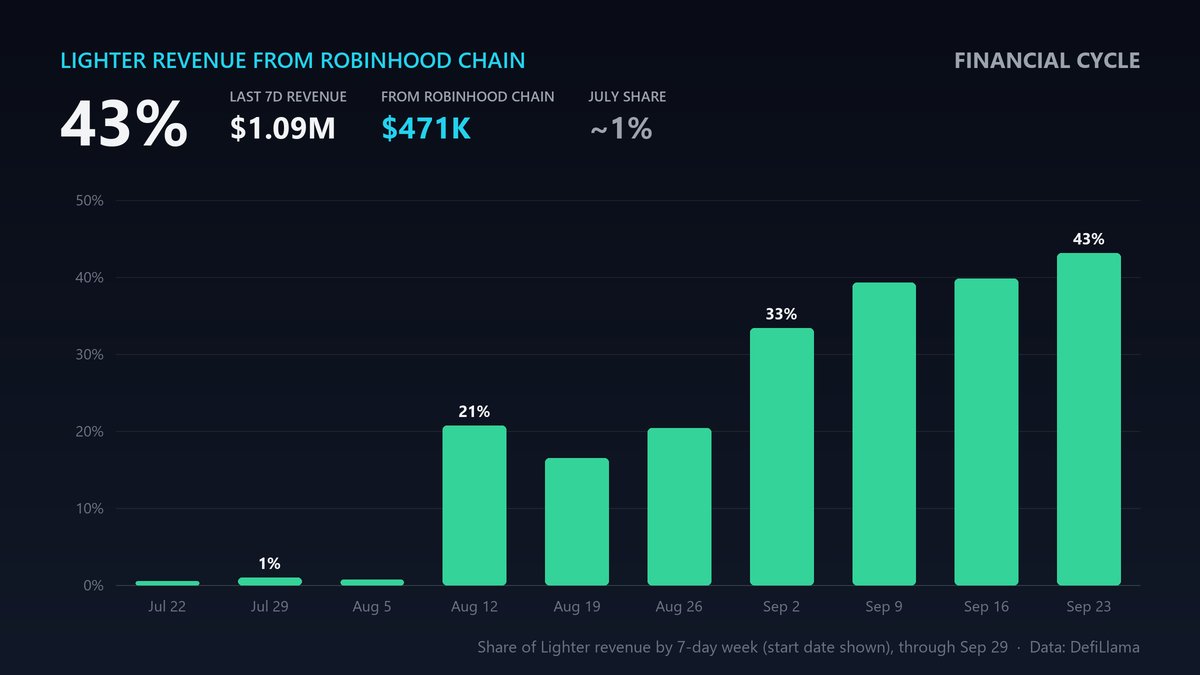
$LIT (Lighter) hit -18.6% within an hour of Robinhood announcing its own perps.
The fear: Robinhood Chain went from ~1% of Lighter's revenue in July to 43% last week.
But those perps are US-only, "coming months". Lighter can't serve the US.
Will non-US flow follow?
NFA/DYOR
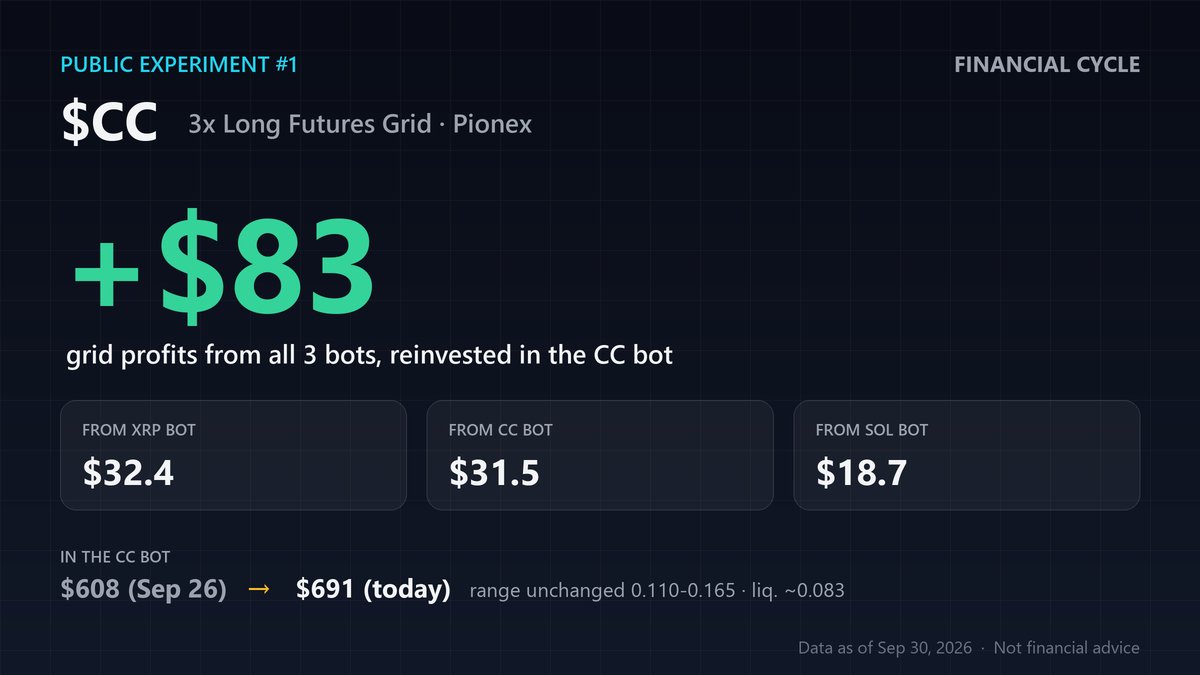
🧪 Moved the grid profits of my 3 bots into the $CC bot.
+$83: $32 from $XRP, $32 from CC, $19 from $SOL.
Why CC? Its grid made $50 in the last 5 days, almost as much as in its first 18.
Liquidation now ~0.083 (-33%).
Compound the winner or spread it?
Not financial advice.
canton-network:native volatility has been insane over the last couple of days, making very interesting grid returns!
I’ll update you on the bot soon—stay tuned!
If you don’t know about the bot experiment yet, check the post below!
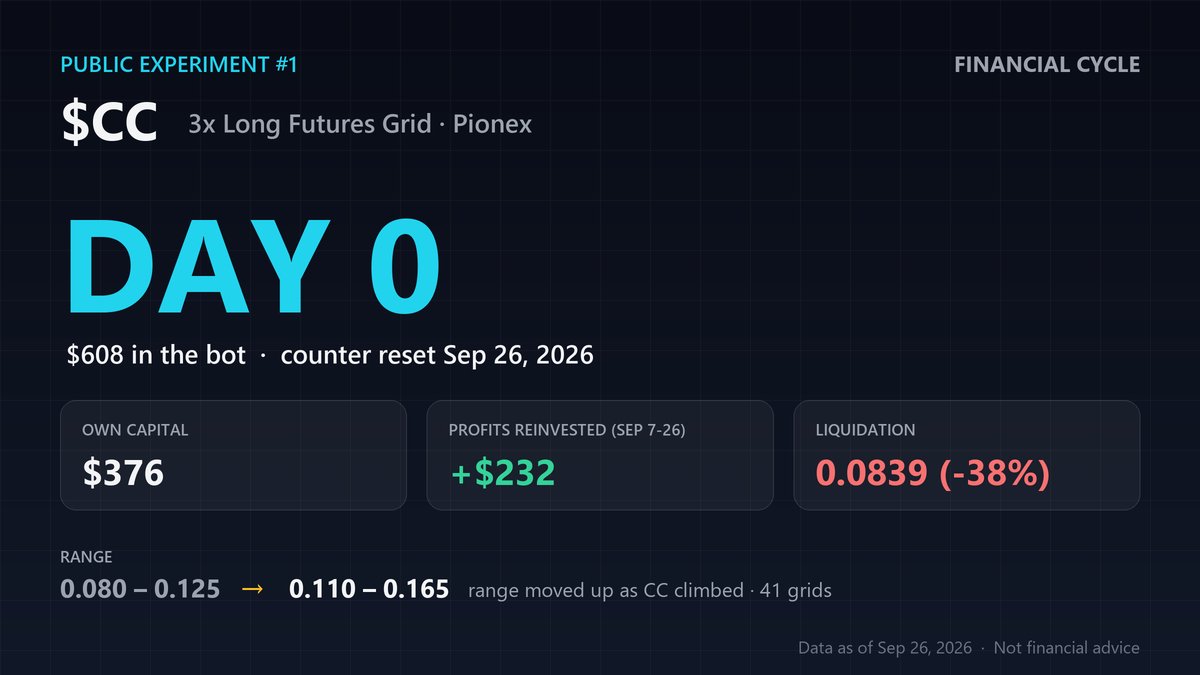
🧪 Public experiment #1: a 3x long futures grid bot on $CC (Pionex).
Day 0 is today: $608 in the bot.
That's $376 of my own + $232 of profits made since Sep 7, all reinvested.
Just moved the range up to 0.110-0.165.
Weekly updates from here. Wins AND losses.
@qrexwin I don’t believe is possible to know exactly when bottom and top is, but you can use fundamentals to make medium-long term investments decisions.
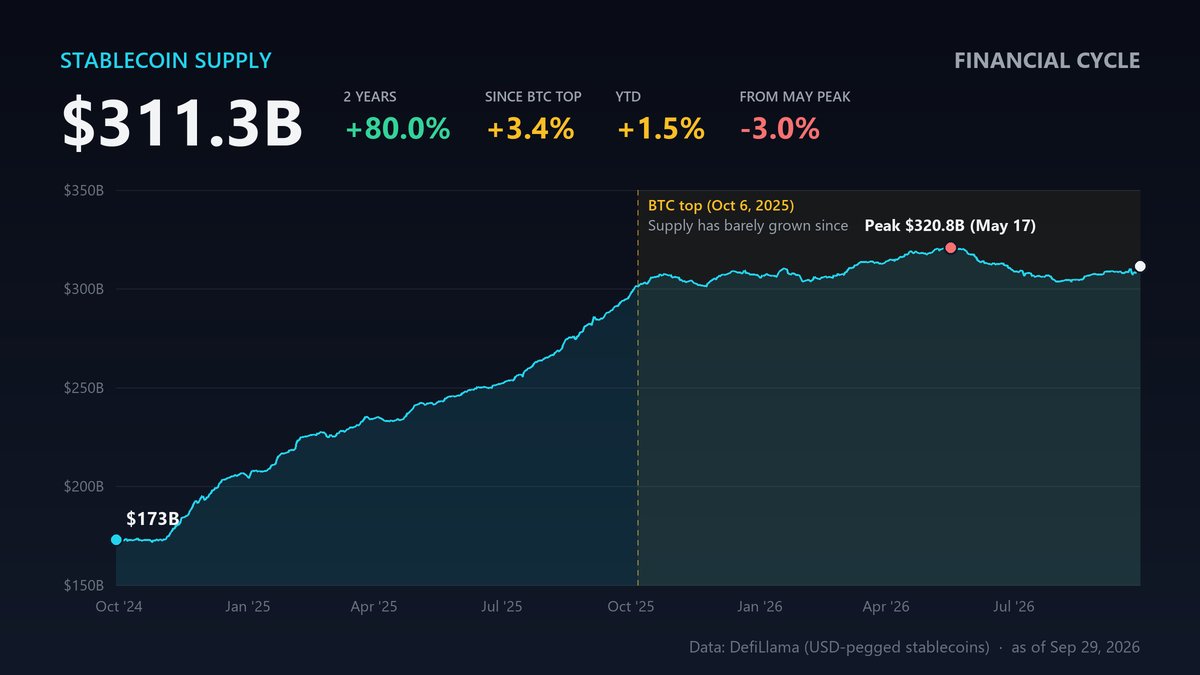
Stablecoin supply: $311.3B.
+80% in 2 years. But since the Oct 2025 BTC top: just +3.4%, and still 3% below the May peak.
Stablecoins are crypto's dry powder. The pile stopped growing when the cycle topped.
When it starts growing again, pay attention.
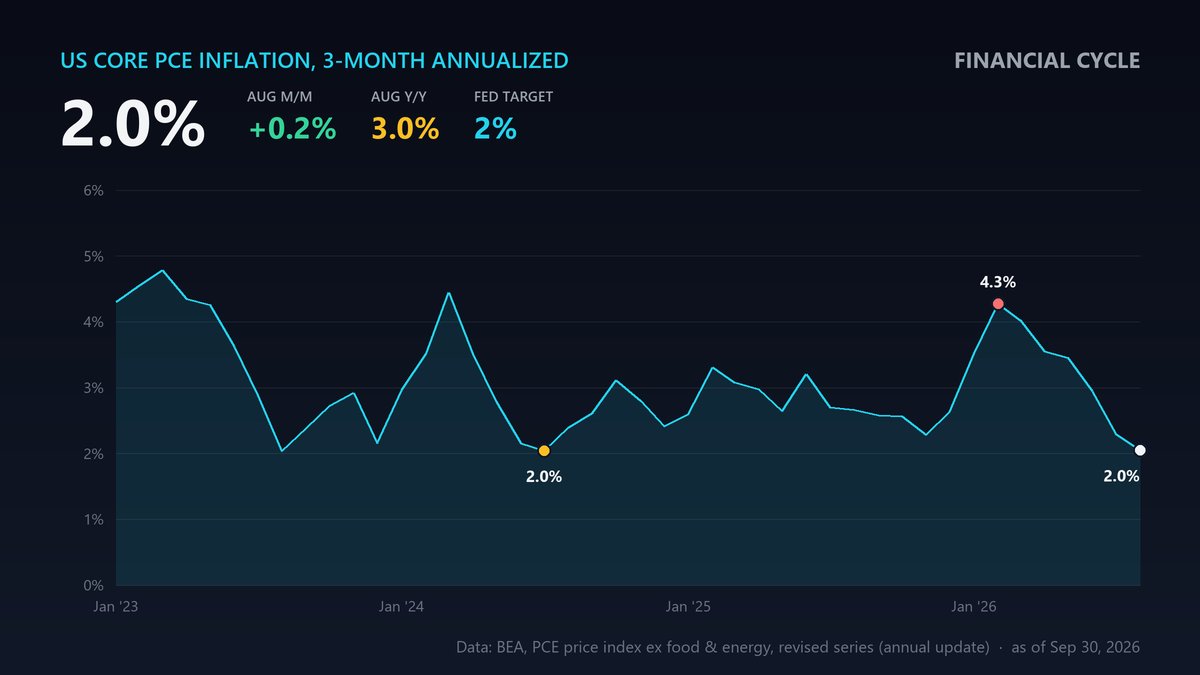
@milkroaddaily You can see it in July: core PCE y/y was 3.3% before BEA's update and 3.0% after. Part of the "beat" is rewritten history.
But the monthly pace is soft even on the new basis: 3-month annualized core is 2.0%, the lowest since Jul 2024.
Interesting divergence:
Fear & Greed: 73 (Greed)
$BTC funding: ~0.006%/8h on Binance (neutral is 0.01%)
Binance BTC futures OI: -14% since Sep 20, while price is +4%
Sentiment says greed. Leverage says... not really.
Is this rally spot-driven, or just shorts closing?
Core PCE, August:
+0.2% m/m (0.3% expected)
3.0% y/y
Careful with the y/y: BEA's annual revision cut July from 3.3% to 3.0%. That's revisions, not disinflation.
The real good news: 3-month annualized core is 2.0%, lowest since Jul 2024.
Does this change the Fed's October math?
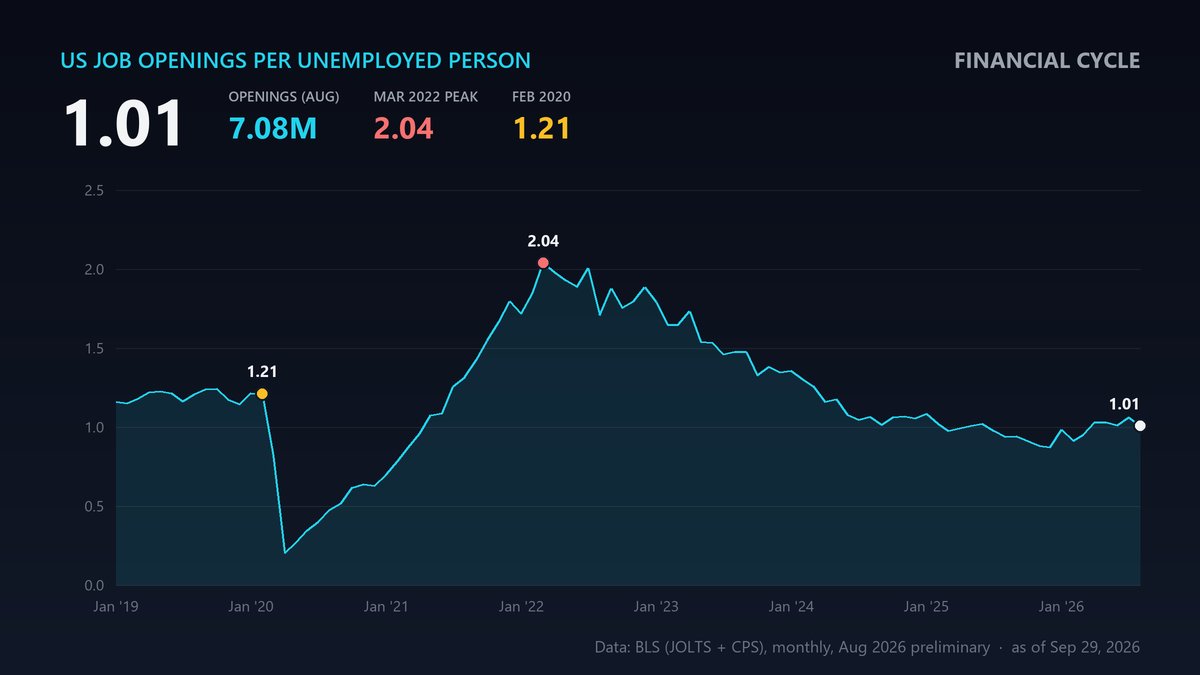
@cryptogoos The ratio says more than the miss: 7.08M openings for roughly as many unemployed = 1.01 openings per jobless worker.
It peaked at 2.04 in Mar 2022 and was 1.21 in Feb 2020.
Labor is cooler than pre-Covid, yet the 10Y sits above 5%. Which one gives first?
@cryptoquant_com@IT_Tech_PL For scale: $276M left Bitget in that first hour.
US spot $BTC ETFs took in +$31M net on all of Monday. That's ~9x.
Withdrawals aren't sales. After a ~$388M hack, moving coins to self-custody is the rational response, and price barely reacted.
@cryptoquant_com The ETF side shows the same fade.
Last week spot $BTC ETFs took in +$2.39B, the best week of 2026, but inflows shrank every day: +$999M Monday -> +$135M Friday.
This Monday: just +$31M.
If $80K gets tested, does the ETF bid come back there?
New US JOLTS (Aug): job openings fell to 7.08M, -256K vs July.
That's 1.0 opening per unemployed person. It was 2.0 at the Mar 2022 peak, 1.2 pre-Covid.
The job market isn't tight anymore. Yet the 10Y yield is still above 5%.
What drives $BTC from here: jobs or yields?