Entrusted advisor for implementing regulatory solutions via data driven approach. Skilled in IT, Data and Risk advisory and successful IT-project delivery.
Ik deel altijd -in alle eerlijkheid- de grote moves die ik doe binnen mijn portefeuille.
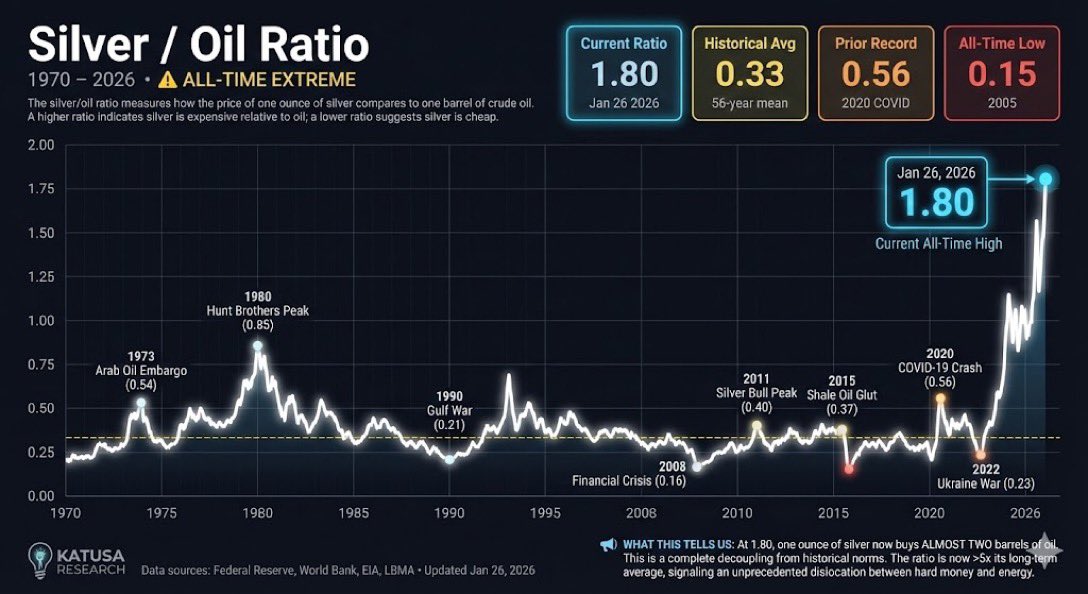
Ik heb inmiddels de helft van mijn zilver verkocht en de opbrengst grotendeels geherinvesteerd in olieaandelen. ($oxy, $pbr, …)
Je krijgt voor een ounce zilver nu bijna twee vaten olie!
The end of the yen carry trade?
A growing number of market commentators are trying to grab attention by calling the end of the yen carry trade and an imminent collapse of financial markets. While fear can undoubtedly become a self-fulfilling prophecy, many of these posts rely heavily on clickbait rather than fundamentals.
Put simply, the yen carry trade exists because interest rates in Japan are structurally low. That creates a persistent incentive to sell the low-yielding yen and invest in higher-yielding assets, most notably U.S. Treasuries.
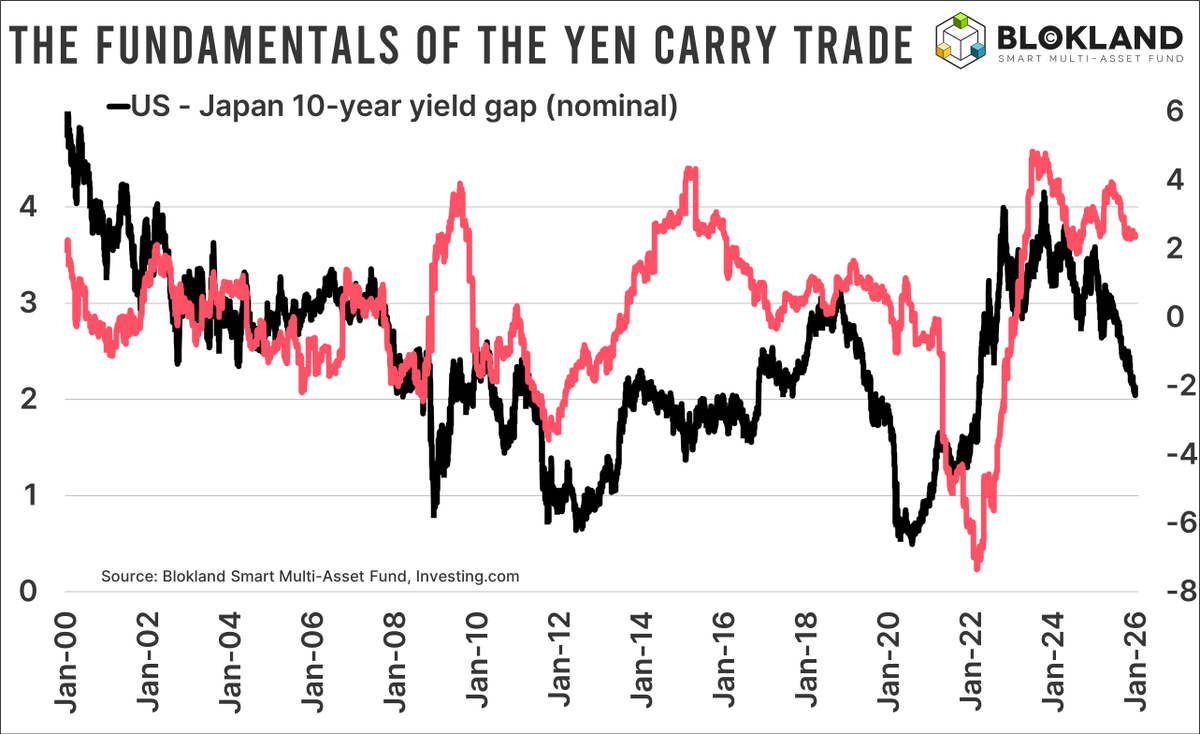
The key condition for the yen carry trade is therefore a predictable and sustained interest rate gap between Japan and, in this example, the United States. As the chart shows, even though Japan’s 10-year yield has risen above 2 percent (still remarkably low for a country with such an extreme debt burden), the gap with the U.S. 10-year yield, which also remains above 2 percent, is not far from historical norms.
To attract attention, apocalyptic narratives focus almost exclusively on the fact that Japanese bond yields are the highest they have been in decades. What they tend to ignore is that inflation and inflation expectations are also (near) the highest in decades. In fact, in real terms, the gap between U.S. and Japanese 10-year yields remains large by historical standards.
If high inflation erodes purchasing power, it logically strengthens the incentive for (Japanese) investors to seek positive real yields by selling yen and allocating capital elsewhere. By that logic, current conditions should support, not undermine, the yen carry trade.
Again, as we saw in 2024, fear can do a lot to investors and markets. But unless the Bank of Japan hikes aggressively or loses control of the yield curve, in which case yield curve control would almost certainly be reintroduced immediately, the fundamental drivers of the yen carry trade remain intact.
A student just brought me one of the cleanest ���bear to bull” shifts I’ve seen in a while on $PLUG.
Monthly BX is green, weekly structure just flipped bullish, and price is sitting on an 8B share volume shelf + buy zone.
I see 80–100% upside if this holds.
New video breaks it down.
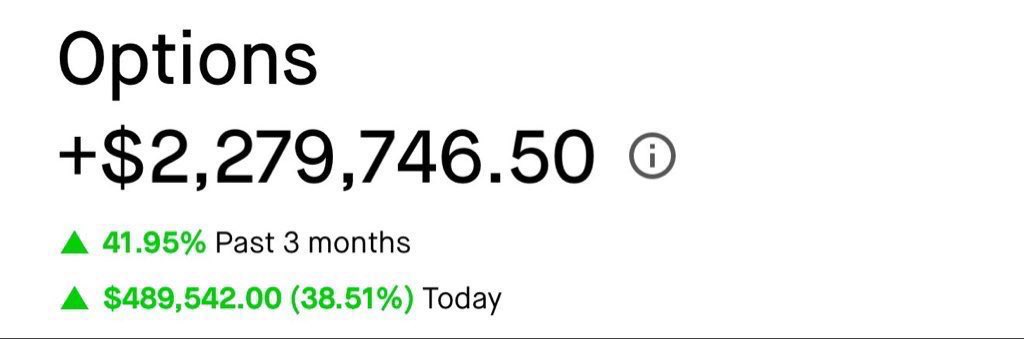
I AM OFFICIALLY RESTARTING THE $1,000 TO $1,000,000 $SPX 2026 CHALLENGE NEXT MONDAY! 💸
I’M GOING TO RESTART AND LET EVERYONE FOLLOW MY EXACT TRADES FOR COMPLETELY FREE IN A PRIVATE X GROUP CHAT! 🦅
LIKE, REPOST, & COMMENT “$SPX” TO BE ADDED! ❤️🔥
YOU MUST BE FOLLOWING ME TO JOIN! ☢️
Saks Global just missed a $100M+ interest payment on $5B in debt.
Filing expected within days.
But here’s what nobody’s connecting:
This isn’t a merger gone wrong.
It’s the first crack in a $400B luxury retail sector that gorged on cheap debt for a decade.
The numbers:
→ 717 large US bankruptcies in 2025 (highest since 2010)
→ Consumer confidence: 89.1 (recession territory)
→ US luxury sales: -2% and falling
→ Saks debt-to-EBITDA: approaching 8x
Neiman Marcus filed in 2020 with identical leverage.
The difference?
Neiman had COVID as a one-time shock.
Saks has structural erosion with no recovery catalyst in sight.
The August $600M “rescue” bought 4 months.
Now bondholders are staring at 6 cents on the dollar.
Watch what happens next:
When Saks files, every overleveraged luxury retailer’s credit facility gets repriced overnight. Vendors tighten terms. Insurance costs spike. The contagion math isn’t linear—it’s reflexive.
My thesis (falsifiable):
Saks files by March 31, 2026. This triggers at least 3 more luxury retail distress events by Q2.
If I’m wrong, I’ll say so publicly.
If I’m right, this tweet ages very well.
The smart money isn’t asking “will Saks survive?”
They’re asking: “Who’s next?”
Position accordingly.
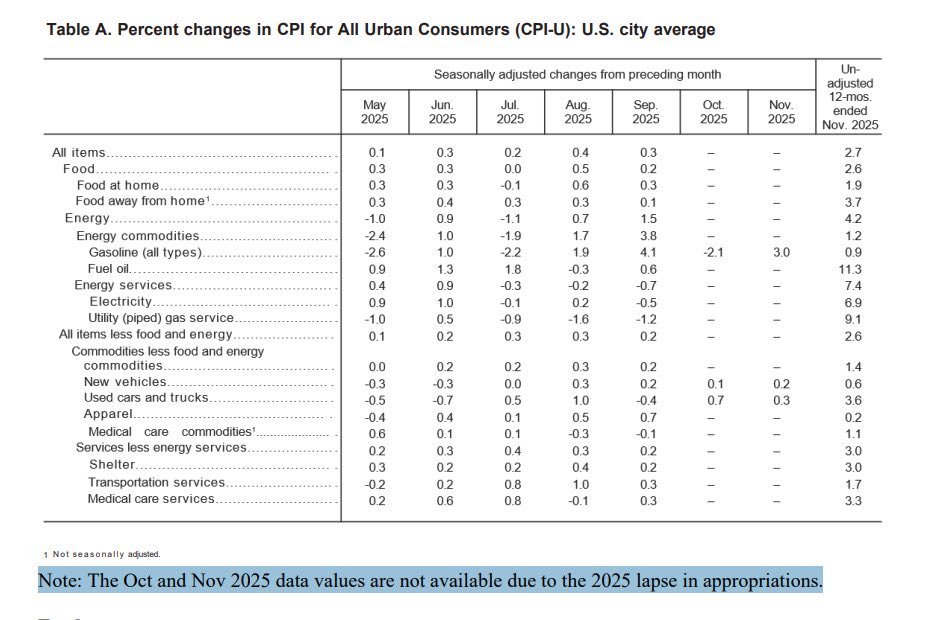
Want to know why the inflation rate went “down”?
Because the government is just outright not reporting any numbers anymore.
Look at October and November.
THE GREAT DIVERGENCE
Michael Burry just shared the most important chart of the decade.
For only the third time since World War II, American households hold more wealth in stocks than in the roofs over their heads.
The Federal Reserve confirms: $61.1 trillion in equities. $49.3 trillion in real estate. A gap of 670 basis points.
The last two times this happened?
The market fell 48%.
The market fell 49%.
Both preceded multi-year bear markets that destroyed a generation of wealth.
The numbers today are worse than both.
The Shiller CAPE ratio: 40. Second highest in 150 years.
Top 10 stocks: 39.1% of the S&P 500. The highest concentration ever recorded. Higher than 1929. Higher than the dot-com peak.
Passive funds: 52% of all equity assets. A market that no longer knows how to price risk.
Commercial real estate delinquencies: 7.26%. Office sector: 11.68%. Over $1 trillion in loans maturing in 2026 that cannot refinance at current rates.
The man who shorted the 2008 housing market and returned 489% while Wall Street collapsed now holds $912 million in puts against Palantir and $186 million against Nvidia.
He named his newsletter "Cassandra Unchained" after the prophetess cursed to speak truth no one believes.
The crossover signal has fired.
The question is not whether reversion occurs.
The question is whether you will be positioned when it does.
History does not repeat. But it rhymes.
And this verse sounds disturbingly familiar.
Read the full article - https://t.co/JkUIXS05sL
It’s hard to call this coincidence anymore
For the past month, every time silver pulled back, SOFR repo volume dropped at the exact same moment.
If these markets were unrelated, they would not move in synchronized cycles over multiple repetitions.
This repeating pattern strongly suggests that SOFR liquidity demand is reacting to stress in silver, consistent with collateral being used to defend leveraged short exposure.
When silver dips → margin pressure eases → repo demand falls.
When silver rises → margin pressure returns → repo demand spikes.
That’s not random trading flow.
That’s funding behavior responding to price pressure.
The plumbing is talking long before the headlines do.
SOFR volume shows how much collateral-backed liquidity the financial system is demanding overnight.
#Silver
BREAKING: The End of Apple As We Knew It
In 72 hours, Apple lost four senior executives.
But that is not the story.
The story is this: Nearly every designer who worked under Jony Ive has now left the company. The team that built the iPhone, the Apple Watch, the iPad, the AirPods. Gone.
Where they went changes everything.
OpenAI paid $6.5 billion for Jony Ive’s startup. His team is now building what Sam Altman calls “the coolest piece of technology the world will have ever seen.” A screenless AI device. The anti-iPhone. Designed by the people who designed the iPhone.
Meta paid over $200 million to poach Apple’s head of AI foundation models. This week they took Apple’s UI design chief and his deputy. In one month alone, 25 former Apple employees joined OpenAI’s hardware division.
The numbers tell the rest.
Vision Pro sales collapsed 75 percent in a single quarter. Apple has paused its next headset to chase smart glasses. Meta already owns 73 percent of that market with 2 million Ray-Ban units sold.
For the first time since Steve Jobs returned in 1997, Apple has no design chief. The position was eliminated. Design now reports to operations.
Apple’s median employee tenure: 1.7 years. The lowest of any top 20 U.S. tech company.
The architects of the most valuable company on Earth are now building its replacements.
This is not executive turnover. This is the largest redistribution of creative capital in technology history.
The smartphone era was designed in Cupertino.
The next era will be designed by the people who left.
What comes after the iPhone will be built by its creators.
Just not at Apple.
Read the full story here 👇
https://t.co/6hp5wfihw0
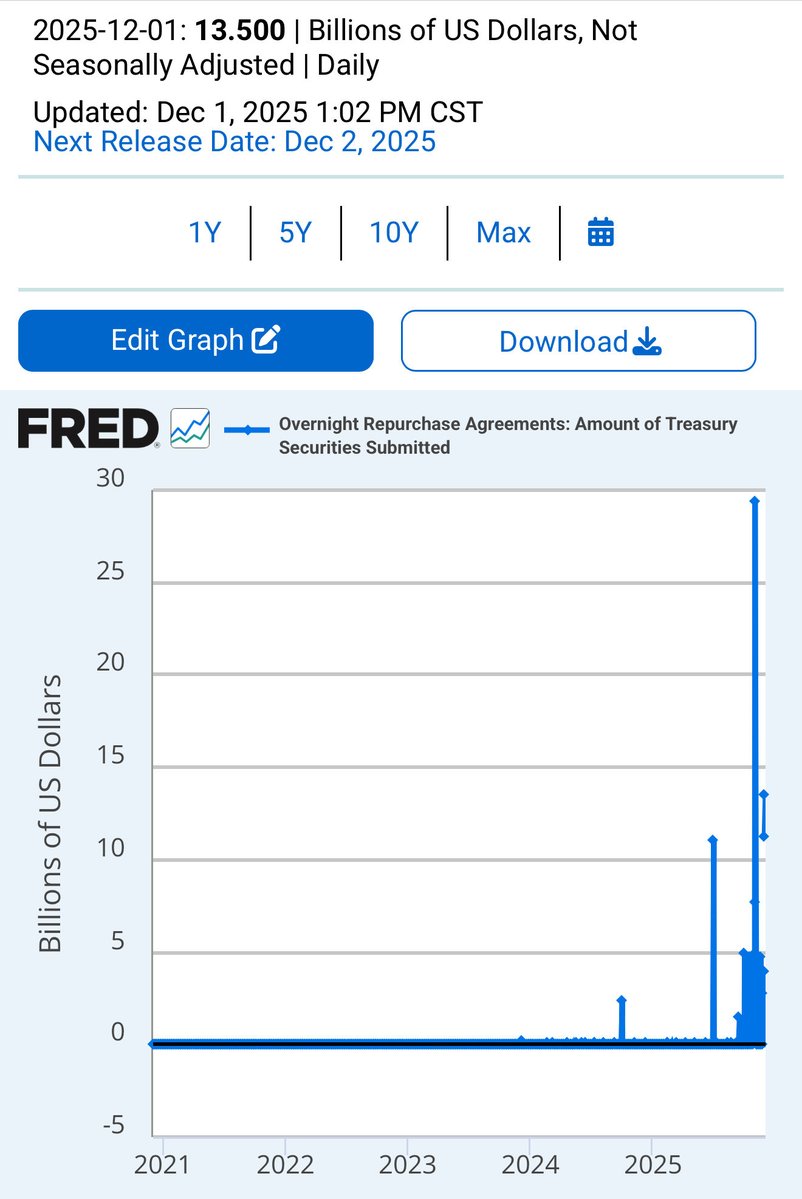
🚨 BREAKING: Massive Fed Liquidity Injection
The Fed pumped $13.5B into U.S. banks last night through overnight repos.
Why this matters:
This is one of the largest emergency liquidity injections since 2020
Repo demand this high usually means funding stress behind the scenes
Levels are now above Dot-Com Bubble peaks
Big liquidity = someone needed cash fast
Yet markets acting like nothing happened 👀
Stay alert.
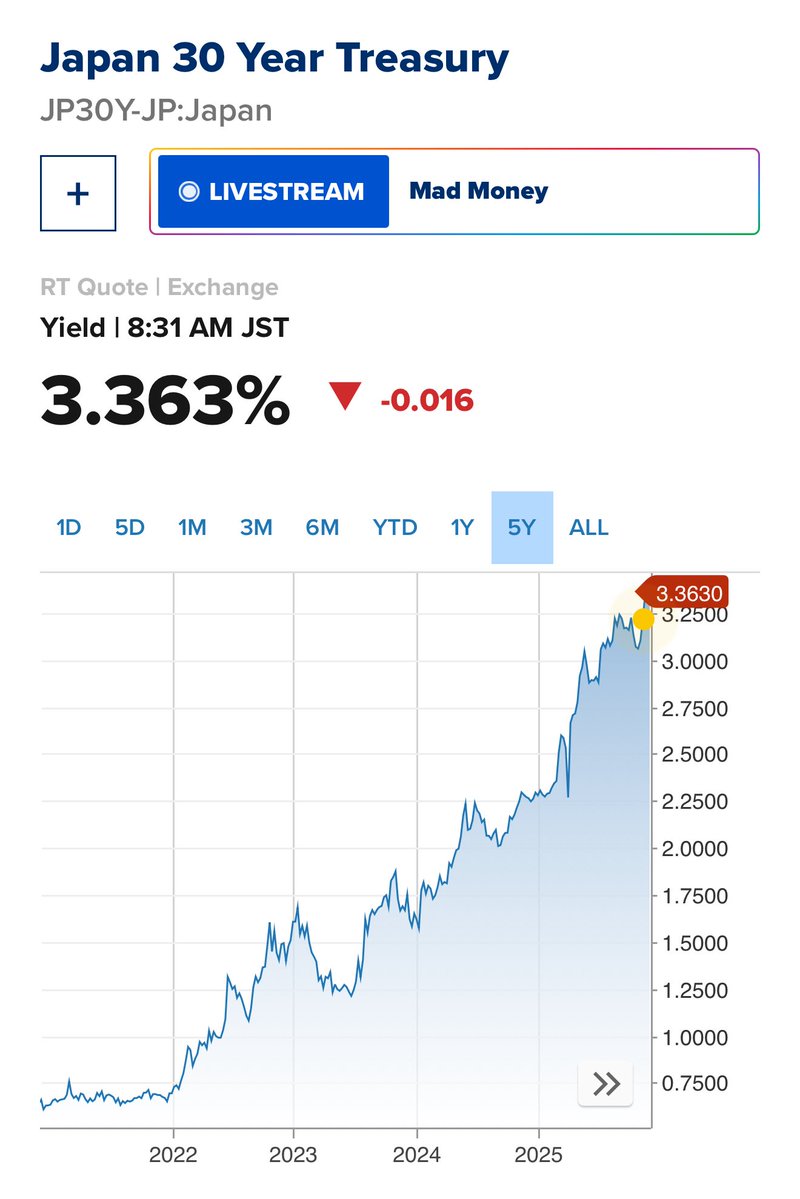
THE GLOBAL FINANCIAL SYSTEM JUST BROKE IN TOKYO
Japan’s 30-year bond yield hit 3.41% today. That number means nothing to you. Here’s why it should terrify you.
Japan owes 230% of everything it produces. It’s the most indebted nation in human history. For 35 years, they kept the lights on by borrowing at near-zero rates. That era ended this morning.
Here’s What Just Happened
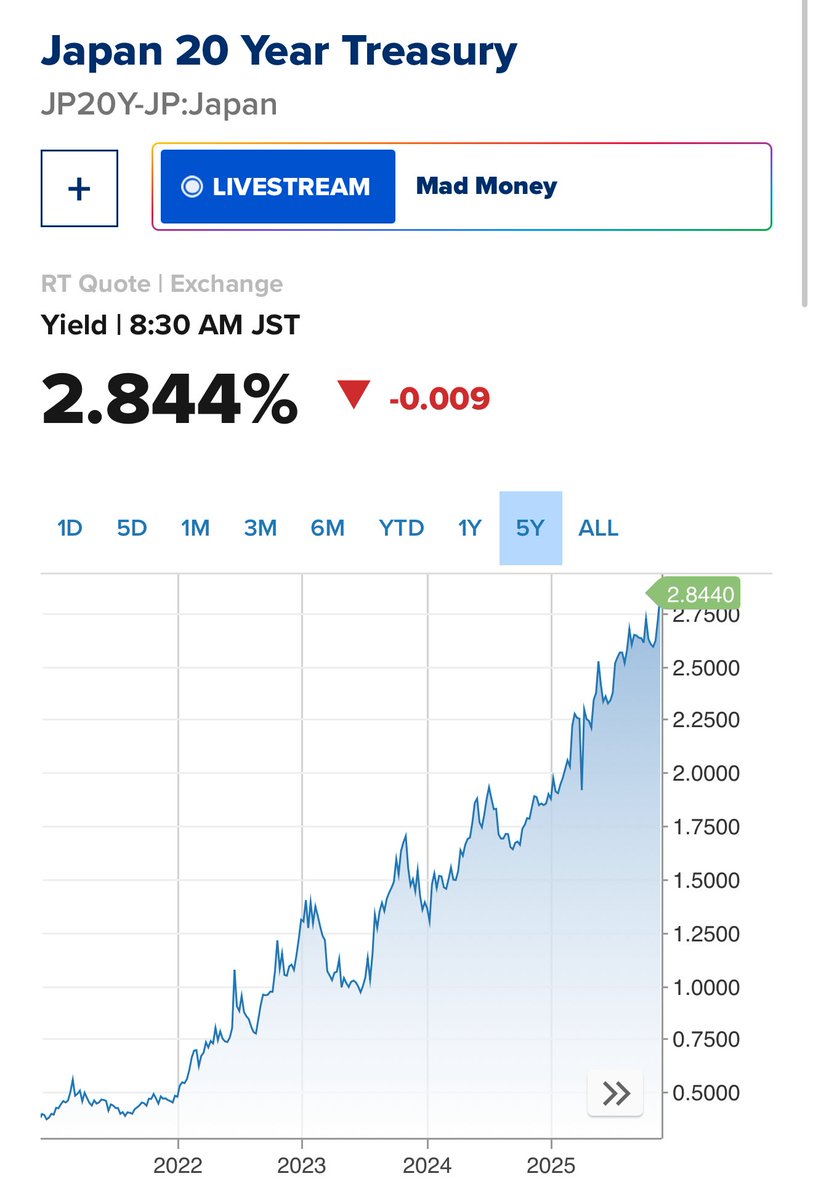
Core inflation is running at 3.0%. Government bond yields are spiking to levels not seen since 1999. China just conducted its 25th military incursion near Japanese waters this year. Japan is now forced to spend 2% of GDP on defense … nearly 9 trillion yen annually.
The Bank of Japan is trapped between two impossible choices: raise rates and trigger a debt collapse, or keep rates low and watch inflation destroy savings. They chose door number two.
Why You Should Care
Every major bank, hedge fund, and institution on Earth has borrowed yen at cheap rates and invested it elsewhere for 30 years. This “carry trade” could be worth anywhere from $350 billion to $4 trillion. Nobody knows the real number because it’s hidden in derivatives.
When Japan’s system breaks, this money unwinds. Fast.
The last time we saw a preview … July 2024 … the Nikkei dropped 12.4% in a single day. The Nasdaq fell 13%. That was a small tremor. The earthquake is coming.
The Math Is Simple!
Japan’s government pays interest on $9 trillion in debt. Every 0.5% increase in rates costs them $45 billion annually. At current yields, debt service will consume 10% of all tax revenue. That’s the death spiral threshold.
The yen is trading at 157 to the dollar. If it strengthens to 152, the entire carry trade becomes unprofitable. Unwinding begins. Emerging market currencies could drop 10-15%. The Nasdaq could fall 12-20% as funds are forced to sell.
What Happens Next
December 18-19, the Bank of Japan meets. Markets are pricing 51% odds they raise rates another 0.25%. If they do, volatility explodes. If they don’t, inflation accelerates and the problem gets worse.
There is no way out. Japan’s fiscal dominance is now permanent. They must keep the yen weak to service their debt. This means the free money that powered global markets since 1990 is ending.
The Bottom Line
Interest rates worldwide are going up 0.5-1.0% permanently. Not because of inflation. Because the world’s largest creditor nation can no longer subsidize global growth.
Your mortgage, your car loan, your credit card … all repricing higher. Stock valuations built on cheap money … all compressing. The everything bubble … all deflating.
This is not a recession. This is a regime change. The largest liquidity engine in financial history just seized up, and most people won’t understand what happened until their portfolios are down 30%.
Tokyo broke the world today. You’ll feel it tomorrow.��
Read the full data driven deep dive article -
https://t.co/enhJeYNeo1
Ummm... $NVDA is currently trading at 27.6x sales, which means the "market" expects $NVDA to pay it, as a dividend, 100% of its sales, every yr, for the next 27.6yrs. I'll remind you of this quote from Sun Microsystems' CEO when the https://t.co/ThQz52tZgT bubble burst in 2002.
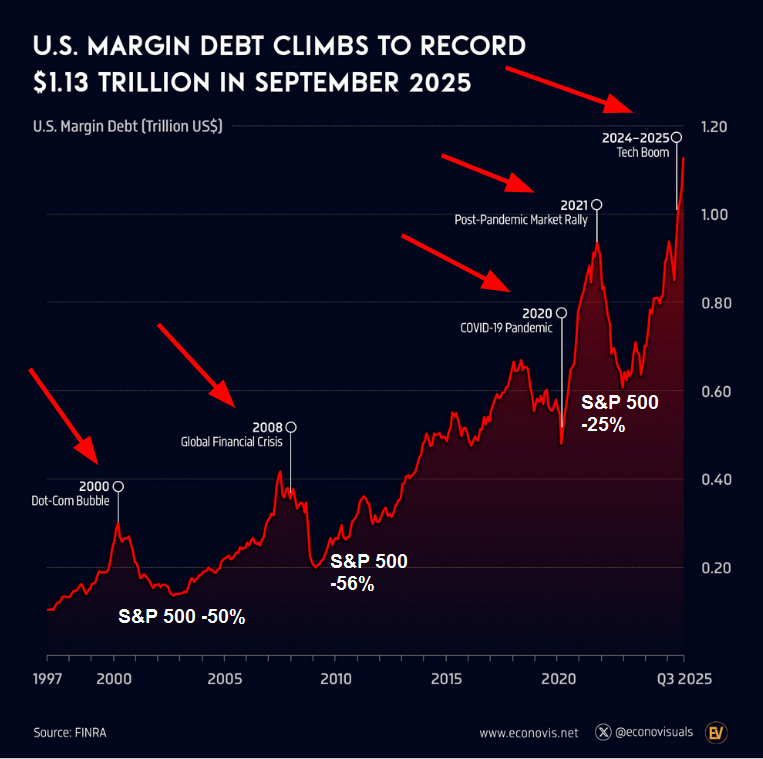
⚠️Margin debt is rising at a rate last seen before major bear markets and market CRASHES:
Margin debt jumped 6.3%, or $67 billion, in September to a record $1.13 TRILLION.
Investor leverage has surged 39% since April, marking the biggest 5-month spike since the late-2021 market frenzy.
In the past, similar margin debt spikes have almost always preceded major market declines:
1) 2000 Dot-Com Bubble,
2) Great Financial Crisis in 2008,
3) The late-2018 Fed-driven selloff,
4) 2022 bear market.
Will history repeat?
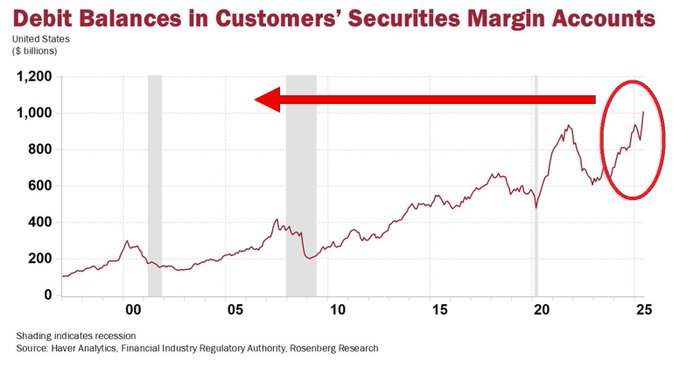
Investor leverage has nearly DOUBLED over the last 2 years.
This marks a similar pace to the rise seen following the 2020 pandemic.
As a % of GDP, margin debt now sits just below the 2021 peak.
Needless to say, risk appetite is arguably at its strongest level ever.