$BTC.X Time of truth. the price is testing its weekly SMA200 and monthly SMA50 + long term channel support at once. If this level can't hold ... Weekly&Monthly charts
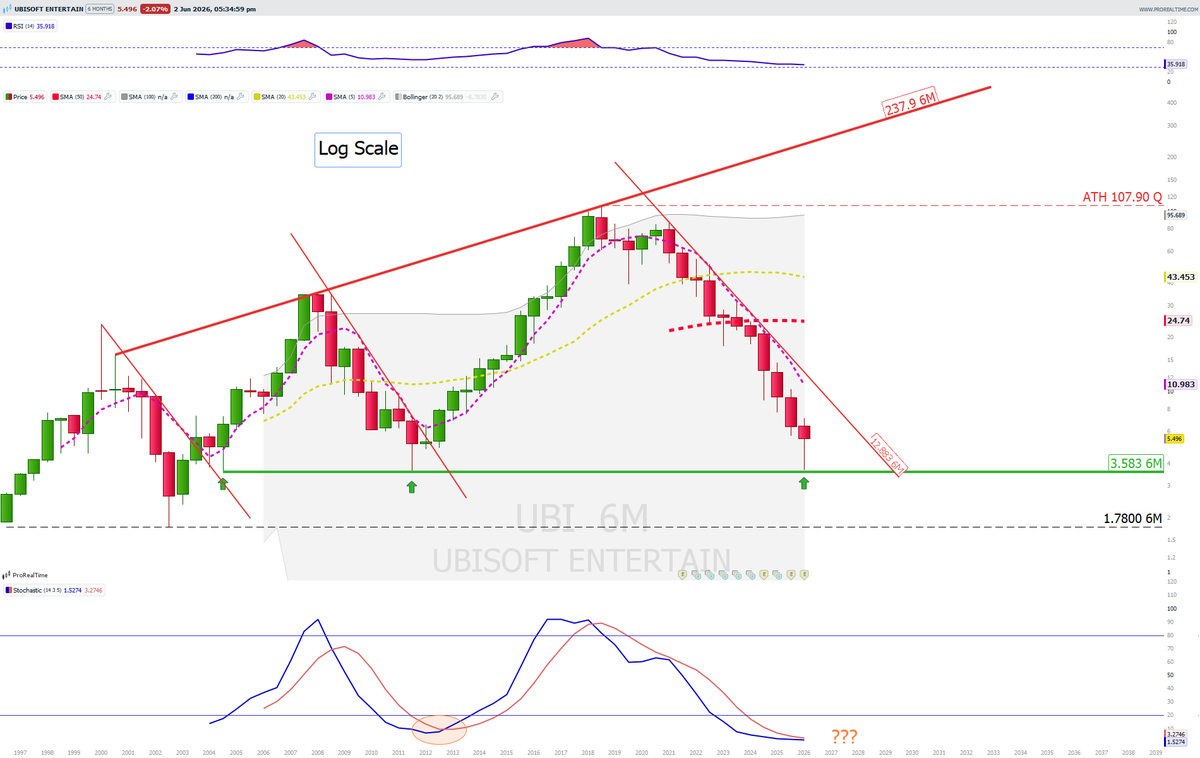
$UBI I don't think it needs to be said, but I'll say it anyway: this is a lottery ticket. It's a company going through its darkest hours. I have no position on it, nor will I.
$BABA I'm looking at that +6% in Hong Kong market ... the price is at long term support and this could be the beginning of something good ... Monthly candles chart
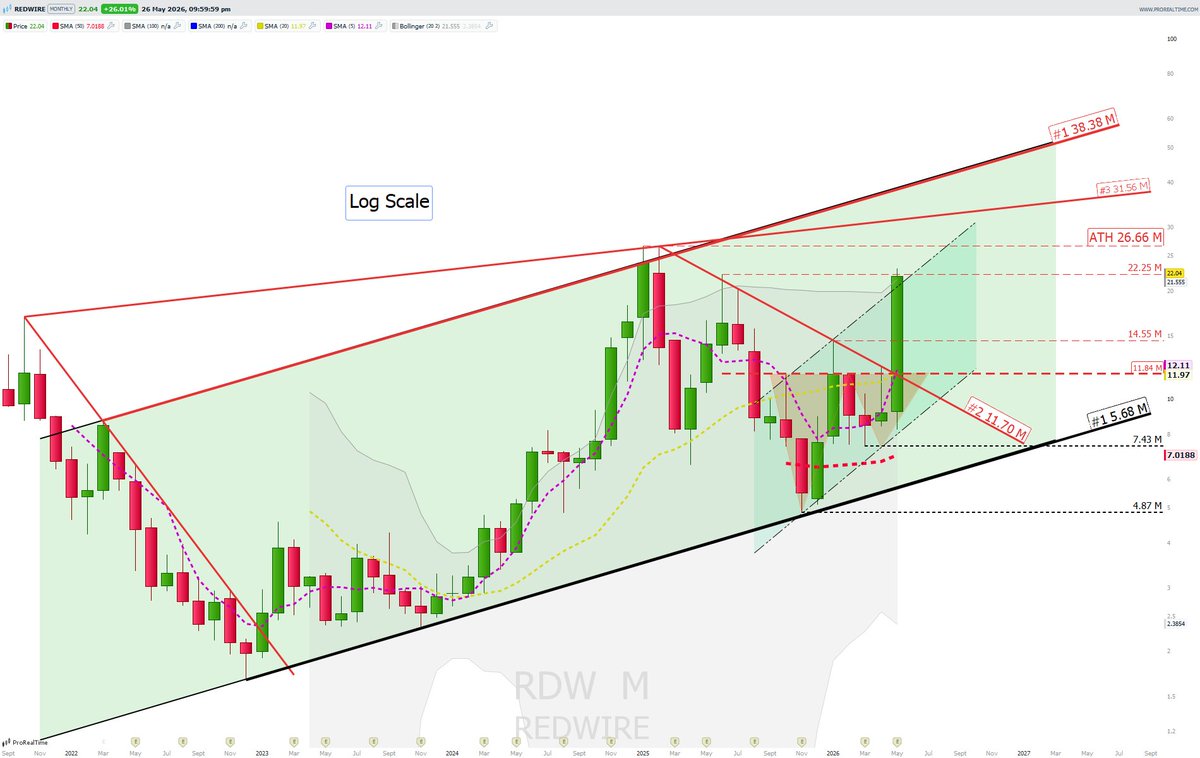
$RDW Another example of ... ASTROLOGY FOR MEN ... what a beautiful candle, huh? The price is facing ATH. And you take in consideration that daily RSI is very overbought at this point, ok? Be greedy but wise. GL! Monthly candles chart.
@Tautilas@Saul_Investings Yo solo sé que mi sensación es que no tengo suficientes cromos comprados 🤣. El Lunes amaneceremos con cruce bullish de estocástico mensual y si repite pauta esta bicha es capaz de doblar sin despeinarse.
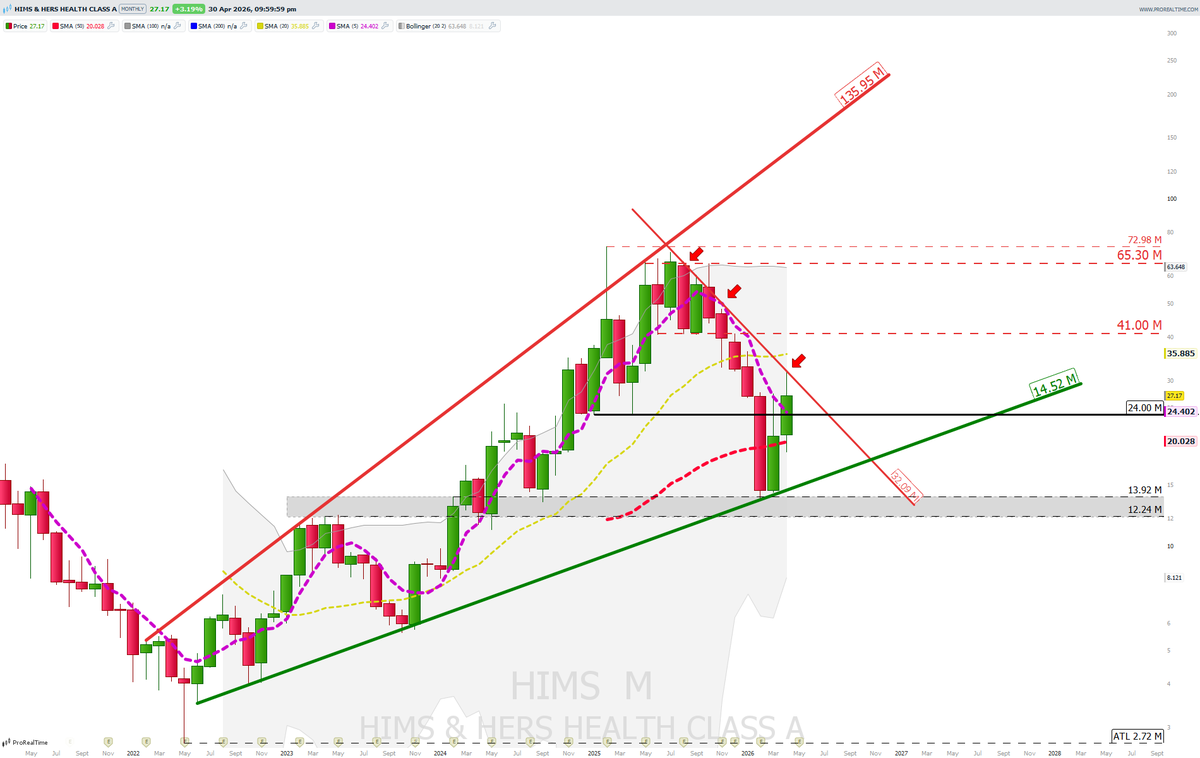
$HIMS Monthly chart. That downtrend line will be at 26 in June ... and the monthly candle will open on Monday at that level ... I'm intriguing.
Let's see what happens ...
@OscarRubnRubio1 pero si soy un chartista de que voy hablar ? Precio y nada mas que precio. Una cosa es el stock y su comportamiento y otra distinta la compañia que hay detrás. Yo no hablo nunca de fundamentales. No tengo tiempo, para mi ASTS es un stock mas no EL STOCK.
$ASTS ... and shooting star candle at ATH = potential double top so far. I'm adding some healthy retracements just in case that candle confirms its bias by default in the next week. Weekly candles chart.