BREAKING: Global technology funds posted +$12.3 billion in inflows in the week ending June 10th, the largest weekly inflow since at least 2017.
This includes +$3.0 billion into the 3x leveraged long S&P 500 ETF, $SPXL, and +$2.9 billion into the Semiconductor ETF, $SOXX.
This also follows +$9.0 billion in the prior week, the 4th-biggest on record.
As a result, the 4-week average of inflows rose to +$5.8 billion, the 2nd-highest reading on record.
Furthermore, US equities have seen 11 consecutive weekly inflows, the longest streak since December 2025.
Meanwhile, Korean stocks attracted +$5.9 billion in the week ending June 10th, the biggest weekly intake since March 2026.
Investors are buying tech stocks at a record pace.
The capital flow story around $BTC right now is more interesting than the price action itself.
Here's what I keep coming back to: the IPO cycle of the last 18 months has been one of the most quietly wealth-generative episodes in recent memory. Companies that were paper fortunes for years have gone liquid. Founders, early employees, seed investors - many of them came from crypto originally. They rotated into equities when the regulatory climate turned hostile and the macro headwinds stacked up against digital assets. That was rational capital allocation at the time.
Now those same actors are sitting on realized gains. Liquid gains. The kind that get professionally managed, partially diversified, and in many cases recycled back into the assets these people actually understand at a deep level - not because they read a research report, but because they lived through the last cycle and still believe in the long-term thesis.
This isn't speculation - it's just pattern recognition. The IPO-exit-to-crypto reinvestment loop has played out before. 2017 ICO wealth created 2018-2020 angel investing. 2020-2021 crypto gains seeded a wave of startup founders who are now IPO-adjacent. Capital compounds through ecosystems. BTC is the most institutionally legible asset in the crypto universe - the one that newly liquid wealth managers can explain to an LP without a three-hour primer.
The antithesis, and it's a real one: none of this matters if the macro backdrop deteriorates meaningfully from here. If credit conditions tighten, if the IPO window closes before wealth distribution finishes playing out, if the Fed pivots later than the market expects - newly liquid founders sit in short-duration paper and wait. One more leg lower is entirely plausible. The close confirmation worth waiting on matters precisely because sentiment can still flip.
But the synthesis is this: whether the bottom is already in or we see a final flush, the structural case for the next material inflow is already building. It isn't about chart levels or on-chain signals (though both are constructive). It's about recognizing that the total pool of capital with the conviction and familiarity to allocate to BTC is measurably larger today than 24 months ago - and a meaningful portion of it is currently sitting liquid, recently harvested from the equity markets, looking for its next long-duration position.
From a capital allocation perspective, what I'm watching isn't the daily close. It's IPO lockup expiration calendars. Secondaries market activity. The quiet accumulation by family offices that didn't participate in the 2021 run and now have the mandate to. These are the leading indicators of inflow that don't show up in price until they already have.
Still holding a core position. Cost basis is low enough that near-term volatility doesn't change the calculus. The thesis here is measured in years, not quarters - and the macro setup for the next leg is further along than most people realize.
One of the best companies on earth $PLTR led by Alex Karp is trading down nearly 2% over the past year.
The street expects strong EPS growth of around 95% YoY.
The average annual earnings growth of around 30–32% per year for the next 5 years, with revenue growth around 30% annually. EPS specifically is projected at a rough 29% CAGR.
Also, the continued AI platform AIP momentum, especially in U.S. commercial (guided >120% growth in 2026).
This is an easy $200+ stock.
Everyone thinks "cycle-aware" means slow-moving macro positioning - hold through the downturn, rebalance at the turn, collect alpha over five years. That's how funds sell it. It's not how I trade it.
The capital cycle exit signal is the fastest setup I track. When a sector gets wrecked - capex collapses, equity raises dry up, the weak hands file chapter - that's not a long-horizon thesis. That's a 6-to-10-week trade with defined risk and a clear catalyst window. Margins for survivors have nowhere to go but up, and the market prices it faster than most "cycle investors" expect.
$VPX is built around exactly this framework: find where competition is exiting and earnings are about to expand, then layer in leading economic data to manage the business cycle timing risk. That second part is where most traders blow up. They read the industry signal right and then get killed waiting because the macro turns later than the micro.
I've been watching capital cycle setups in energy services and industrial metals for three months. Capex in both is near decade lows relative to revenue. New equipment lead times are 18-24 months minimum - you can't fast-forward supply. That gap between demand inflection and supply response is a structural margin expansion story, and it's early innings.
Took two scalp legs in this space this quarter on momentum confirmation. Both worked. But the bigger read - the one a product like VPX is positioned to capture - is that the full expansion phase hasn't priced in yet. The names in the early part of the cycle still carry elevated IV because generalist money hasn't rotated. I keep tight stops and add on dips rather than sizing heavy upfront.
Business cycle overlay matters more now than any point in the last decade. We're not in a clean expansion where sector rotation is automatic. Parts of the economy are still contracting while others rip. Capital cycle discipline - finding where competition already exited - is the edge that separates setups worth trading from the noise.
Current read: energy services and parts of industrial supply chain are the cleanest capital cycle setups on the board right now. Semis had this 18 months back - that cycle is mature, don't chase the laggards. Find the new one before the crowd does, size accordingly, protect with stops.
Was wrong on the early energy timing call back in Q1 - thought the turn was imminent, got chopped, stopped out. Changed the approach: wait for leading data confirmation before adding size. Humbling but it tightened the process.
Tight stops, defined RR, stay disciplined.
woke up to $IWM printing new highs - the cup-and-handle off the March low finally resolving. weekly close matters more than the intraday print. adding on any pullback, stop under last week's low.
Nearly half of the US AI data center projects planned for 2026 have been delayed or canceled. That's the number in Nixxy's release today, citing industry reports, and it tracks with everything else I'm reading. Sightline Climate counted 16+ GW of capacity promised for 2026 and found about 5 GW actually under construction. Five. The rest is stuck waiting on power, transformers, permits, you name it. $NIXX is winning today!
https://t.co/t54SWyTyMT
$NIXX My input.. most AI data center projects are a daisy chain. Somebody else's power, somebody else's construction crews, financing that shows up later if it shows up at all. Any link slips and the whole schedule slips, which is how roughly half the 2026 pipeline ended up delayed or canceled per the industry reports the release cites. Nixxy and Tachyon9 are building it the other way: power, infrastructure, financing and compute deployment inside one execution framework. The future is compute and these guys are lined up for it.
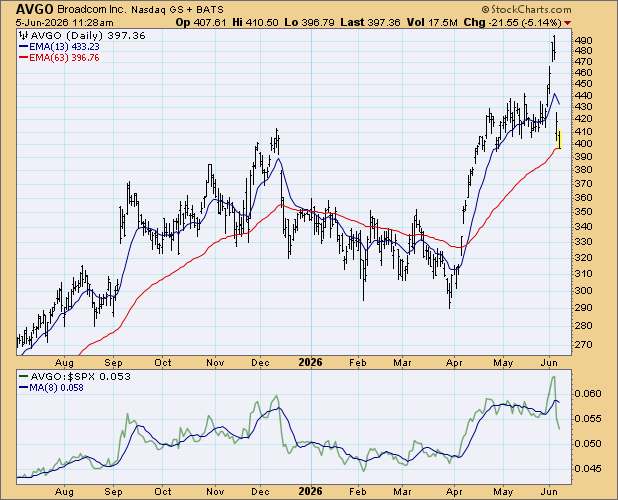
$AVGO flow has been nagging at me for five days now, and I finally need to put it in writing.
Somebody has been systematically selling the Jun-26 $380 calls. Not once. Not twice. Five days straight. Peak day hit 240 contracts - $660k in premium in a single session at $27.39 average. Month-to-date they've accumulated $1.4M in premium on this one strike. And they're doing it hitting the bid - 96% bid fill, 2% ask. This isn't someone stumbling into a fill. This is a program.
Vol/OI came in at 2.4 with +171 contracts added to open interest overnight. They're not closing. They're building a short-call position and sitting on it.
Two reads on a trade like this:
Read one - covered call seller. Someone sitting on a large AVGO long who thinks $380 is the top end of fair value for the next 15 days. Getting paid $27+ per contract to cap upside. At that premium they're saying: I'll surrender any gains above $380 in exchange for income. Not broadly bearish on AVGO - just disciplined about near-term ceiling.
Read two - directional short vol. Naked or delta-hedged short these calls because they're confident AVGO doesn't see $380 before June 26. They want the premium and have enough conviction to keep adding over five consecutive days.
The 42/100 score is middling, ngl - not the kind of flow that makes me slam an alert. But the consistency is what you can't ignore. Anyone can put on 240 contracts once and walk. Doing it for five days running at the same strike suggests a thesis, not a coincidence.
I've had AVGO on watch since semi momentum started feeling heavy. The $380 print gives me a clear level to anchor off. If you're long AVGO into that range, this flow isn't a reason to dump - it's intel on where sophisticated sellers are layering in. That tells you where to trim, where to hedge, where not to chase.
If I'm trading this, I'm not buying the $380 calls into this seller. That's buying supply that's being systematically added - amateur setup. If I want AVGO upside exposure I go higher strike or push the expiry out to get clear of this overhang. Or I wait for a clean breach of $380 with real volume before touching calls at all.
The time stop is real. June 26 expiry. Theta decay is accelerating from here. If AVGO drifts or goes sideways, the seller pockets all of it. If AVGO rips on any catalyst - AI capex headlines, supply chain read-through, anything - this unwinds fast and they're covering into a squeeze. That's the asymmetric risk they're running: short gamma, collecting theta, hoping nothing breaks their way.
Watching $380 closely. Failed test into expiry and the thesis plays out clean. Breach and hold above that level and I'll want to track covering pressure - could get violent.
NFA.
There's a trader staring at a screen right now with $39 million on the line - a $ETH short, 20x leveraged, liquidation price sitting just $170 away from where the market is trading.
I've been thinking about this position for the last hour. Not because I want to watch it blow up (though at 20x, the math is unforgiving - a 5% adverse move wipes the margin entirely). But because this single trade captures almost everything about where we are in the current cycle.
When I started building my ETH position in late 2022, the thesis was grounded in something I could actually analyze. The network was generating measurable fee revenue. The supply mechanism was turning deflationary under congestion. The developer ecosystem was undervalued relative to the throughput improvements already baked into the roadmap. Book value metrics don't map cleanly onto crypto protocols - I'll freely admit that - but the free cash flow analogue (protocol revenue minus issuance cost) was turning positive in ways the market wasn't pricing. Cost basis around $1,100 on the core position. No leverage. Multi-year horizon.
This whale is doing the opposite of everything I believe in.
20x leverage means a 5% move against you isn't a drawdown. It isn't a painful quarter you ride out. It's a total wipeout. And at $39M in notional size, the liquidation itself would move the market - the position's failure would accelerate the very price move that causes the failure. That feedback loop is not a trading edge. It's a structural trap.
He's $170 away.
I'm not here to root for the liquidation. Watching these plays in real time is mostly just a reminder that a lot of what gets called "crypto trading" is still leverage-driven speculation running on venues that would never survive regulatory scrutiny if they were offering these products on equities. The platforms enabling 20x on a $39M position are not functioning exchanges - they're margin-maximizing machines that profit from the churn regardless of who wins.
That said, the useful signal buried in this story is the underlying thesis the short represents: a sophisticated, well-capitalized actor believes ETH is overvalued at current prices. That view deserves honest engagement, not dismissal. My own model still has ETH undervalued relative to a normalized fee environment - protocol revenues with L2 fee sharing eventually reflected, staking yield as intrinsic return, the supply dynamic tightening over a multi-year window. But concentrated, leveraged short interest of this size is exactly the kind of overhang that precedes violent moves in either direction.
If this position gets liquidated, forced buy pressure could push 5-8% intraday. If the thesis is right and ETH breaks lower, the bears get paid and momentum longs get hurt badly.
The thing I keep returning to: when you own something because the fundamentals support it, when your cost basis reflects a genuine margin of safety, and when there's no leverage in the structure - you can watch this theater with genuine detachment. You don't need to know how today resolves. The underlying ROIC story doesn't change because someone opened a $39M directional bet at 20x.
Still long. Cost basis intact. No margin.
Sometimes that really is the whole strategy.
Softbank down 8%+ intraday - and everyone's focused on Softbank. Wrong place to look.
The more interesting trade here is $ORCL, and this is worth breaking down properly because I think the market is misreading the causality.
I've been in ORCL calls since mid-May. Added last week. The thesis is cloud infrastructure share gains in AI workloads - Oracle Cloud Infrastructure has been quietly eating into the hyperscaler market in training runs, and the enterprise database-to-cloud migration cycle still has legs. That thesis doesn't change because Softbank is having a bad day.
Now, why does Softbank matter at all for ORCL? Because when major institutional players with diversified tech exposure get hit this hard this fast, the reflex move from retail and even some desks is contagion selling - anything that rhymes with AI, anything tech-adjacent, gets hit on sympathy. That's exactly the kind of dumb selling that creates entries.
The ORCL chart right now: base forming in the mid-160s for about three weeks. That's constructive. Two separate macro scare days have tested the 165 level as support and it's held both times. Volume on down days is lighter than volume on up days. The supply is being absorbed. That's not a chart that cracks on someone else's problems.
Risk case I'm actually watching: if Softbank is specifically unwinding an ORCL position - not just a general tech selloff but an actual ORCL liquidation - you'll see it in the tape before you see it in the news. Unusual volume, prints stacking on the offer, dark pool activity. That's my real stop signal, not a price level. If I see that kind of tape, I'm out fast.
But absent that? My stop is a daily close below 163. Target is 178-180. From current levels that's roughly 3-3.5R.
I'm not adding here. Already positioned and the RR from my basis is still clean. No reason to chase.
Tomorrow morning matters. If ORCL opens weak on Softbank sympathy and then bids - weak open, strong close - that's confirmation the dumb selling is getting absorbed and the setup is intact. If it gaps down and keeps going, reassess.
The broader Softbank story is messy and I don't have full visibility on what caused the 8% drop. Wrong on that read? Probably missing pieces. But the ORCL tape is the ORCL tape. It doesn't care about someone else's balance sheet. Trade what's in front of you.
There's a version of the Macy's thesis that gets dismissed in thirty seconds: department stores are dying, foot traffic is down, Amazon won, next question.
Berkshire apparently read a different version.
What Buffett and Munger spent decades hunting was never the glamorous growth story. It was the asset-heavy, out-of-favor business the market was pricing as terminal - when the actual terminal value was sitting right there on the balance sheet, unloved and underappreciated. Macy's carries roughly 300 company-owned real estate locations on its books at historical cost. The market, busy writing the obituary for department retail, has been ascribing almost no value to those assets for years.
That's the Munger move, and it's old as the hills: find where the accounting creates the illusion of terminal decline and the balance sheet tells a different story.
Macy's FCF picture is complicated - the business has been investing in restructuring, closing underperforming doors, repositioning luxury through Bloomingdale's and Bluemercury. Strip out restructuring charges and look at normalized free cash flow from the retained store fleet, and the number looks different than the headline P&L suggests. Not great, exactly. But not terminal either.
The P/B on $M has traded at a significant discount to tangible book for stretches of the last few years. When you're buying a business at below tangible book - and a meaningful portion of that book is real estate in major metro markets - you're getting paid to wait. The optionality on asset monetization (sale-leaseback, redevelopment partnerships, outright dispositions) is not priced in. Berkshire has presumably done that math.
The antithesis is real and shouldn't be waved away: secular department store decline is structural, not cyclical. The middle-market consumer is being hollowed out. Private label economics are under pressure. "Cheap on book value" is a trap if the book is melting faster than you can monetize it.
But here's the synthesis Berkshire may be running: you don't need a full retail turnaround. You need real estate optionality to surface faster than retail erosion compounds. If Macy's can stabilize its fleet at 350-400 productive doors, generate $400-600M in normalized annual FCF, and continue monetizing owned real estate - the IRR on a below-book entry is perfectly adequate for a patient, long-horizon holder. You're not betting on department retail renaissance. You're betting on asset realization at a price the market refused to underwrite.
The "vintage Buffett Munger" framing is accurate. This isn't a GARP play. It's closer to the Washington Post or See's Candies logic - buy the business consensus has written off, at a price that gives you a margin of safety through the balance sheet, and let time and capital allocation do the work.
I'll be watching real estate monetization disclosures and normalized FCF per door over the next 6-8 quarters. That's the tell. ROIC on retained stores is the other metric - if it's stabilizing above cost of capital, the bear case starts looking more like pessimism than analysis.
Worth the hour of work to dig in. Do your own.
$NIXX as I said a week ago say goodbye to the .70s now the .80s and very soon .90s and say goodbye to Pennie’s and say hello to $ !! Only up from here !
$NIXX "today announced that it has entered into a Letter of Intent (LOI) with Tachyon9 Corporation, a privately held energy and infrastructure company, to pursue a strategic transaction designed to create a publicly traded artificial intelligence infrastructure, power generation, and high-performance computing platform."
https://t.co/iakZbXCR4k
"It's greed, it's envy, it's lust, it's being covetous."
@JackPosobiec described the ideology behind far-left protestors in San Antonio who spew hatred for Charlie and Erika Kirk on Monday's "National Report." @BobBrooks_NMX@E_D_Hill
The bearish pressure maps catching $AMZN this week are technically coherent - weekly frame compressing, larger structure confirming weeks of warning.
I'm not going to argue with the short-term read. But I've been long since the mid-2020 consolidation, and the signal I actually watch isn't the weekly pressure map - it's the divergence between the operating cash flow trajectory and the pace of multiple compression.
Let me be specific about what that looks like right now.
Amazon's trailing twelve-month free cash flow came in around $38 billion at last report. The AWS segment is running operating margins north of 37% - up from the teens just a few years ago. The advertising business is compounding at roughly 20% annually and is now generating more operating income than many S&P 500 companies in their entirety. That's not a business under fundamental pressure. That's a business the market is repricing relative to macro duration concerns and rate sensitivity - repricing that happens to all long-duration assets when the discount rate sentiment shifts.
The distinction matters a lot if you're managing a position over years rather than weeks.
When these Mag 7 pressure maps flag Amazon alongside the other large-cap tech names, there's a bundling problem embedded in the framing. The market treats them as a correlated basket during risk-off rotations, and in the short run, that correlation is real. But Amazon's capital allocation story over the next three to five years is structurally different from many of its cohort peers.
Consider what's actually happening at the business level. The Kuiper satellite constellation buildout is a multi-year infrastructure investment being expensed today but monetizing against a total addressable market that barely exists yet. AWS margin expansion has years of runway as the mix shifts toward higher-margin software and AI services layered onto core infrastructure. The retail flywheel - fulfillment density, advertising, third-party seller services - has compounding dynamics that are genuinely difficult to replicate. These aren't priced on a weekly frame. They're priced across a capital cycle.
My cost basis sits well below current levels even after the recent drawdown. Added a small increment on weakness this quarter - not because I'm fighting the technical signal, but because I've done the work on intrinsic value and the margin of safety is widening as price drifts lower.
The EV/EBITDA multiple has compressed considerably from 2021 peak readings. Forward P/FCF, normalized for the current elevated capex cycle (which should moderate as Kuiper and AI infrastructure investments mature), is actually reasonable for a company with Amazon's ROIC profile and moat depth across three distinct compounding businesses. Book value understates the asset quality because the brand, the logistics network, and the AWS customer relationships don't appear on the balance sheet at fair value - but they're real and they're durable.
If the pressure map is right and the weekly frame resolves lower from here, I'll add more. The business hasn't changed. The price has.
That's typically the moment value investors are supposed to act - not when everyone finally agrees it's safe to buy.