Market reads that I actually use to position my stock swing book and day trade futures. Full-time trader, 22+ years in markets.
Free weekly market analysis 👇
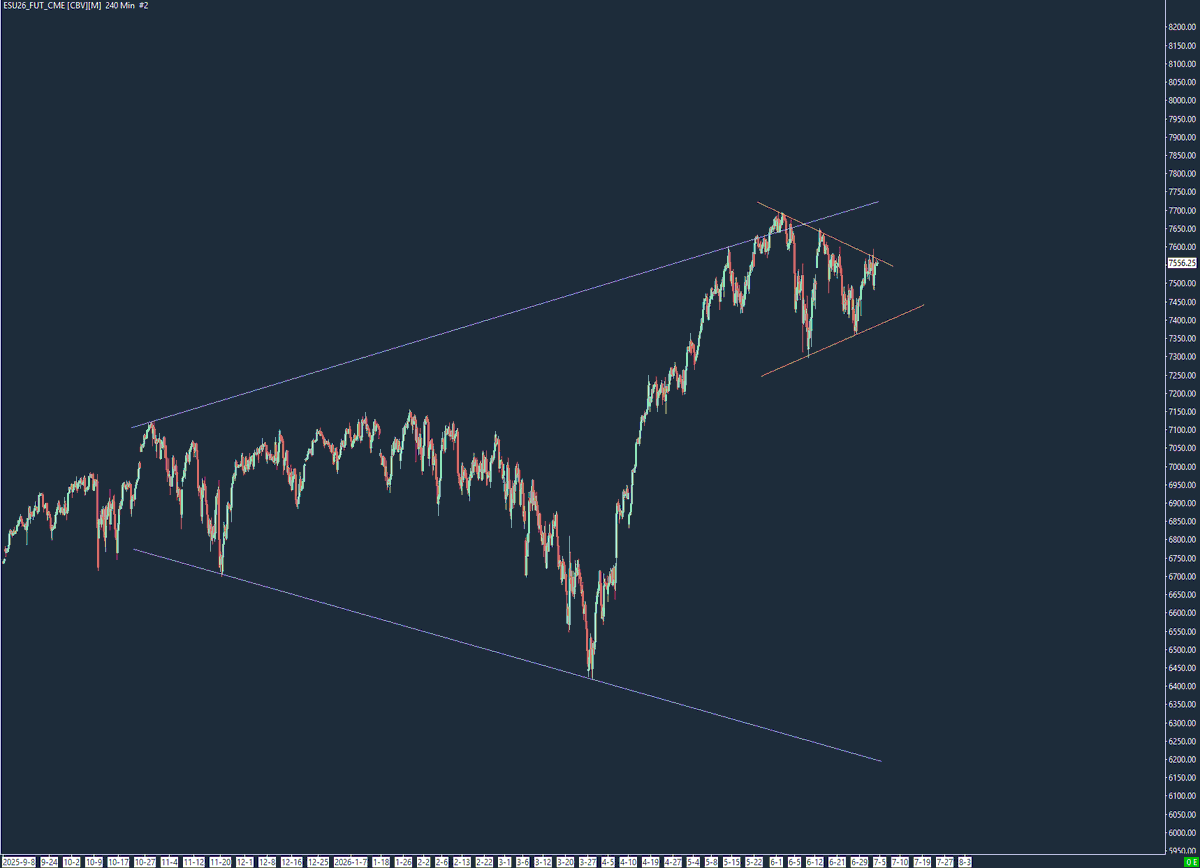
#ES_F - price is putting in lower highs since June 2
Since 2010, the $SPX has risen in 82% of Julys, so if this month is to be more of that, bulls should take out Friday’s high (the most recent lower high) and work its way higher across the other lower highs
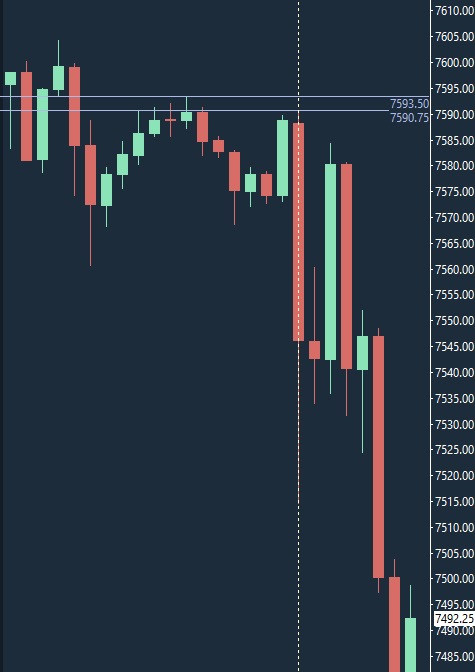
#ES_F trade yest
7593, a level that emerged on June 17 (Fed day) when sellers didn’t allow price to pull back further before taking control
Held again 6/22
Did it have one more defense? Yes, sellers pushed away from there again 10:20 est
Target hit quickly (+ then some)
$SPX 30-day realized volatility exceeds implied volatility (calc uses at-the-money options expiring 30 days out)
When this happens, as it has all week, short-volatility machinery is starving & vol sellers are not being compensated for delivered vol
Precedes capitulation $SPY
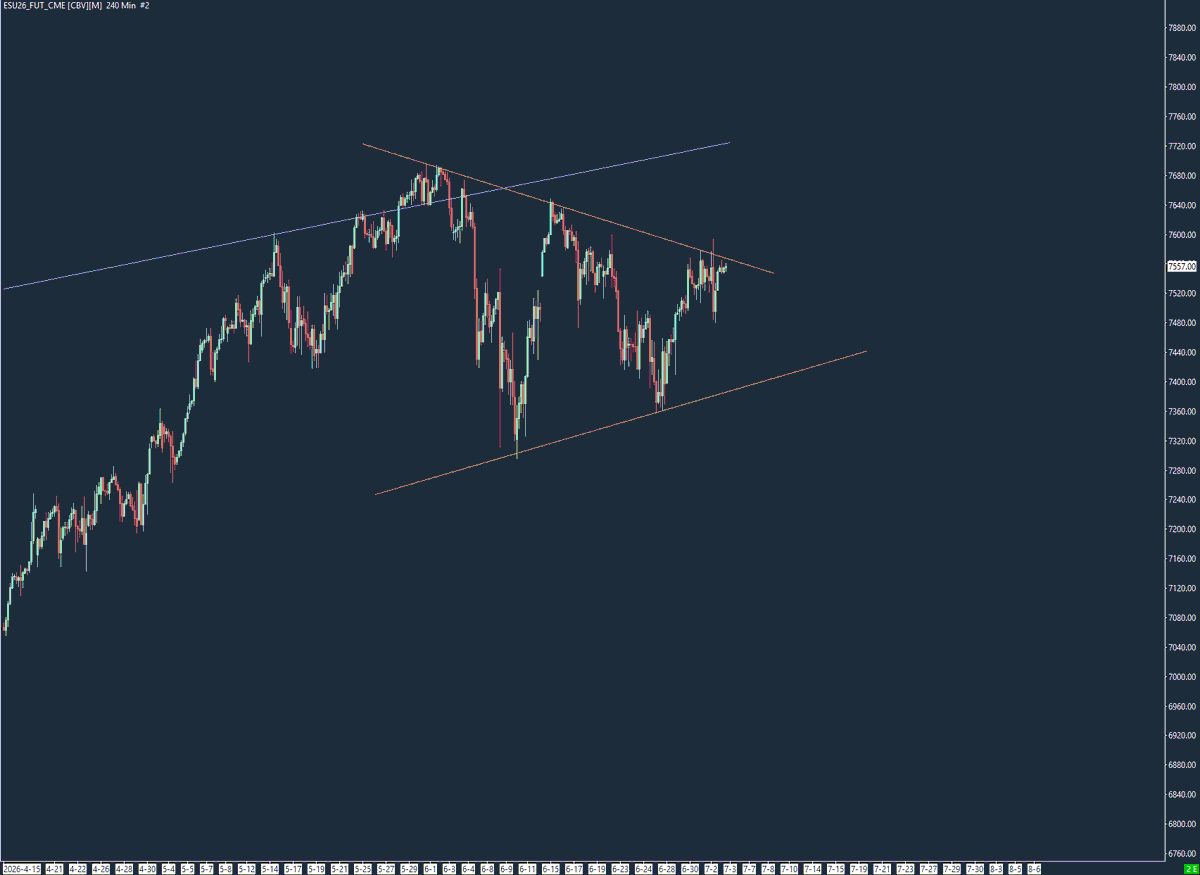
You don't need 15 indicators to read a regime
The whole #ES_F regime - trend leg and consolidation structure - is legible from four lines
Rallied hard off the low and now digesting in a tightening range near the highs
@ashwagamma@AdamMancini4 It's puzzling that people are looking for longs in the face of 100 points of selling. Anything could happen, but this was a clear short setup today.
@AdamMancini4 Two way volatility has been up for a month, with a large expansion in realized vol detected weeks back. Normally implied volatility runs above realized, since options usually cost a bit more than how much the market actually moves.
@AdamMancini4 Super high quality signaling and short from the setup level at 7593
This is an environment that favors two-way action and that's exactly what we've gotten