I accidentally discovered how to compress a semester of learning into 48 hours.
A grad student at MIT showed me his NotebookLM setup. I thought he was just organized. Then I watched him pass a qualifying exam on a subject he'd never studied before.
Here's exactly what he did:
First: he didn't upload a textbook.
He uploaded 6 textbooks, 15 research papers, and every lecture transcript he could find on the subject.
Then he asked NotebookLM one question:
"What are the 5 core mental models that every expert in this field shares?"
Not "summarize this." Not "explain this topic."
Mental models. The stuff that takes professors years to develop.
But the next part is what broke my brain.
He followed up with:
"Now show me the 3 places where experts in this field fundamentally disagree, and what each side's strongest argument is."
In 20 minutes he had a map of the entire intellectual landscape of the field:
the debates, the consensus, the open questions.
Most students spend a full semester just figuring out what those debates even are.
Then he did something I've never seen before.
He asked:
"Generate 10 questions that would expose whether someone deeply understands this subject versus someone who just memorized facts."
He spent the next 6 hours answering those questions using the source material. Every wrong answer triggered a follow-up:
"Explain why this is wrong and what I'm missing."
By hour 48, he could hold a conversation with his thesis advisor without getting destroyed.
The tool didn't change. The questions did.
Most people treat NotebookLM like a fancy highlighter.
These students are using it like a private tutor who has read everything ever written on the subject.
The difference between a semester and 48 hours isn't the amount of content.
It's knowing which questions to ask.
NEWS: Waymo has released a new blog post detailing their AI strategy and how it’s allowing them to bring service to more riders faster.
"Achieving demonstrably safe AI — where safety is proven, not just promised — requires a holistic approach. Beyond a smart and capable Driver, you also need a closed-loop, realistic Simulator to train and rigorously test the Driver in a myriad of challenging situations, and a sharp Critic to evaluate the Driver's performance and identify areas for improvement."
Waymo says that autonomous driving isn’t just a matter of building a “smart driver,” but rather creating a full AI ecosystem centered on safety from the ground up. At the core is the Waymo Foundation Model, a unified world-model that powers all major components of Waymo’s autonomous stack (Driver, Simulator, Critic).
"By using a “Think Fast/Think Slow” architecture (combining rapid sensor-fusion with deep semantic reasoning), this system enables the car to detect complex and rare road scenarios (e.g. a burning vehicle ahead), reason about them, and choose safe behavior. Waymo trains large “Teacher” AI-models for driving, simulation, and evaluation, then distills them into smaller, efficient “Student” models suitable for real-world deployment, while keeping safety validation tightly integrated. The result is a continuous “flywheel” of learning: driving data (real and simulated) generate feedback, which leads to refinements, more simulation, more data, and only when safety checks pass is new code deployed. Having already exceeded 100 million fully autonomous miles, Waymo reports a more than ten-fold reduction in severe-injury crashes compared to human drivers."
Full blog post: https://t.co/pgXIXrMr2S
How big is the current AI bubble? UBS: This bubble is more “reasonable” than the TMT era, and the three peak signals have not yet appeared
UBS believes that although the current U.S. stock market already meets the seven preconditions of a bubble cycle, the “rationality” of the current AI bubble far exceeds that of 2000, and the key peak-out events have not yet appeared.
On October 29, the UBS Global Equity Research team stated in a report: “We are in the early stage of a potential bubble. However, the three core signals that herald a bubble peak—extreme valuations, long-term overheating catalysts, and short-term peak events—have not appeared so far.”
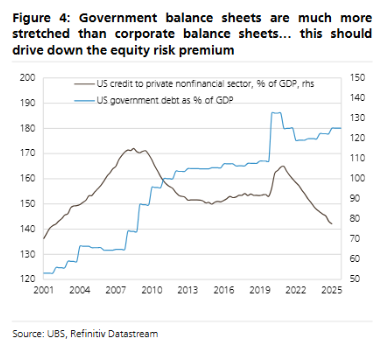
The report notes that the strong productivity-enhancing potential of generative AI and the fact that today’s government balance-sheet (fiscal) risks are higher than those of corporates provide a much firmer underpinning for valuation expansion now than during the 2000 internet bubble.
UBS says the market currently sees a 20% probability of a bubble forming and that reading the key signals that foreshadow a bubble collapse will be central to investment decisions going forward.
The ‘rationality’ of the bubble—why is this time different?
With the Fed cutting rates as scheduled in October, UBS believes the U.S. stock market already satisfies all seven “preconditions of a bubble”: a 14% annualized excess return of equities over bonds over the past decade, the emergence of a “major new technology,” 25 years elapsed since the last bubble, broad-based profit pressure, high market concentration, retail investor inflows, and accommodative monetary conditions.
Even so, UBS emphasizes that simply comparing today’s AI fervor to past bubbles is superficial. The formation logic of this bubble is more “reasonable” than the internet bubble or the late-1980s Japan bubble along two key dimensions.
First, the disruptive potential of generative AI and its unprecedented pace of adoption are unparalleled.
The report points out that because massive infrastructure is already in place, the adoption speed of generative AI is faster than any previous technological revolution. For example, it took OpenAI only three years to reach 800 million users, while it took Google nearly 13 years to reach the same scale.
If the market expects generative AI to temporarily lift productivity growth by 2%, as during the internet bubble, that alone would be sufficient to justify 20–25% upside in stock prices.
Second, the macro risk structure of this cycle is fundamentally different.
During the 2000 internet bubble, the U.S. government was running a budget surplus and public finances were very healthy. Today, however, the government debt-to-nominal-GDP ratio is twice as high, and the fiscal deficit is elevated. By contrast, corporate (especially big tech) balance sheets are relatively solid.
(UBS believes that the U.S. government’s balance-sheet position is far more fragile than that of corporates, which can lower the equity risk premium (ERP).)
UBS argues that this “weak government, strong corporates” configuration may lead investors to shift funds from nominal assets (such as bonds) to real assets (such as equities) to avoid sovereign credit risk, thereby lowering the required equity risk premium (ERP) and supporting higher equity valuations.
Bubble non-peak signal 1: Valuations have not yet reached extremes
According to UBS, historical bubble peaks usually come with extreme valuations, but valuations in today’s AI-related areas have not yet reached the danger zone.
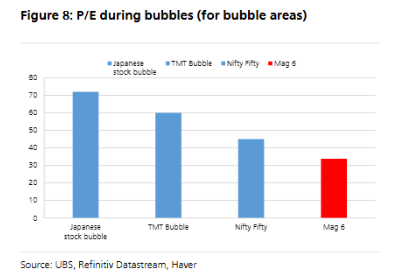
First, absolute valuation levels are still some distance away. In past bubbles, the P/E (12-month forward) of stocks accounting for at least 30% of market cap surged to 45–73x, and the 10-year Treasury yield reached at least 5.5%.
Today, the Mag 6 (the “Big 6” in tech excluding Tesla) trades at only 35x P/E, far short of bubble levels.
(P/E of the U.S. stock market during bubble periods)
Second, on a relative basis, the tech premium remains within a normal range. Historically, peaks tended to occur when ERP fell to around 1% (e.g., 1929, 2000).
UBS’s long-term model suggests the current ERP is still about 3%, indicating the market has not completely ignored risk out of excessive optimism.
In addition, the TAM assumptions are not “outlandish.”
At the peak of the internet bubble, justifying valuations of telecom stocks required assuming households would spend about 20% of income on telephone services—clearly unrealistic.
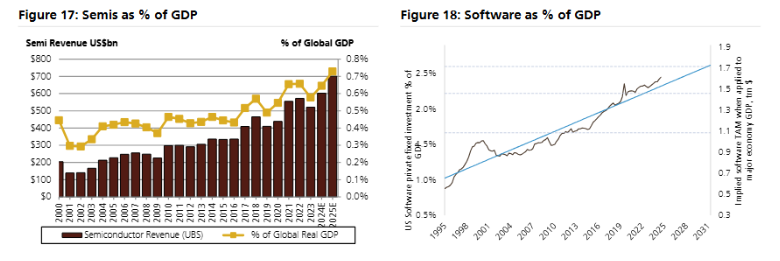
By contrast, for semiconductors, the core of this cycle, UBS estimates that if semiconductor industry spending accounts for 1.3% of global GDP by 2030 (versus about 0.7% now), current valuations are reasonable.
Considering the importance of semiconductors and software as the “new oil,” the combined GDP share of the two industries is currently about 3%. Oil’s historical average share is 3%, and its peak reached 10%, so this assumption is by no means unattainable.
Finally, the current investment logic has not detached from fundamentals. In Japan’s bubble era, land values drove stock prices; in the internet bubble, “eyeballs (traffic)” were the key metric. In contrast, today profits and cash flow remain the main basis for analyzing AI-related companies.
Bubble non-peak signal 2: Absence of long-term overheating catalysts
Beyond valuations, the long-term structural factors that trigger bubble collapses—over-investment and excessive leverage—are not yet evident.
The report emphasizes that signs of over-investment have not appeared. The U.S. ICT (information and communications technology) investment-to-GDP ratio is still below its 2000 peak and close to normal levels. This means a society-wide capex frenzy in the U.S. has not yet formed.
Excessive risk from debt financing is also low. While the capex-to-sales ratio of the 11 hyperscalers has approached the levels of telecoms in 2000, the financing mix is entirely different. Today’s big tech firms fund investments with robust internal cash flow and have low reliance on debt.
UBS calculates that, based on 2025 revenue, these companies’ capex would need to rise another 40% before they would even begin to use debt financing. This stands in stark contrast to the internet bubble era, when telecoms’ net-debt-to-EBITDA reached 3.5x.
(Capex-to-sales ratio of large cloud companies)
Market breadth narrowing is also not as severe as in 1999. Back then, the Nasdaq surged 86%, yet the number of declining stocks nearly doubled the number of advancers, and the market exhibited extreme bifurcation. While breadth has narrowed today, such extreme divergence is not observed.
Finally, U.S. corporate profits are unusually resilient. During the internet bubble, profits on a National Income and Product Accounts (NIPA) basis actually fell, explaining the sharp deterioration in breadth at the time. Today, while profit growth is concentrated among a few large firms, there is no similar pressure visible in aggregate NIPA profits.
Bubble non-peak signal 3: No short-term peak event
In the short term as well, the “triggers” that herald market tops have not fired. UBS lists three potential peak triggers:
Mega M&A:
The peak of the internet bubble coincided with “deals of the century” such as Vodafone/Mannesmann and AOL/Time Warner. Adjusted to today’s market size, these transactions would total around $900 billion. No M&A wave of comparable magnitude has appeared in the current market.
A fatal blow from central bank policy:
Historically, bubbles have only suffered fatal blows when the Fed’s policy rate exceeded nominal GDP growth. In 2000, the Nasdaq doubled even during a rate-hike cycle, but when the policy rate rose above 6% (near nominal GDP growth at the time), the market topped.
Currently, nominal GDP growth for 2026 is expected at 5.2%, and monetary policy is not yet tight enough to “choke off” growth.
Earnings-momentum slowdown and extreme price momentum:
In the internet bubble, earnings momentum peaked about a year before the market top. By contrast, earnings revisions (upgrades/downgrades) for tech remain superior to the market today.
At the same time, price momentum is not at extremes. For example, semiconductor stocks are currently about 35% above their 200-day moving average, whereas at the 2000 peak this metric reached 70%.
In sum, UBS’s analysis provides investors with a detailed “bubble map.” While the AI boom is intense, looking across the key indicators—valuations, macro catalysts, and short-term triggers—the festivities likely are not over yet.
That said, UBS warns that the real bubble may be hiding in the high margins of tech sectors, especially semiconductors. As capital intensity rises and competition intensifies, those high margins could come under pressure in the future.
I’ve thought about this too.
My conclusion is that the architects of American Empire spent so much energy obscuring reality that their heirs believed the illusion.
The heirs think the postwar US is still a “democracy” or a “country” rather than the greatest empire of all time. And that it can somehow return to the prewar state without a huge decline in living standards.
But, obviously, this is not the posture of a people that merely wanted to sit humbly behind their own borders:
According to the Social Security database, these are the numbers of people in each age bucket with the death field set to FALSE!
Maybe Twilight is real and there are a lot of vampires collecting Social Security 🤣🤣
You need strong core muscles to maintain good balance, prevent back injuries, and live a long, healthy life.
7 exercises to build core strength and stability from home: