THIS IS F**KING DANGEROUS
I GAVE CLAUDE ACCESS TO OPTIONS FLOW, ORDER BOOK DATA, AND GAMMA WALLS — AND IT STARTED CALLING LEVELS BETTER THAN I DO
not a chart with two moving averages. not a “buy the dip” alert. this is a full institutional desk compressed into one AI session
here’s what’s on the screen right now:
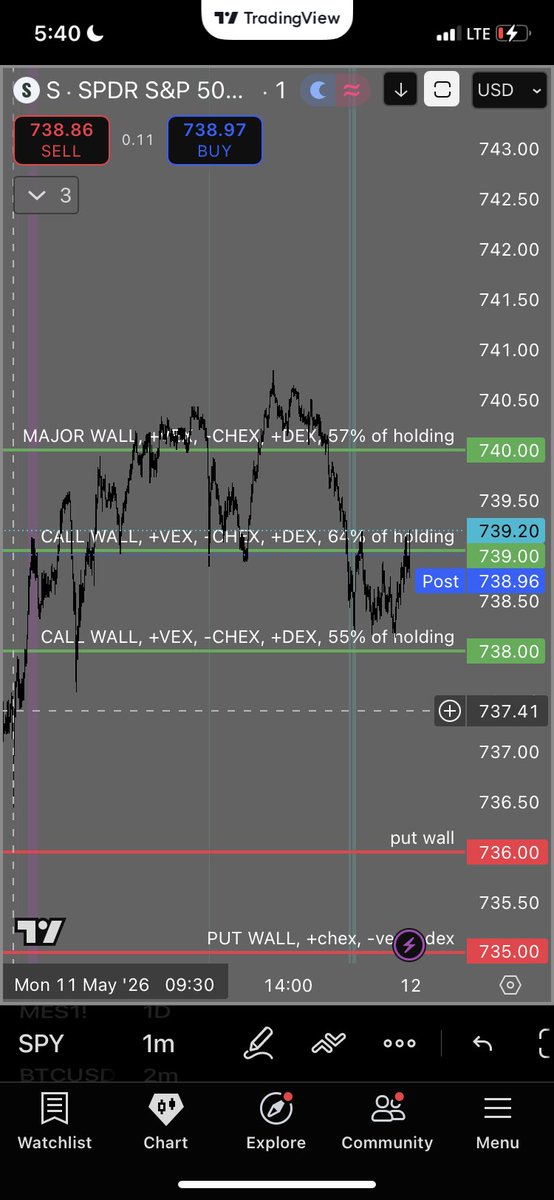
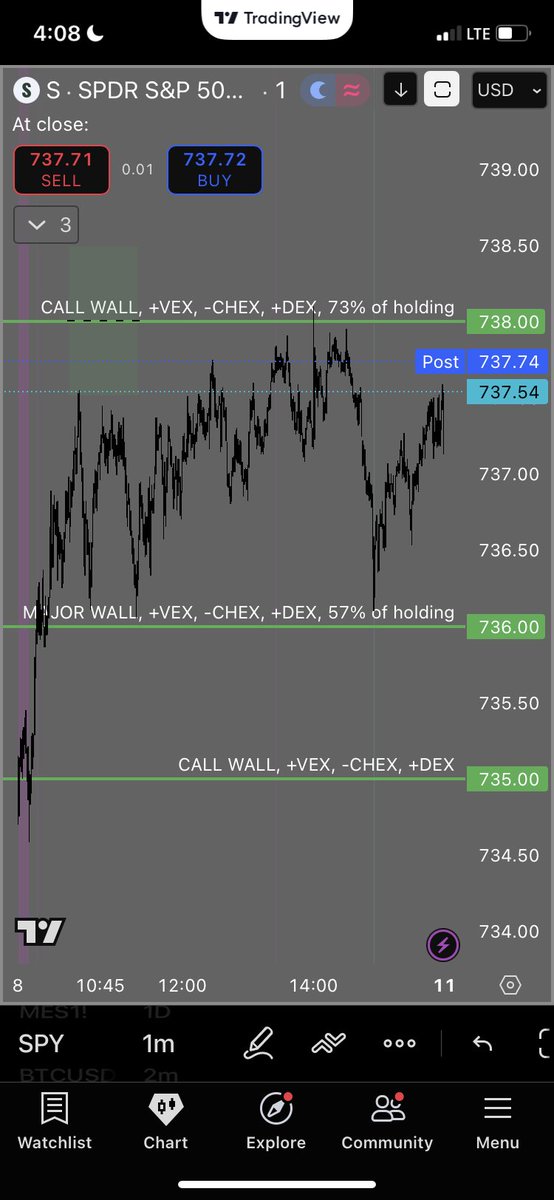
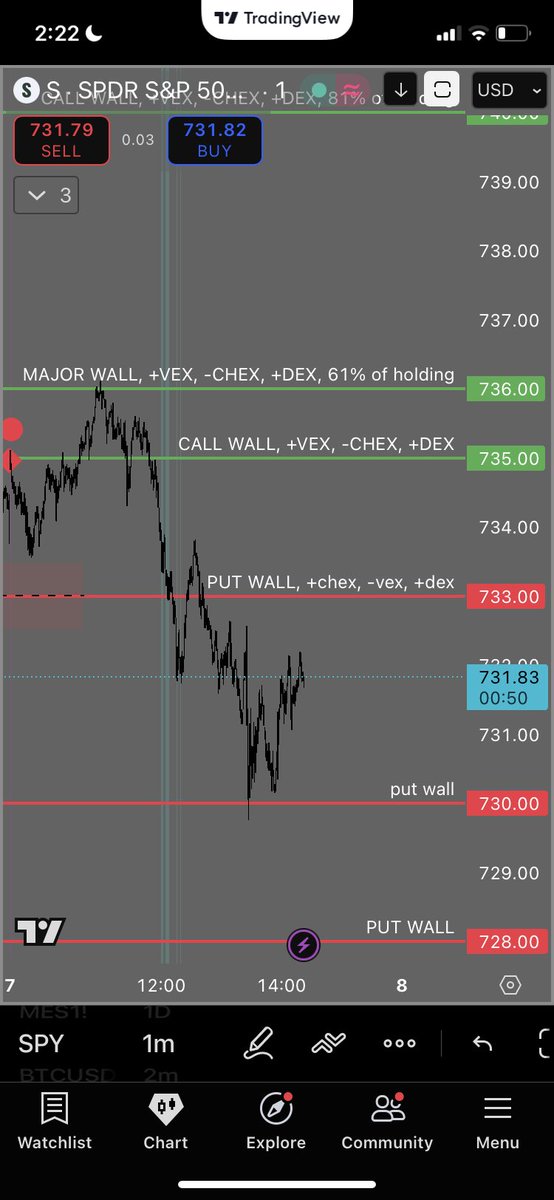
→ GEXRadar pulling Gamma Exposure across 44 strikes in real time
→ Delta Exposure flipping between bars and candles showing where dealer hedging shifts
→ Major Walls: call wall at $700 with +276M, put wall at $691 with -97M
→ Hedging Pressure gauge sitting at 48/100 — neutral, dealer flow balanced
→ Net Drift tracking $19.93B in calls against $32.39B in puts — put dominated
→ IV Surface Analysis rotating in 3D showing where volatility is mispriced by strike and expiry
→ MotiveWave footprint printing every bid and ask at every price level, tick by tick
→ DOM ladder on MNQ futures with live bid/ask stacking — 29,103.75 ask, 29,103.50 bid
Claude reads all of it
not the chart — the structure underneath the chart
gamma exposure tells it where dealers are forced to buy or sell. delta exposure tells it which direction the hedging pressure is building. the wall map tells it where price stalls. the footprint tells it whether the move is real volume or just air
entry: 1 contract MNQ at 29,054.75
TP set: 29,178.25
P&L climbs → +$64 → +$146 → +$167
the trade wasn’t a guess. the call wall at $700 held, hedging pressure was neutral, gamma flip sat at $698, and the footprint confirmed buyers absorbing every offer at the 29,050 level
Claude saw the wall. saw the flow. saw the absorption. and said: this is the entry
tested this setup with $100 starting capital — ended the session at $3,153
that’s not leverage doing the work. that’s an AI reading options structure, order flow, and gamma positioning simultaneously — something no human can do across 44 strikes in real time
you’re still drawing trendlines
Claude is reading the market’s skeleton
save this — the full setup and session walkthrough is in the article below ↓