@FefeDemeny That's a great explanation! I have a q: when you are disciplined and did proper risk management and you know you gonna risk 1%, what is better bigger capital in trade without leverage ($10,000 1X) or smaller capital with bigger leverage ($5,000 2X etc.)?
@FefeDemeny Not spending the time for proper education, lack of self-confidence in cutting off profits too early and holding losses too long, afraid of putting bigger margins in "solid" trades (those I believe in)
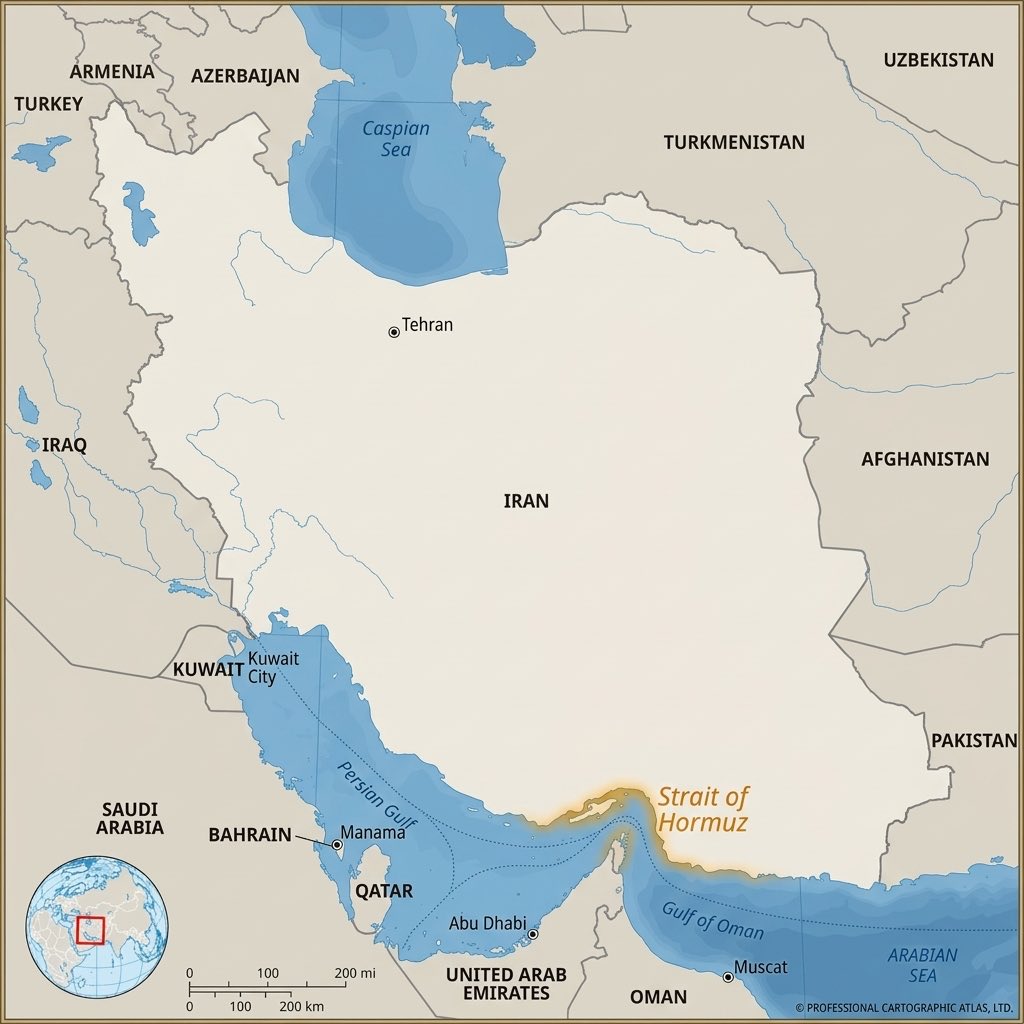
Citrini Research sent an analyst to Oman with $15,000 in cash, recording sunglasses, a smuggled camera, and Cuban cigars for networking. The analyst signed a pledge to Omani authorities not to gather intelligence, then got on a boat and sailed to within 18 miles of the Iranian coast. What he saw contradicts every headline about the Strait of Hormuz being closed.
Approximately 50 percent of tanker traffic in the strait is missing from public AIS tracking systems. The vessels are not missing because they sank. They are missing because they turned off their transponders, spoofed their GPS coordinates to broadcast false positions, duplicated the identity codes of decommissioned ships, switched to low-power transmission mode, or swapped identities with nearby vessels. The result is an electronic fog through which physical ships move crude to Asian ports while the tracking systems that Bloomberg terminals rely on show an empty waterway. More than $3 billion in crude has been transported through the strait since the war began, primarily to China, much of it under Iranian terms, paid in yuan or cryptocurrency.
The strait is not closed. It is filtered. Iran decides who passes and who does not. Ships that pay the IRGC toll and accept escort through the Larak corridor transit under the electronic fog. Ships that refuse are turned away or attacked. The “closure” that drove Brent to $115 and Aramco’s OSP to a record $19.50 premium is a selective blockade operating behind spoofed transponder data that makes it look total when it is not.
Brent dropped from approximately $115 to the $108 range as the report circulated. The market had priced in a complete shutdown. The reality is a controlled chokepoint generating toll revenue while maintaining the appearance of total disruption to maximise the scarcity premium on every barrel that gets through. Iran is running two operations simultaneously: a blockade for the cameras and a toll booth behind the blockade for the revenue. The opacity is the product. The fear is the markup.
The techniques are not sophisticated. Going dark requires flipping a switch. GPS spoofing requires a $500 device injecting false coordinates into the transponder’s GPS input. Identity theft requires typing a different MMSI number into the AIS configuration screen. Low-power mode requires switching from 12.5 watts to 1 watt. These are not state-level cyber operations. They are the maritime equivalent of turning off your phone’s location services. The ghost fleet runs on technology any ship’s officer can deploy in minutes.
The 50 percent blind spot means every estimate of Hormuz disruption based on public AIS data, every IEA shortfall calculation, every Goldman Sachs supply model, and every insurance premium derived from vessel tracking is working with half the picture. The other half is sailing in the dark, loaded with crude, headed for Chinese refineries, paying the IRGC in the currency of the country that ships sodium perchlorate to fill the missiles that the same IRGC fires at Israeli cities.
The strait the world thinks is closed is open for business. The price of admission is invisibility. And the entity collecting the toll in yuan while demanding war compensation in the ten-point response is profiting from the blockade it claims is absolute, selling passage through the chokepoint it says will “never return to its former state,” and funding the war with the revenue from the peace it refuses to sign.
https://t.co/dAOBBMsgDS
A bounce is coming, sooner than you think — here is why...
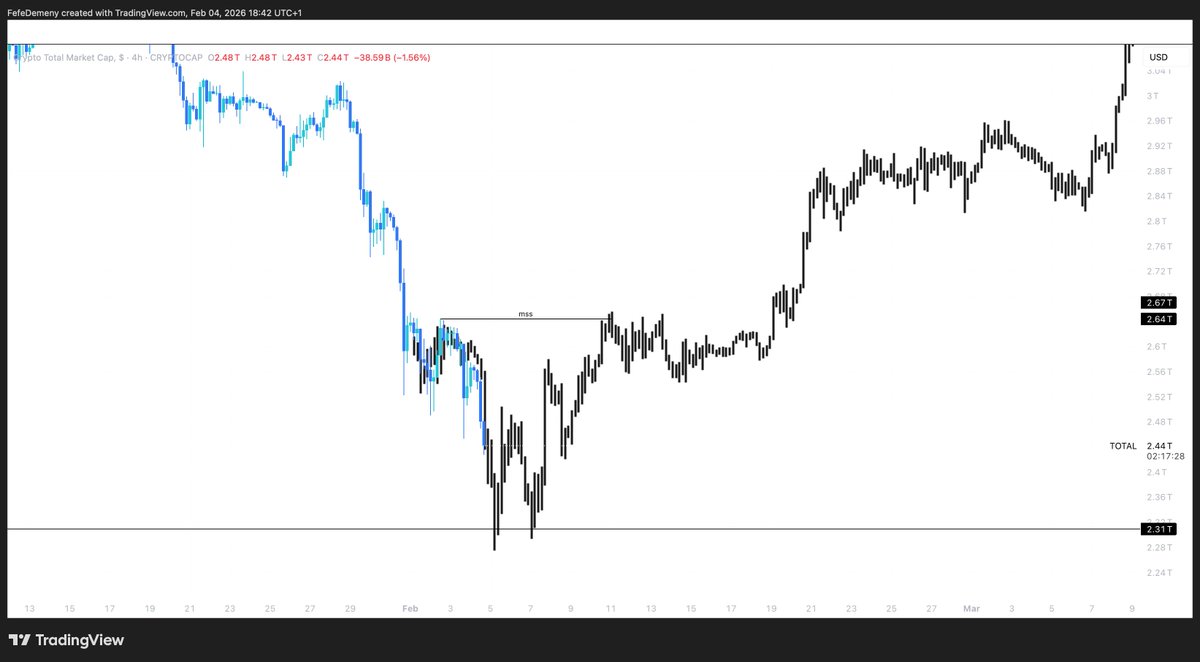
The discrepancy between these two charts tells you everything you need to know
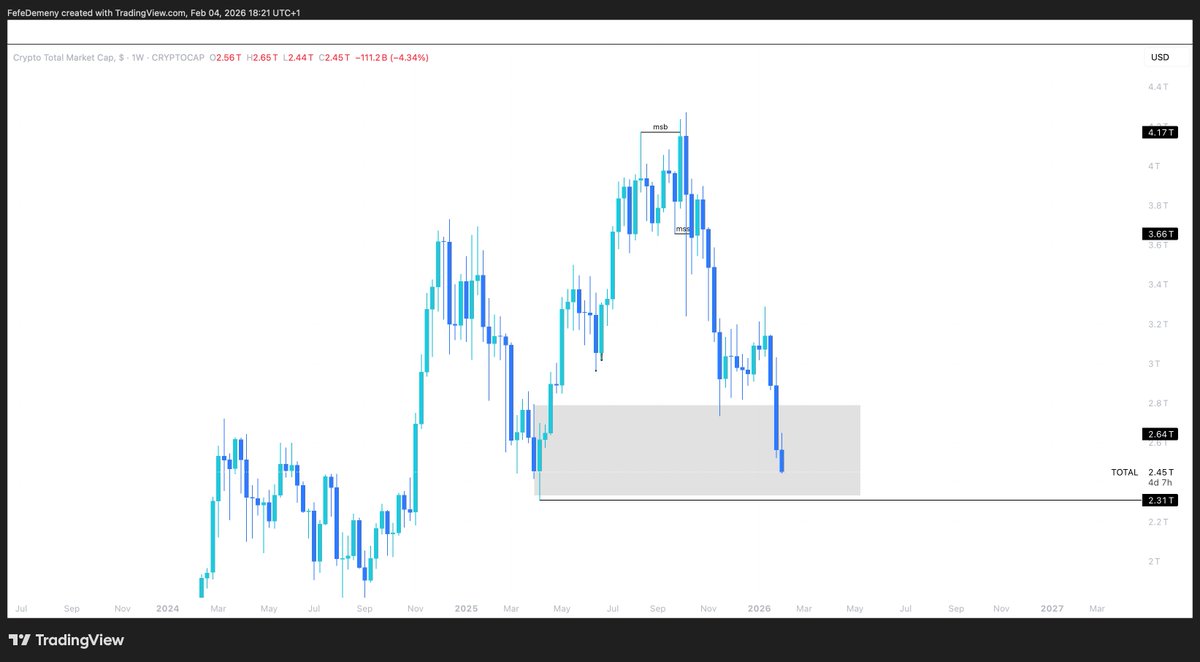
The weekly TOTAL Crypto Market Cap chart is going into a very strong weekly demand zone
This demand zone was formed in April 2025 and has added $2T to the crypto market cap.
This is a very clear retrace and a high probability textbook long setup on a high timeframe chart
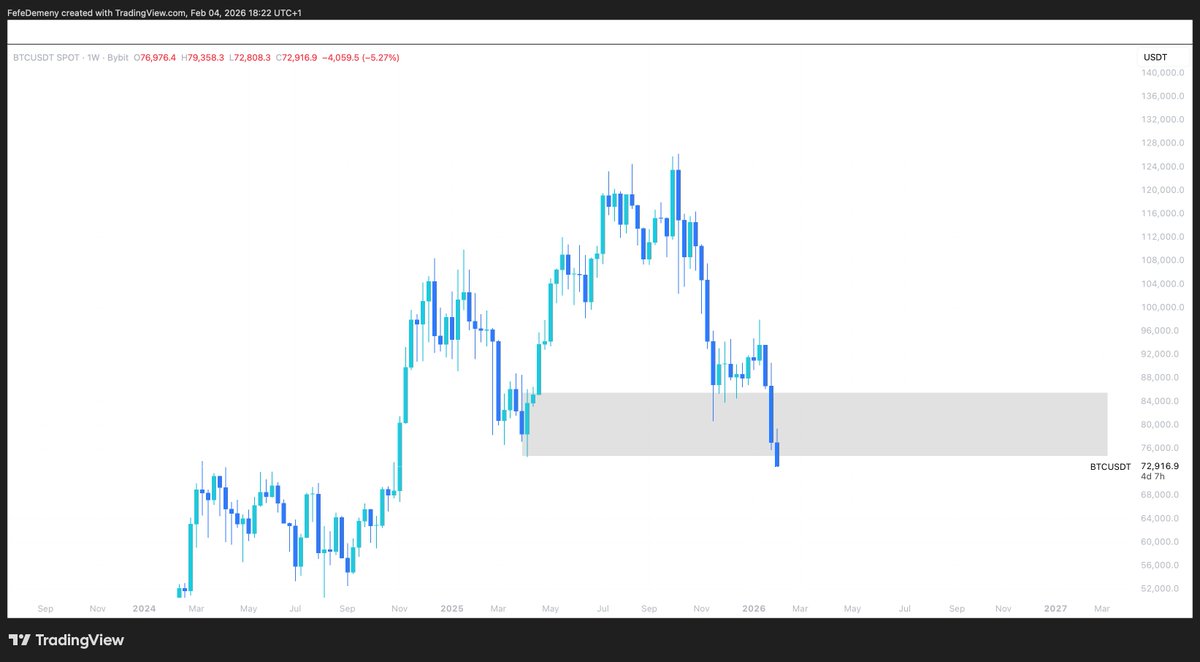
The Bitcoin weekly chart had a similar setup, yet failed to hold the bottom of the weekly demand zone, the level that took Bitcoin from $73K to ATH.
Based on my experience, this is nothing else but a trap for retail traders to analyse bitcoin, panic sell on a weekly break, then buy back on the complacency bounce that's coming just to be flushed yet again.
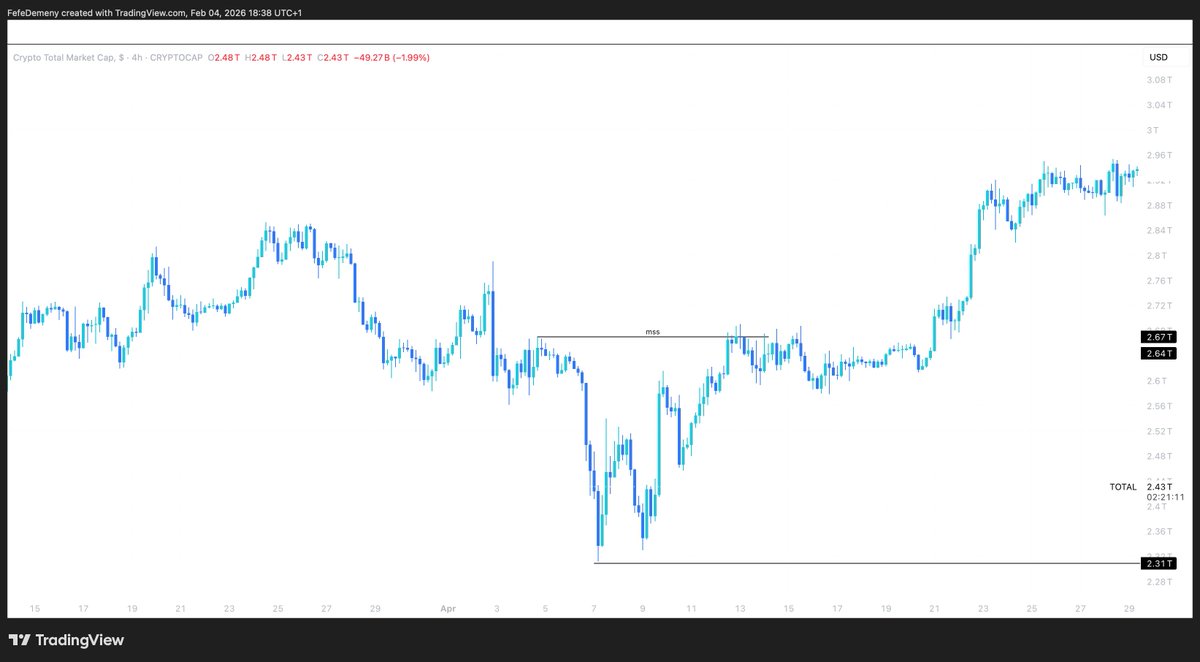
This was the 4h bottom formation of the TOTAL Market Cap in April 2025:
Overlaying this bottom formation to the current chart, it becomes clear what to look for to time the beginning of the complacency bounce:
Don't f**k this up.
🚨BREAKING: Thousands of Venezuelans are waking up and celebrating the news of Communist dictator Maduro being captured by US forces
The Legacy Media won't show you this.