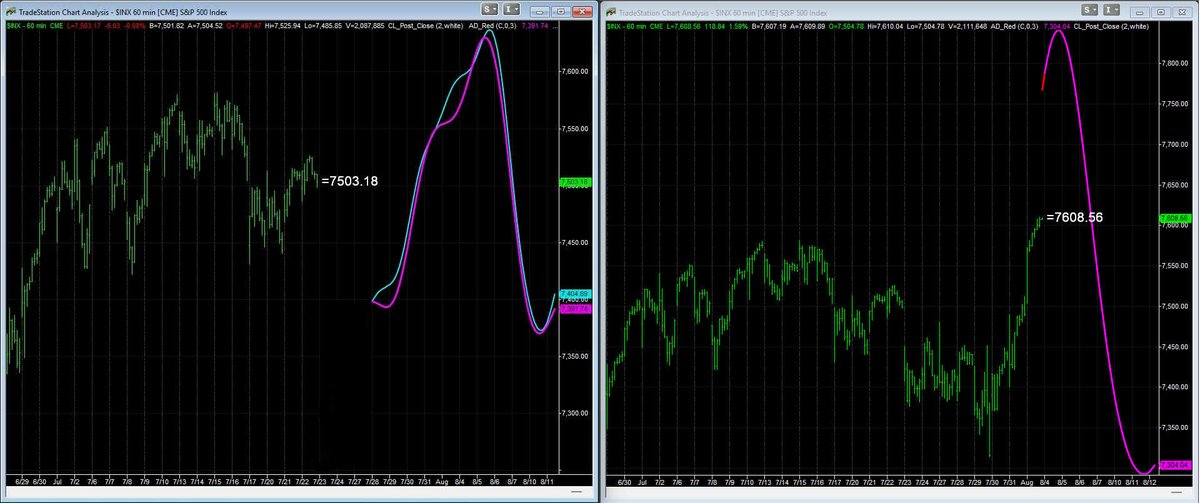
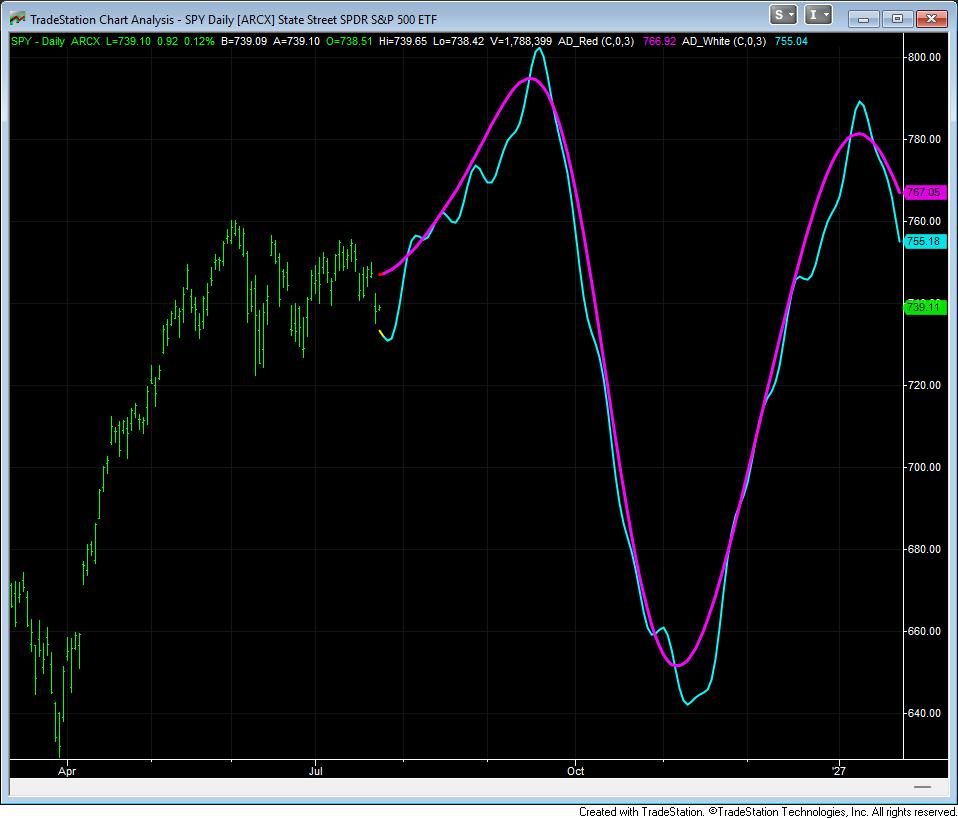
Right hand side shows the projection calling for a low on 3.30 and the subsequent rally into a high on 5.29. Made on 3.25.2026. Left hand side shows the subsequent price action up until 7.28, where it made a new projection in yellow.
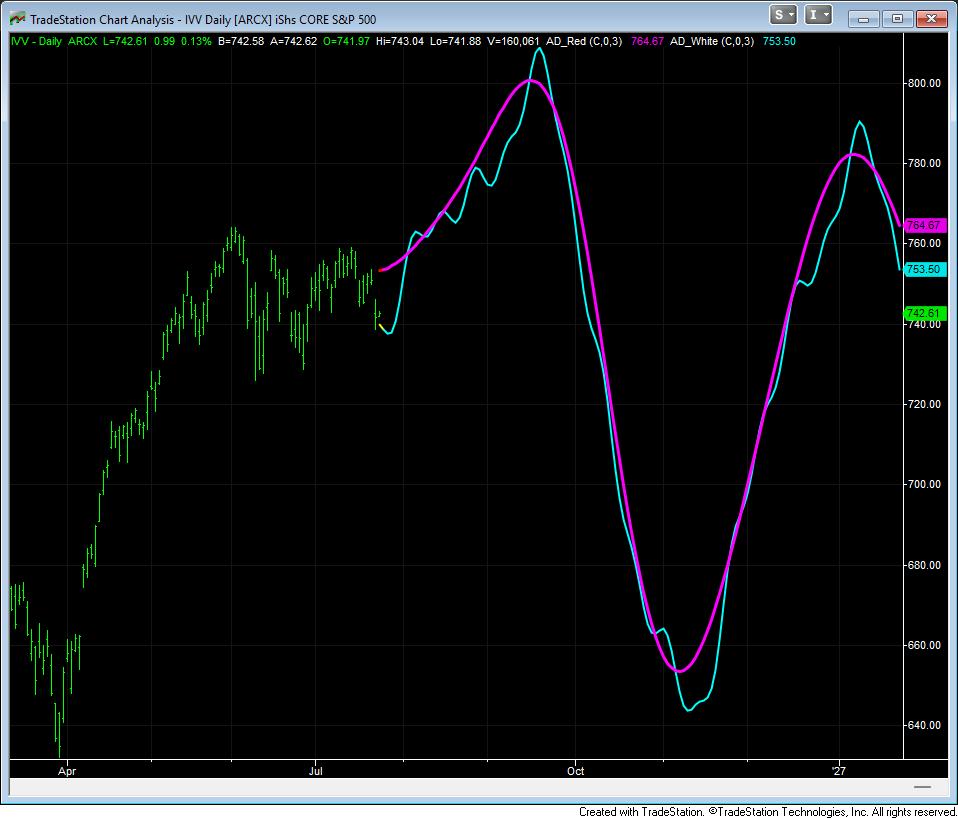
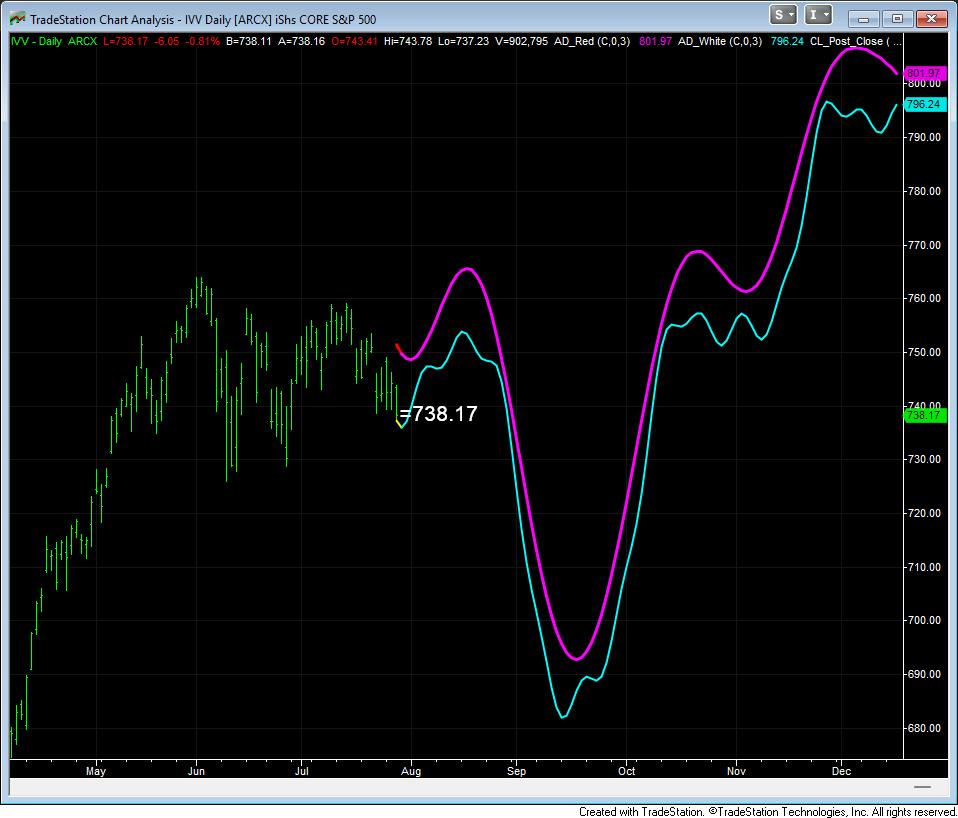
This popped up out of nowhere (1 of 6 daily charts. None of the others shows anything like this.). 1st half of it can be Avi's triangle. 2nd half (after the drop into Sept.) does not match any of the EWT analysts' charts. Something to be aware of but let's see how it develops.
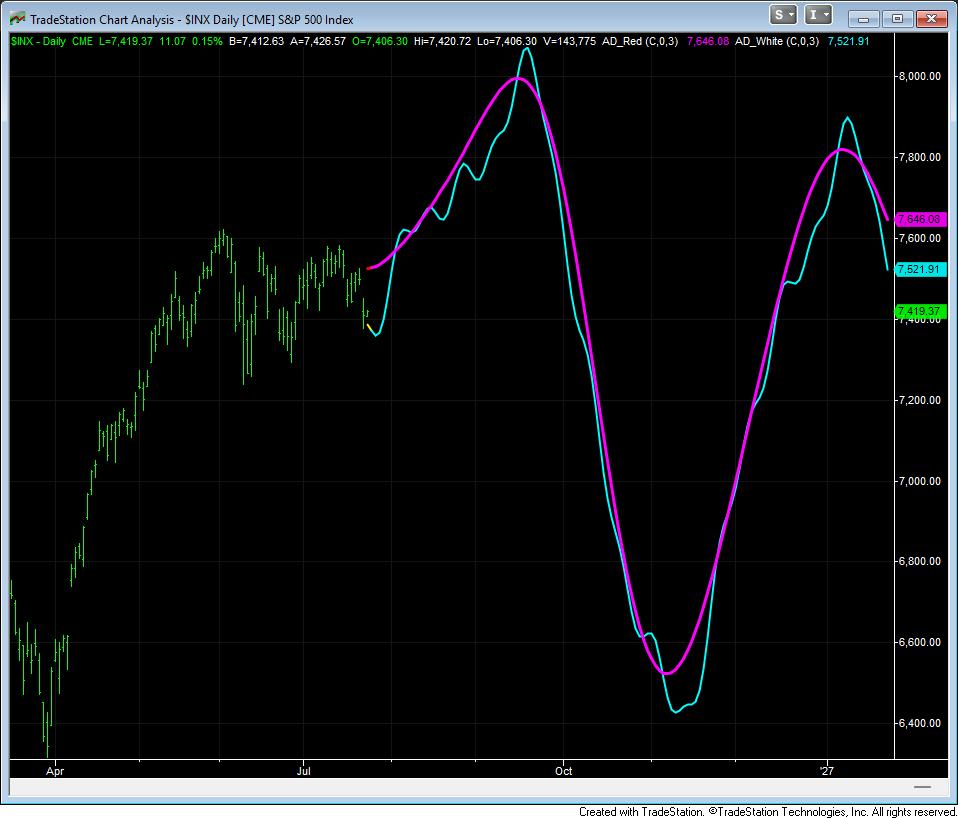
My interpretation of these Daily charts is that there could be a lot of shenanigans between now and election day. I'm thinking of it a correction in time instead of prices. And then think of the Santa rally as the rally that compensate us for this fustration.
Wrote too soon. Avi has revised his wave counts and move his D wave to today's low. But my projections remains the same....projections above fits Da Professeur's 3rd path.
Ok, this projection fits the premise I've been operating under since April - trading range until the middle of August, then a breakout to ATH in Sept., drop into the election, then a Santa rally. Again, ignore the price scale and use the EWT team's expertise for pricing.
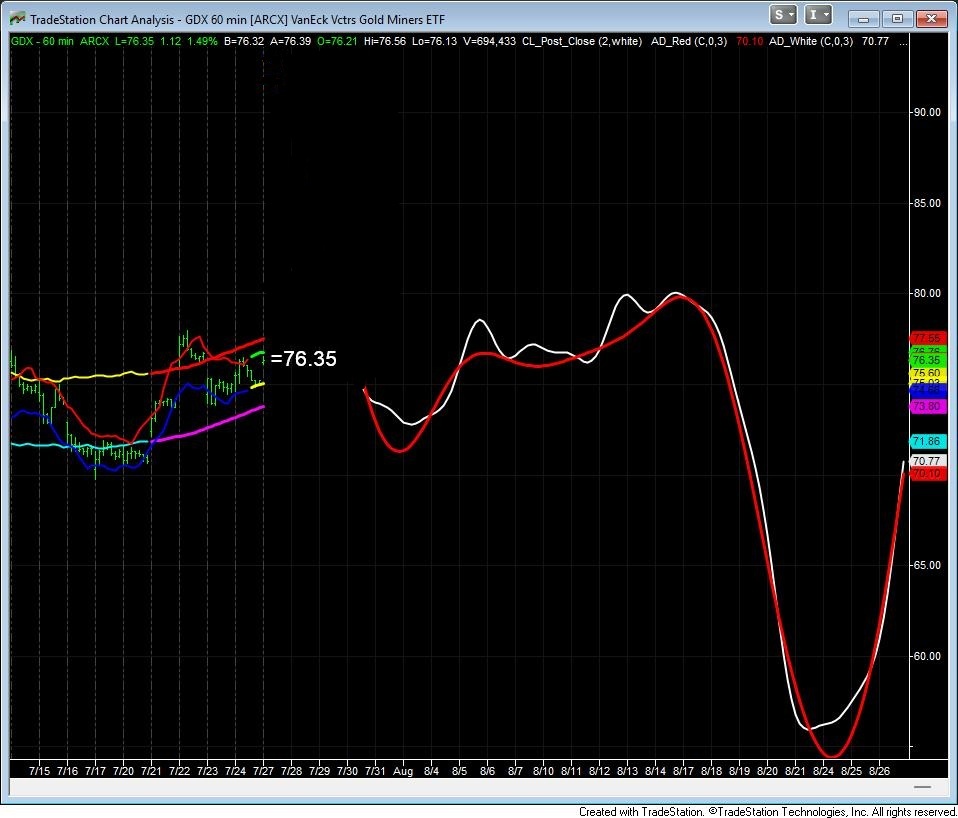
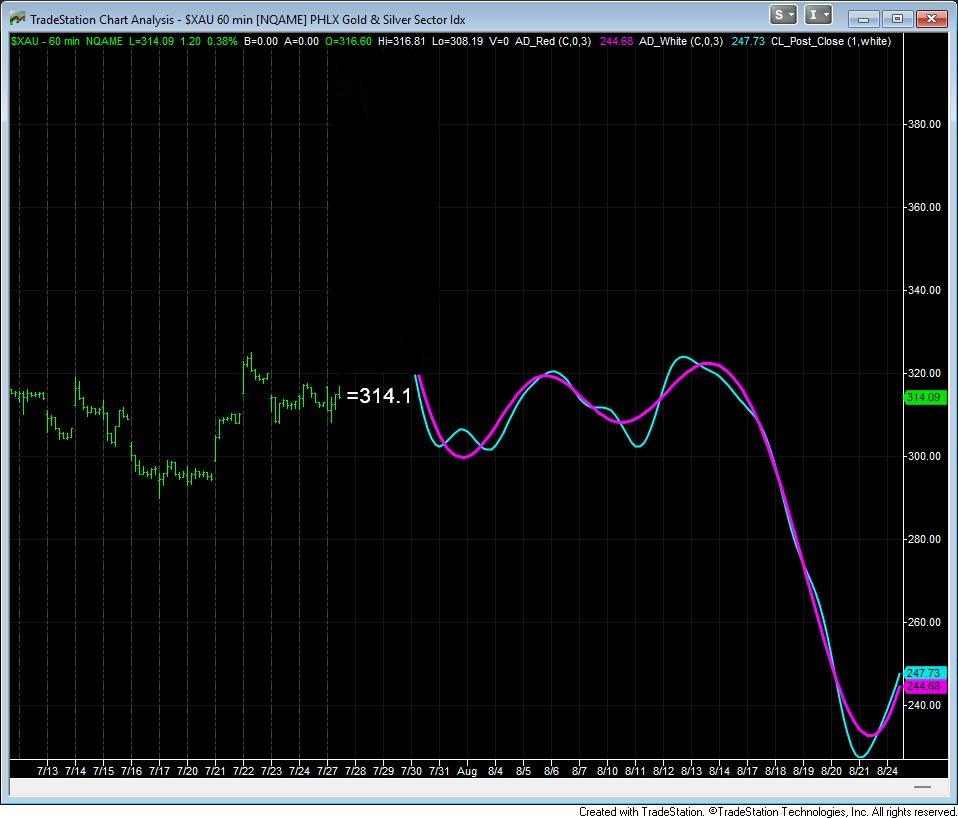
I think you guys should read what Da Professeur wrote in his Daily Thoughts regarding GDX. My projections is liking his path 2. Add in Avi's daily chart on GDX with his yellow alt count in mind....
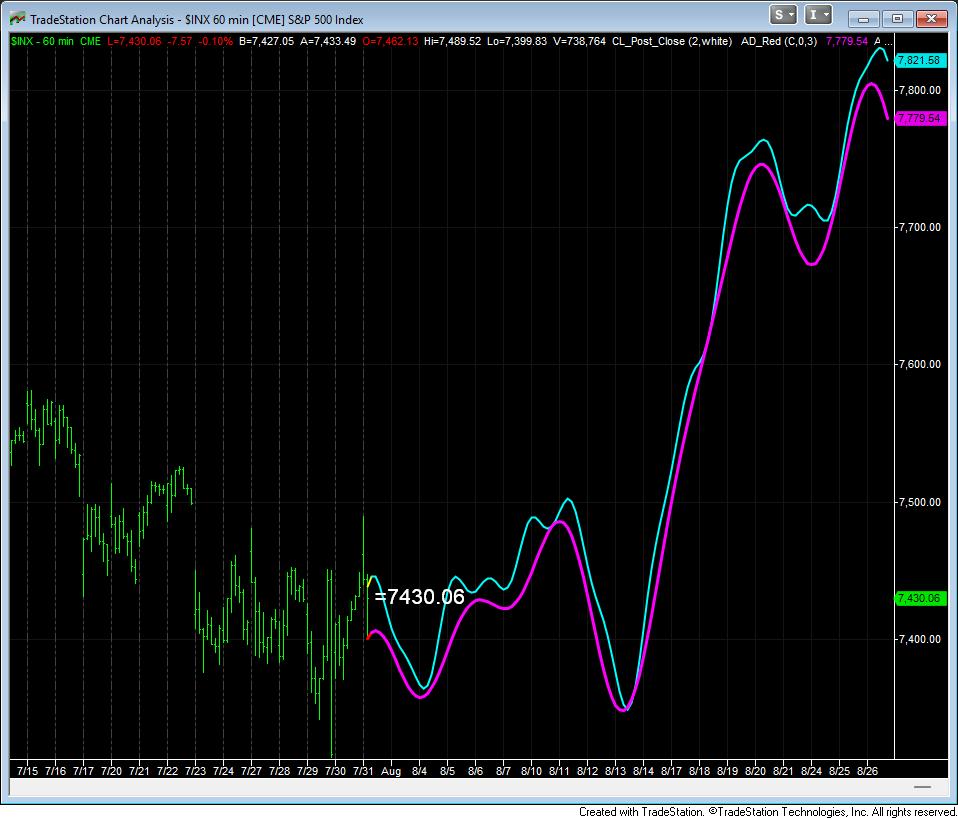
@tguinall One thing the projections cannot "predict" is prices, ie the magnitude of moves is unpredictable. It could be that the low might be 5 SPY points lower or 50 SPY lower. If a low shows up on 30th / 31st, it could be an opportunity to enter for the ATH attempt in Sept.
Looks like we're going to attempt another break out towards new ATH in the middle of Sept. Previous iteration has us in a trading range until the middle of August, then breakout to new ATH in the middle of Sept, then tank into the election. Perhaps we're going to start early.