Very important $BTC update :
Bitcoin saw a fast 10% dump in just 2 days, and now on the 1H chart, price is trying to stabilize near 83K. The important part is not the bounce itself, but what Open Interest is doing alongside price.
After the dump, Open Interest is continuously going down, while price is moving sideways to slightly up.
This clearly tells us that the move down was driven more by liquidations and position closing, not by aggressive new short positions.
In simple terms:
Price ↓ + OI ↓ = leverage flush
Weak hands are getting out
Bears are not confidently adding new positions
This is why, even after a sharp dump, price is not continuing to free-fall.
From a trader’s perspective, this is not the zone to chase trades.
What smart traders should wait for:
Monthly close first (very important after such a big move)
Clear price acceptance above a short-term level, not just a small bounce
OI stabilization, followed by OI rising with price (shows real participation)
A clean structure shift on lower timeframes
** As long as price goes up but OI keeps falling, the move is likely just a relief bounce, not a strong trend reversal. **
This looks like a leverage reset phase, not confirmed bullish or bearish continuation yet.
Patience here is an edge.
Let the market show strength first and react, don’t predict.
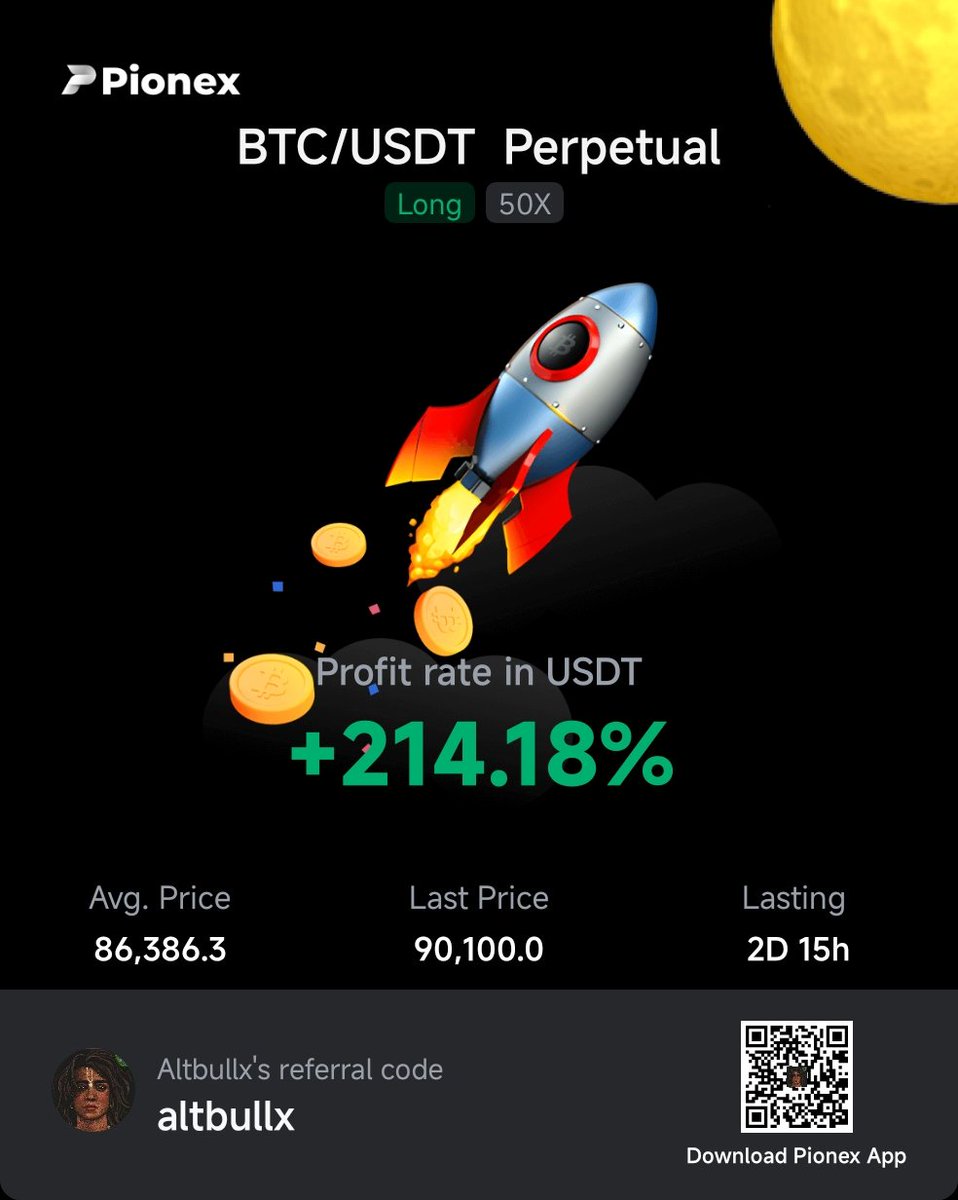
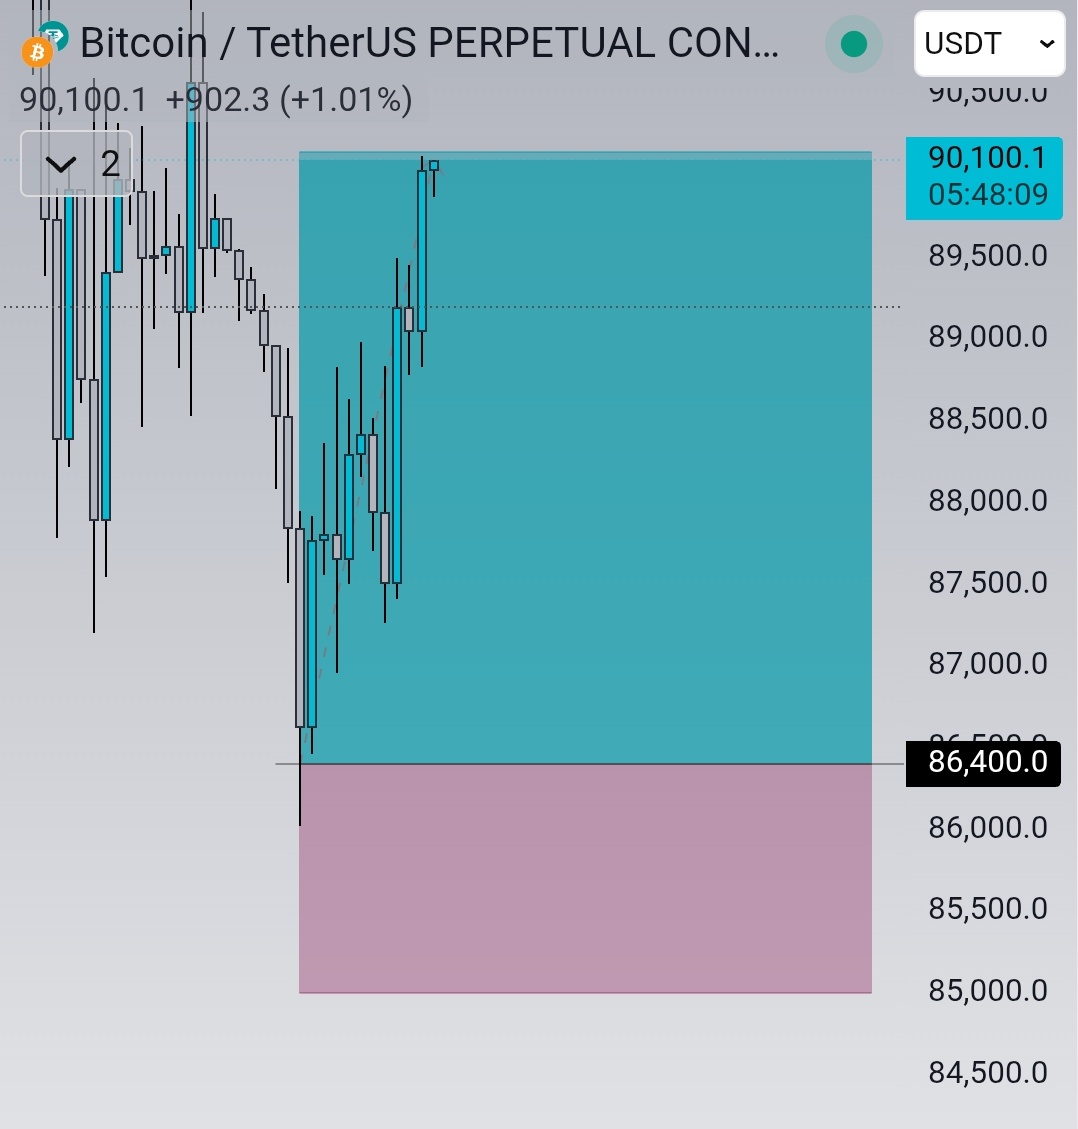
After 2 days final Target ( 3R )hits for our $BTC long 🎯
Trade is fully closed now in great profits 💰 💰
Everything was shared publicly live on X with full transparency as always ✅️ ✅️
Trading against the crowd is my favorite confluence 😉
If you really want to understand why Bitcoin moves, why alts pump or bleed, and when money goes to usdt you must understand Dominance.
Let's understand crypto dominance in very simple words 👇
1. What is Total Crypto Market Cap?
Total crypto market cap = total value of all cryptocurrencies combined.
When total market cap goes up, money is entering crypto.
When it goes down, money is leaving crypto.
This tells us the overall health of the crypto market
2. Bitcoin Dominance (BTC.D)
Bitcoin Dominance shows how much % of total crypto money is in Bitcoin.
BTC dominance up indicates money is moving from alts to Bitcoin
BTC dominance down indicates money is moving from Bitcoin to alts
📌 Important:
BTC dominance up + BTC price up = Bitcoin leading the market and altcoins bleed
BTC dominance down + BTC price stable = Altseason starting
3. USDT Dominance (USDT.D)
USDT dominance shows how much money is sitting in stablecoins.
Think of USDT as cash on the sidelines.
USDT dominance up indicates people are selling crypto
USDT dominance down indicates money is flowing back into crypto
📌 important :
USDT.D up = fear
USDT.D down = buying phase
4. Others Dominance (OTHERS.D)
Others dominance = all altcoins except Bitcoin & Ethereum.
This is where real altseason happens.
Others dominance up, small & mid caps are pumping
Others dominance down, altcoins bleeding
📌 If:
BTC dominance falling
USDT dominance falling
Others dominance rising
👉 That’s the perfect altcoin environment
5. How Dominance connects with Price Action
Dominance doesn’t predict price, it explains money flow.
Price shows movement
Dominance shows direction of money
That’s why:
BTC pumps first
Then ETH
Then large caps
Then mid & small caps
It’s capital rotation.
- Most people watch charts only.
Smart traders watch where the money is going.
Price is the result, Dominance is the reason.
Okay I closed my $BTC short fully at 4R 💰
All my trades I share publicly with fully transparency ✨️
No greed, great profits✌️
Press like and repost If you like my work because it motivates me.