We haven't posted here in a while, and we don't plan to start up again anytime soon. If you need to get in touch with us, follow the link in our profile.
If you want to keep up with the great things we're working on, subscribe to our blog: https://t.co/b8sBfMygOB.
‘Blue Energy’ is a promising form of sustainable power that utilizes tidal wave action to generate electricity. Read how a researcher is using Surfer to identify the ideal site locations for 'Blue Energy' machines at the link below!
Learn more: https://t.co/BDLLoVeqgu
Are you looking for a long-term monitoring solution? Grapher could be the software for you! An engineering firm is using Grapher to monitor stray current and corrosion of public utilities in the American Mountain West. .
Read more: https://t.co/vIhkprBv7j
The most important part of mapping and modeling is being able to share the final output with clients. Watch below to learn how scientists and engineers can now create easily shareable files that can be customized outside of Surfer!
Watch now: https://t.co/QsJQkU5vEo
"We use Surfer to map the stresses around the structure…to help the engineers figure out why one part is sinking, and another is swelling"
Click below to learn how an engineering firm pinpoints structural weakness with Surfer.
Read now: https://t.co/EUrY9rgzc7
The latest video in our Surfer New Feature video series demonstrates how you can narrow your area of focus using Image Slices! Visualize changes along a transect and create Fence Diagrams using the new 3D Image Slice functionality.
Watch now: https://t.co/0eR03CNAla
#geophysics
A new version of Surfer also means new features in Surfer Beta!
Read about the new Block Render visualization and the ability to add georeferenced imagery in the 3D view to create stunning models at the link below.
https://t.co/qcHs39I6Nd
#surfermapping#3dviz#3dmodeling
A new version of Surfer has arrived! This release provides users with more ways to analyze their 3D data sets and extract important information.
Take a closer look at Surfer's evolving 3D modeling capabilities here: https://t.co/RJ6a2lkGFa
Tired of juggling complex projects? Mapping software can help, but there are a lot of options out there.
We've compiled a list of the top features you should look for when purchasing software to communicate findings.
Read now: https://t.co/niSeXS3ai7
#environmental
3D modeling software can be expensive and serve a hyper-specific purpose. With Surfer you can spend less time jumping between programs and create the 2D & 3D figures you need in one place.
Read more now: https://t.co/z51HH9LPW0
#surfermapping#3dmodeling
500+ Scientists and engineers registered for our March webinar Create Interactive 3D Site Models with Surfer!
Follow the link below to watch the recording and download the data today.
Watch now: https://t.co/GNTWH7RCmu
#surfermapping#webinar#3dmodeling#environmental
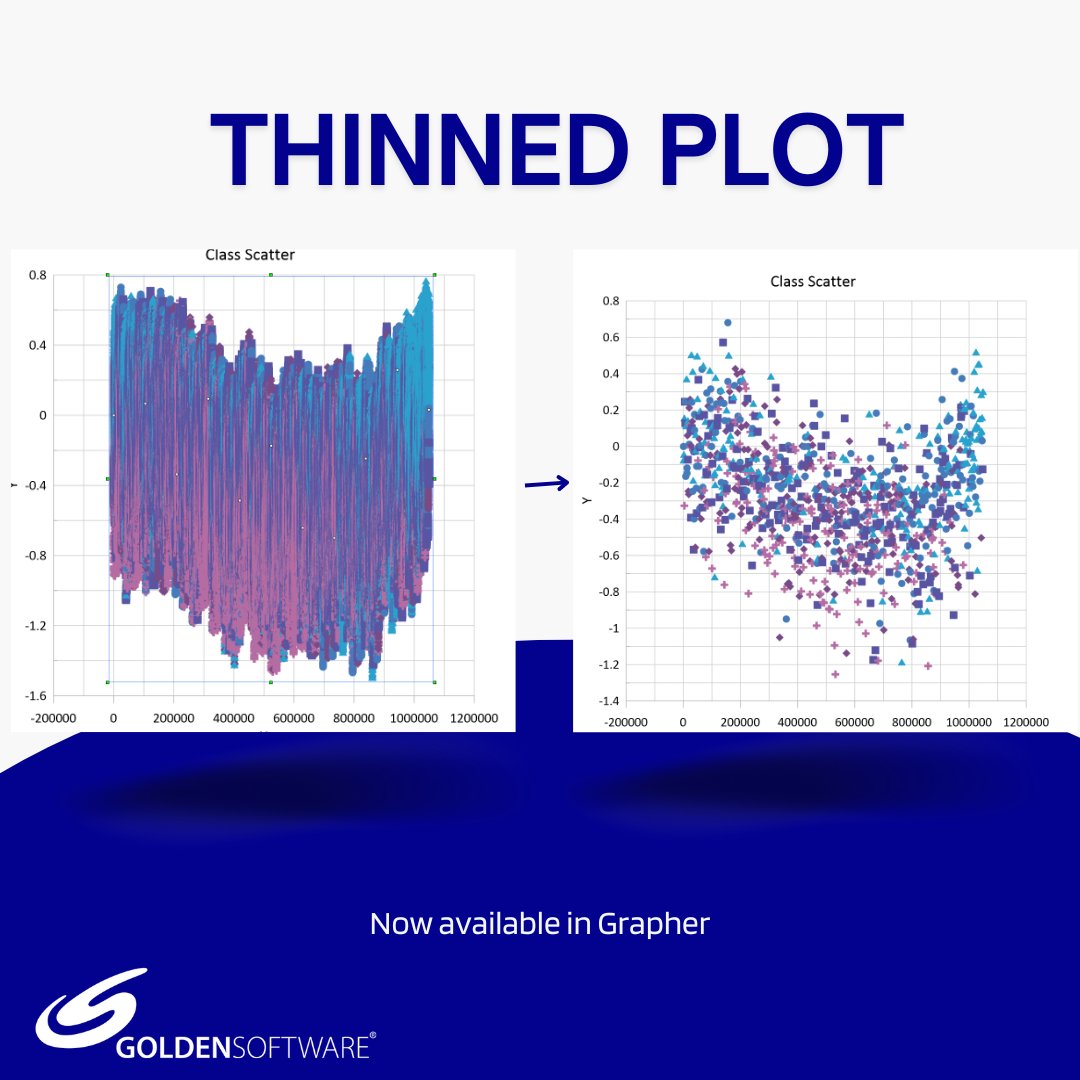
Have you updated to the latest version of Grapher? Read our blog detailing how the latest features can help scientists and engineers communicate data more intuitively!
Read now: https://t.co/7WNB5e4clh
#datavisualization
A new version of Grapher is now available!
"Our goal with the latest iteration of Grapher is to improve the overall user experience through redesigned functions and a more intuitive interface.” - Santiago Vivas, Grapher Product Manager.
Learn more: https://t.co/xjRlEtc4Qk
The last video in our Surfer New Feature video series is here! With the Z value slice slider scientists and engineers can now take clients on a journey through the depths of their data.
Watch now at the link below:
https://t.co/2xFUu8V5n9
#surfermapping
Along with the latest Surfer release there is a new version of Surfer Beta!
Surfer Beta expands on Surfer's 3D functionality with image slices, which show how data changes along survey lines.
Learn more about the new features in Surfer Beta today: https://t.co/vXZgll8r52
Are you curious about the new 3D modeling features added to Surfer? Do you want to see them in action before committing to an upgrade?
Join us March 14/15 for our latest webinar, "3D Volumes: A New Dimension in Surfer Gridding"
Sign up now: https://t.co/spekC0wRHF
Check out the latest video in our Surfer New Feature video series! Visualize a 3D grid as a rendered volume or isosurface. Helping you create 3D models that clearly demonstrate the extents of a contamination plume or mineralization cutoff.
Watch now: https://t.co/3HPpF78bWO
The love for the new features in Surfer's latest release keeps pouring in! Have you had a chance to try out the new 3D gridding and visualization features yet?
Read our blog detailing the latest and greatest in Surfer: https://t.co/nNYryRj3pY
#surfermapping