I recently discovered the correctR package by Trent Henderson. correctR is designed for the statistical comparison of machine learning models on correlated samples. This R package addresses the limitations of traditional tests like the t-test, which often underestimate variance due to assumptions violated by methods such as data resampling and k-fold cross-validation.
correctR uses corrected test statistics to compare the performance of two models where samples are not independent. This makes it a valuable resource for researchers and practitioners in machine learning, ensuring more accurate comparisons and better decision-making.
For more details, visit this page: https://t.co/oNCL2MJGOT
Interested in more tips like this? I run a newsletter where I share data science content regularly. See this link for additional information: https://t.co/ktUcWo9XpO
#DataAnalytics #statisticsclass #RStats #RStudio #Data #database #Rpackage
Mixed models combine fixed effects (consistent across data) and random effects (vary across data) to analyze complex data structures, such as repeated measures or hierarchical data. When used correctly, they can provide more accurate and reliable insights.
✔️ Handles Complex Data: Suitable for hierarchical and repeated measures data by managing both fixed and random effects.
✔️ Improves Accuracy: Accounts for random variability, leading to more reliable estimates.
✔️ Broad Applications: Useful in medicine, economics, psychology, ecology, and other fields with grouped data.
✔️ Controls Unobserved Factors: Random effects help manage variability due to unobserved factors.
❌ Computational Cost: Can be resource-intensive for large data sets.
❌ Overfitting Risk: Too many random effects can cause overfitting.
❌ Interpretation Challenges: Results can be harder to interpret compared to simpler models.
❌ Assumption Sensitivity: Assumes normally distributed random effects, which can affect results if not met.
❌ Convergence Issues: Fitting mixed models can be challenging with complex structures or limited data.
The image below compares fixed, random, and mixed effects in linear regression models. It shows how fixed effects have consistent intercepts and slopes, while random effects allow both to vary across groups, and mixed effects combine these approaches to capture both shared trends and group-specific variations. Image credit to Wikipedia: https://t.co/GF276gzoy2
🔹 In R: The lme4 package fits mixed models, and lmerTest adds significance testing. The nlme package offers additional options for complex random effects.
🔹 In Python: The statsmodels library’s MixedLM function supports mixed models, and pandas helps manage hierarchical data. For Bayesian mixed models, consider the PyMC library.
Want to learn more about Statistics, Data Science, R, and Python? Subscribe to my email newsletter! More information: https://t.co/ktUcWo9XpO
#StatisticalAnalysis #Rpackage #RStats #DataScientist #DataAnalytics
🔬Investigating viral infections in a controlled way: researchers establish a cell-free T7 phage cycle on synthetic cells. A simplified but promising in vitro system for studying viral infection variables, phage-host interactions, and more. Full story👇
https://t.co/ZU77MP4jIE
🧬How selective pressures shape plasmid evolution within the host cell?
Scientists have measured within-cell fitness of competing plasmids, revealing new insights into cell and plasmid dynamics and into how antibiotic resistance evolves in bacteria! 👉 https://t.co/ikrs5eIZLZ
Phages are full of genes of unknown fxn that may be adaptive in specific conditions.
New preprint: Phage TnSeq identifies essential genes rapidly and knocks all non-essentials. We would like to send a pool of phiKZ mutants to anyone wanting it! Reach out
https://t.co/JrB3J0ZytA
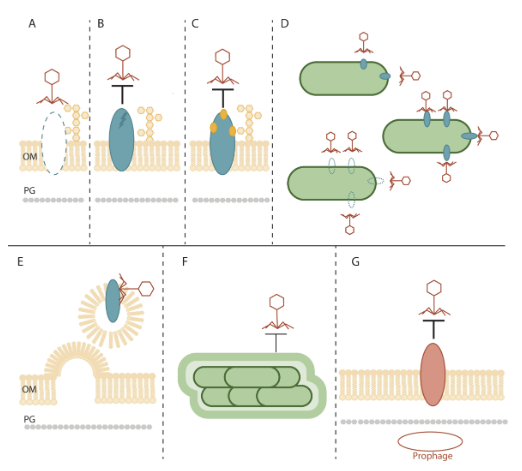
Phages exert selective pressure that can “steer” bacteria toward increased antibiotic susceptibility. In #JBacteriology, researchers review the state of phage steering research + guidelines emphasizing receptor identification for therapeutic design. https://t.co/2j8Mu4dUNj
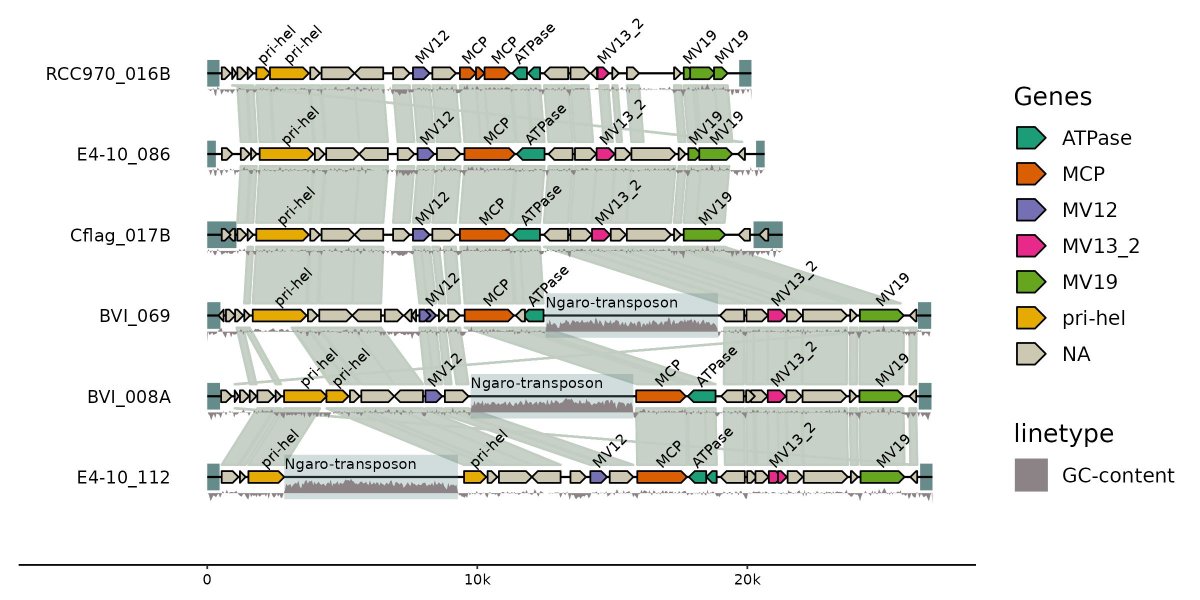
Visualize genomic data with ease using gggenomes, an R package that extends ggplot2 to handle and display genomic information intuitively. Whether you’re comparing genomes, analyzing features, or showcasing synteny, gggenomes provides the tools you need to turn complex genomic data into clear, informative visualizations.
Why use gggenomes?
✔️ Genomic-focused visualizations: Specifically designed for handling genomic data, including features, alignments, and comparative analysis.
✔️ Versatile and modular: Create detailed and layered plots for diverse genomic scenarios with flexibility for customization.
✔️ Built on ggplot2: Leverages ggplot2’s familiar framework, making it easy for users to adapt and enhance their visualizations.
The example visualization shown here is taken directly from the gggenomes GitHub repository, demonstrating how it transforms genomic data into compelling plots: https://t.co/FzE2wNzHeP
Curious to learn more about creating data visualizations in R and using tools like ggplot2 and its extensions? Check out my online course, "Data Visualization in R Using ggplot2 & Friends!"
Further details: https://t.co/ztlEzoEDWv
#tidyverse #statisticsclass #RStats #database #datavis #R #ggplot2 #Python #VisualAnalytics
New from @Gloeomargarita & team found that activity—not abundance—lets soil microbes thrive inside plant roots.
Using the BONCAT technique, they discovered root microbes are nearly 10× more active than those in surrounding soil.
🔗https://t.co/8RNAastNuG
Symbiont replacement and subsequent parallel genome erosion reshape a dual obligate symbiosis in the aphid Lachnus tropicalis https://t.co/aDPk22wV7n #biorxiv_evobio
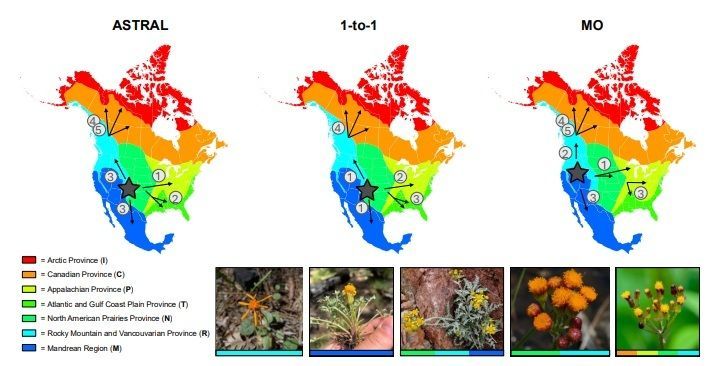
Phylogenomic challenges in polyploid-rich lineages: Insights from orthology inference and reticulation methods using the complex genus Packera (Asteraceae: Senecioneae)
https://t.co/Maex69m0In
♻️
Population genomic scan of endogenous retrovirus insertions revealed cryptic drivers of selective sweep in wild house mouse genomes https://t.co/0LraxpGCCJ #biorxiv_evobio