Top Tweets for #100DaysofData

Day 94 / #100DaysOfData
-Started a new EDA + Power BI project using a Quick Commerce delivery dataset
-Handled missing values, removed duplicates, and validated the dataset
-A good chunk of today was spent understanding the data before jumping into analysis.

Day 93 / #100DaysOfData
-Started learning Pandas
-Worked on reading files (CSV, Excel, TXT, JSON)
-Learned indexing, filtering, and sorting data
Day 93 / #100DaysOfData
-Started learning Pandas
-Worked on reading files (CSV, Excel, TXT, JSON)
-Learned indexing, filtering, and sorting data
Day 92 / #100DaysOfData
-Covered array operations, broadcasting, matrices, random numbers
-Worked on reshaping, flattening, reversing arrays
-Also learned handling unique values, counts, and mathematical operations
Pretty much covered all core NumPy basics in one go.
Day 92 / #100DaysOfData
-Covered array operations, broadcasting, matrices, random numbers
-Worked on reshaping, flattening, reversing arrays
-Also learned handling unique values, counts, and mathematical operations
Pretty much covered all core NumPy basics in one go.
Day 91 / #100DaysOfData
-Started learning NumPy basics
-Understood arrays, shape, size, indexing, and basic operations
-Also explored reshaping and how arrays actually work under the hood
Day 91 / #100DaysOfData
-Started learning NumPy basics
-Understood arrays, shape, size, indexing, and basic operations
-Also explored reshaping and how arrays actually work under the hood
Day 90 / #100DaysOfData
-Spent time solving SQL problems on joins
-Worked on INNER, LEFT, and multi-table joins
-Getting more comfortable connecting tables and writing cleaner queries
Joins are finally starting to click.

Day 17: Capstone project complete. 🎯
Analyzed 400,000+ e-commerce transactions.
Built a full customer segmentation using RFM analysis.
948 Champions. 1,449 at churn risk. 82% revenue from UK.
Dashboard + full report on GitHub 👇
#DataAnalytics #100DaysOfData #Python
Building my capstone project.
Used RFM analysis to segment 4,339 customers.
948 Champions. 1,208 Lost. 275 At Risk.
Most businesses don't know which bucket their
customers fall into. Data analysts find out.
https://t.co/JGEHEtSfDV
#DataAnalytics #100DaysOfData #Python

Day 12: Project 3 complete. 🛒
Analyzed 540,000+ e-commerce transactions.
Key finding: 82% of revenue comes from ONE country.
That's not a strength — it's a risk.
Live dashboard 👇
[https://t.co/w286bqr1d6]
#DataAnalytics #100DaysOfData #Tableau
![samicode_'s tweet photo. Day 12: Project 3 complete. 🛒
Analyzed 540,000+ e-commerce transactions.
Key finding: 82% of revenue comes from ONE country.
That's not a strength — it's a risk.
Live dashboard 👇
[https://t.co/w286bqr1d6]
#DataAnalytics #100DaysOfData #Tableau https://t.co/ZJyonpN2eK](https://pbs.twimg.com/media/HHqiybuWkAkmbn_.png)
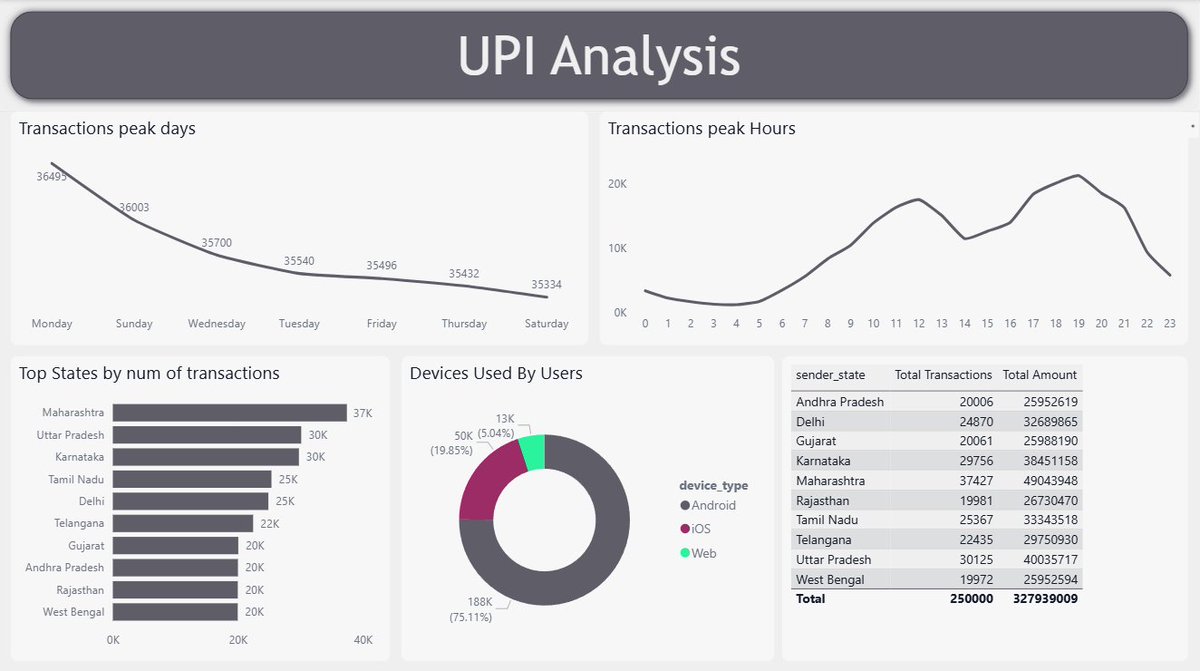
Day 89 / #100DaysOfData
-Analyzed UPI transaction data and built a full report
-Used Microsoft Fabric semantic model for data cleaning and structuring
-Covered metrics like total amount, transactions, category spend, peak hours, top banks, and user/device insights
#powerbi

Day 88 / #100DaysOfData
-Completed my end-to-end Sales Analytics report
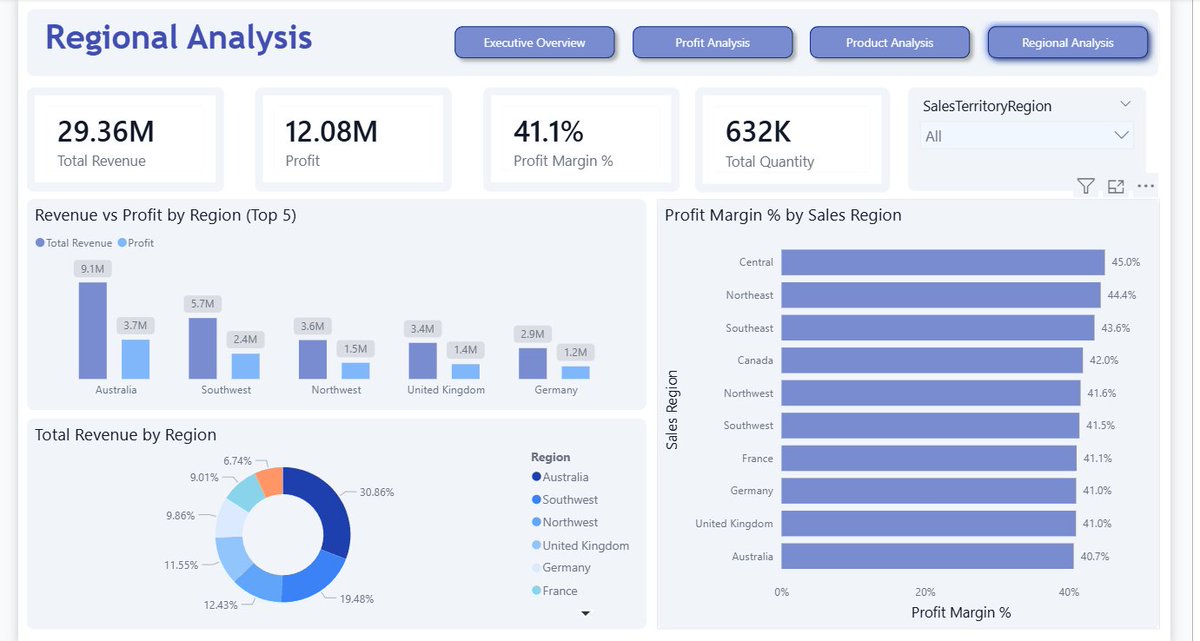
-Built multiple views: Executive Overview, Profit Analysis, Product Analysis, Regional Analysis
-Cleaned data, modeled star schema, created DAX measures, and designed the full dashboard


Day 88 / #100DaysOfData
-Completed my end-to-end Sales Analytics report
-Built multiple views: Executive Overview, Profit Analysis, Product Analysis, Regional Analysis
-Cleaned data, modeled star schema, created DAX measures, and designed the full dashboard
Day 87 / #100DaysOfData
-Built a Product Analysis view in my dashboard
-Compared revenue vs profit across products
-Identified high/Low profit-per-unit products
-Added bookmarks for better interaction
-Getting clearer product-level insights now

Day 87 / #100DaysOfData
-Built a Product Analysis view in my dashboard
-Compared revenue vs profit across products
-Identified high/Low profit-per-unit products
-Added bookmarks for better interaction
-Getting clearer product-level insights now
Day 86 / #100DaysOfData
-Made some improvements to the Executive Overview Page
-Created a new Profit Analysis view
-Added cost vs revenue and profit trends
-Starting to connect insights across different views


Day 85 / #100DaysOfData
-Built the Executive Overview of my sales dashboard.
-Spent today building out the visuals for page 1 in Power BI.
-Added KPIs, product & region insights, and a revenue trend.
more to build next.

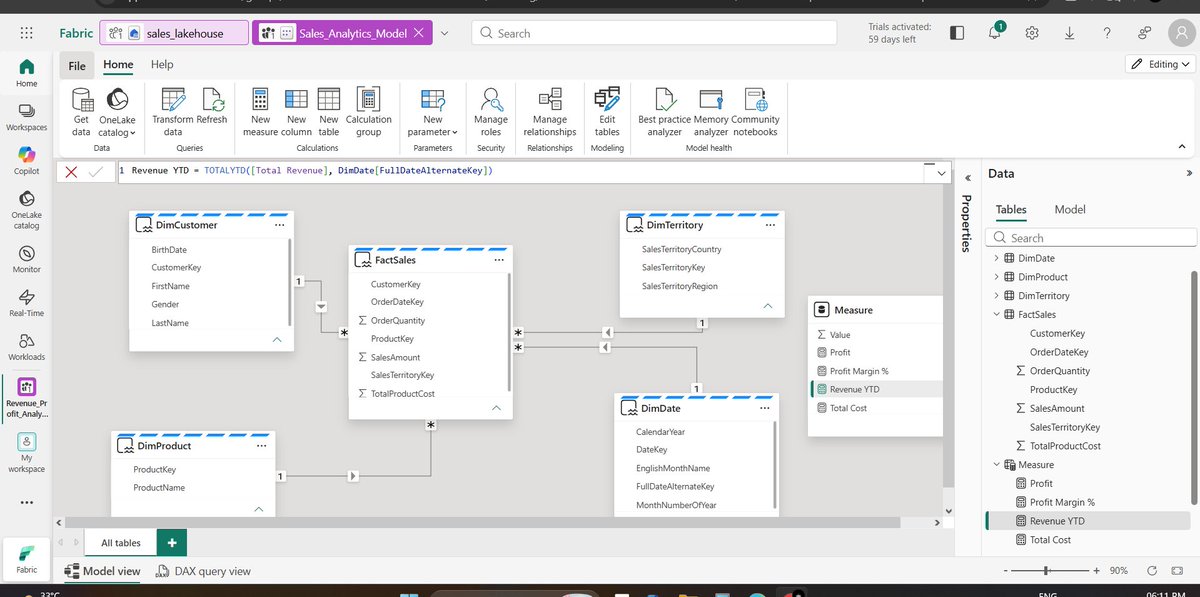
Day 84 / #100DaysOfData
-Worked on data cleaning and modeling in Microsoft Fabric
-Created fact & dimension tables and built relationships (star schema)
-Added DAX measures like revenue, profit, and margin
-Connected Power BI to the model
-Now ready to build dashboard
Day 84 / #100DaysOfData
-Worked on data cleaning and modeling in Microsoft Fabric
-Created fact & dimension tables and built relationships (star schema)
-Added DAX measures like revenue, profit, and margin
-Connected Power BI to the model
-Now ready to build dashboard
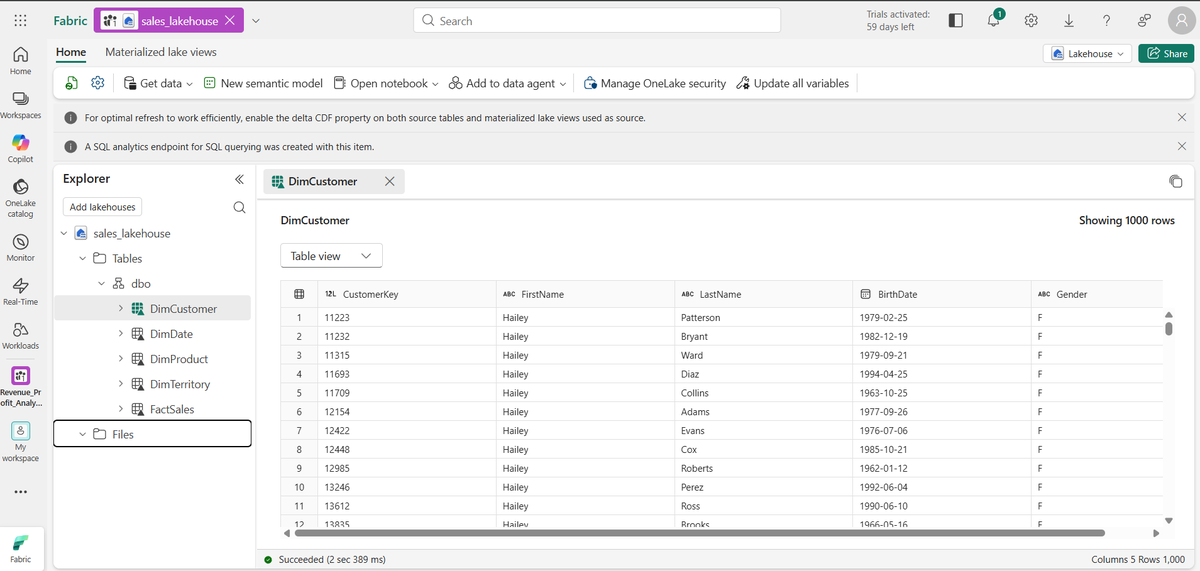
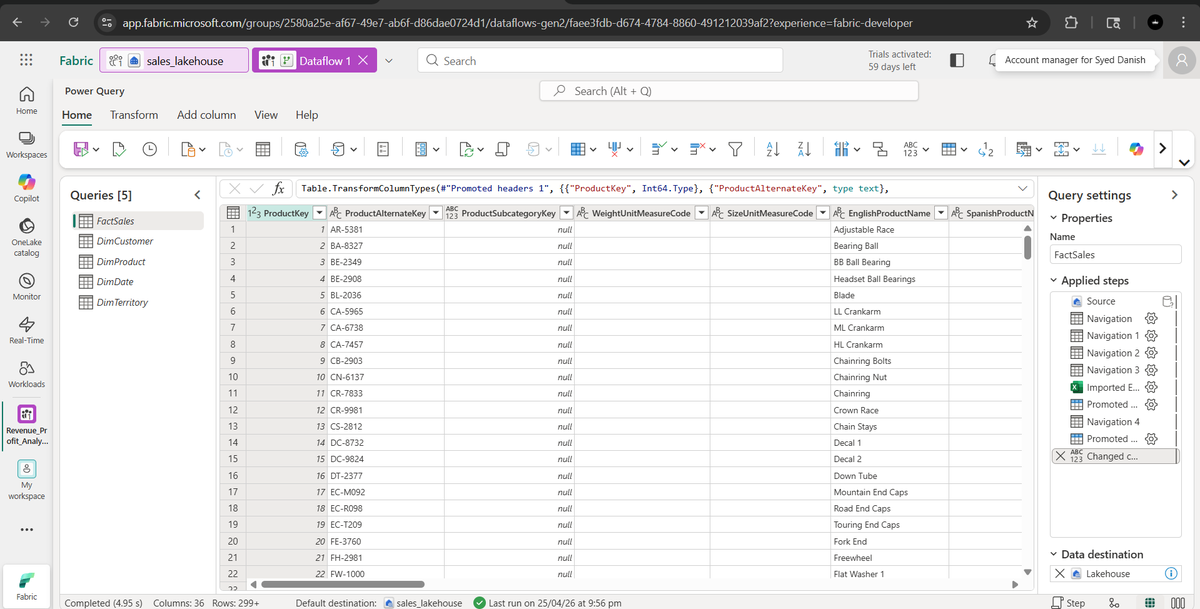
Day 83 / #100DaysOfData
-Started building a proper end-to-end project in Microsoft Fabric
-Set up workspace, lakehouse, and loaded the data
-Next step is to clean the data.
-Feels like I’m finally understanding how the full data pipeline works
Day 83 / #100DaysOfData
-Started building a proper end-to-end project in Microsoft Fabric
-Set up workspace, lakehouse, and loaded the data
-Next step is to clean the data.
-Feels like I’m finally understanding how the full data pipeline works
Day 82 / #100DaysOfData
-Solved SQL problems using CTE.
-Practiced breaking complex queries into readable steps.
-Used CTE with aggregation and filtering.
-Focused on writing cleaner and more structured SQL.
Day 82 / #100DaysOfData
-Solved SQL problems using CTE.
-Practiced breaking complex queries into readable steps.
-Used CTE with aggregation and filtering.
-Focused on writing cleaner and more structured SQL.
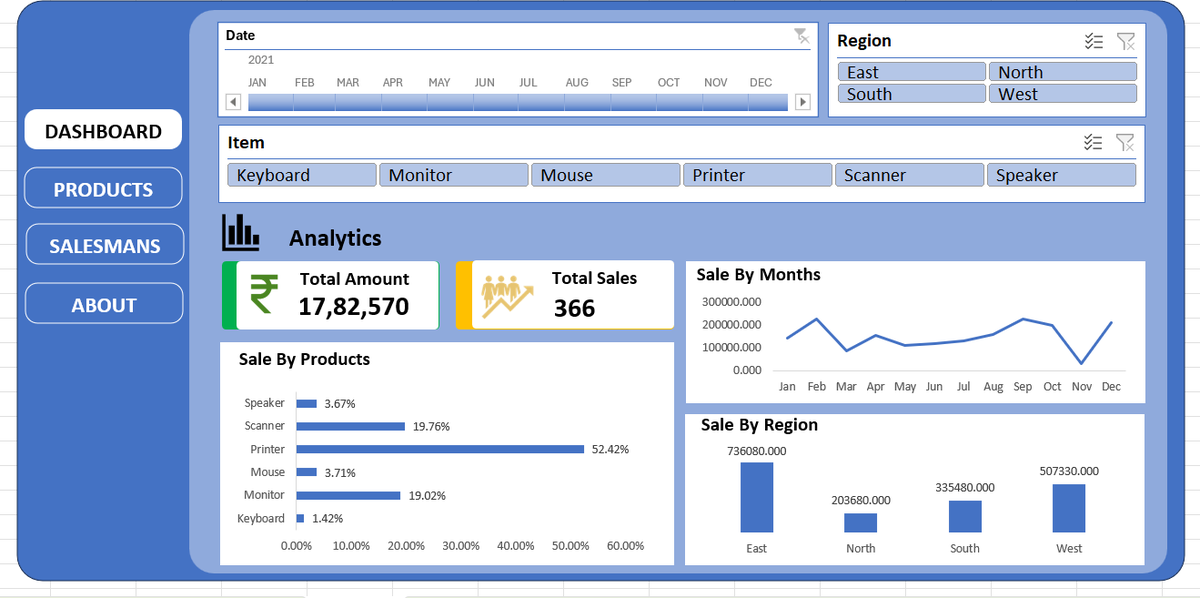
Day 80 & 81 / #100DaysOfData
-Completed my Excel dashboard.
-Added slicers (Date, Region, Item) for better interactivity.
-Built product-level analysis with Top/Bottom performers.
-Refined layout and visuals to make insights clearer.

Day 80 & 81 / #100DaysOfData
-Completed my Excel dashboard.
-Added slicers (Date, Region, Item) for better interactivity.
-Built product-level analysis with Top/Bottom performers.
-Refined layout and visuals to make insights clearer.
Day 79 / #100DaysOfData
-Started a new Excel dashboard.
-Loaded data into Excel and began working in Power Query.
-Performed data cleaning and transformations to prepare the dataset.

Day 79 / #100DaysOfData
-Started a new Excel dashboard.
-Loaded data into Excel and began working in Power Query.
-Performed data cleaning and transformations to prepare the dataset.
Day 78 / #100DaysOfData
-Learned about CTE (Common Table Expressions).
-Understood how to break complex queries into steps instead of nested subqueries. Used CTE with aggregation and window functions.
Day 78 / #100DaysOfData
-Learned about CTE (Common Table Expressions).
-Understood how to break complex queries into steps instead of nested subqueries. Used CTE with aggregation and window functions.
Day 77 / #100DaysOfData
-Solved 2 SQL problems.
-Focused on improving query logic and thinking through edge cases.
-Slowly getting better at writing cleaner and more efficient SQL.
Day 77 / #100DaysOfData
-Solved 2 SQL problems.
-Focused on improving query logic and thinking through edge cases.
-Slowly getting better at writing cleaner and more efficient SQL.
Day 76 / #100DaysOfData
-Solved SQL problems on LAG() and consecutive patterns.
-Learned how to detect consecutive increases instead of just counting increases.
-Worked with window functions to track previous values and build sequence logic.
Day 76 / #100DaysOfData
-Solved SQL problems on LAG() and consecutive patterns.
-Learned how to detect consecutive increases instead of just counting increases.
-Worked with window functions to track previous values and build sequence logic.
Day 75 / #100DaysOfData
-Learned macros in Excel.
-Understood how to automate repetitive tasks.
-Explored recording and running simple macros.
-Taking first steps toward automation.
Day 75 / #100DaysOfData
-Learned macros in Excel.
-Understood how to automate repetitive tasks.
-Explored recording and running simple macros.
-Taking first steps toward automation.
Day 74 / #100DaysOfData
-Created an Excel dashboard.
-Included KPIs like sales, profit, and customers, along with trends and country-level insights.
-Worked on layout, formatting, and making it more presentable.
-Slowly getting better at building clean dashboards.

Trends for you
Most Popular Users

Elon Musk 
@elonmusk
240.1M followers

Barack Obama
@barackobama
119.3M followers

Donald J. Trump
@realdonaldtrump
111.6M followers

Cristiano Ronaldo
@cristiano
108.9M followers

Narendra Modi
@narendramodi
107M followers

Rihanna
@rihanna
97.3M followers

NASA
@nasa
92.1M followers

Justin Bieber
@justinbieber
90.6M followers

KATY PERRY
@katyperry
86.8M followers

Taylor Swift
@taylorswift13
80.6M followers

Lady Gaga
@ladygaga
72.1M followers

Kim Kardashian
@kimkardashian
69.4M followers

YouTube
@youtube
68.6M followers

Virat Kohli
@imvkohli
68.5M followers

Bill Gates
@billgates
63.4M followers

The Ellen Show
@theellenshow
62.5M followers

CNN
@cnn
61.9M followers

Neymar Jr
@neymarjr
61M followers

X
@x
60.9M followers

CNN Breaking News
@cnnbrk
59.9M followers