Top Tweets for #100daysofDataAnalysis

Day 48/100 - #100DaysOfDataAnalysis
Challenge accepted!
A friend sent me a messy dataset to test my data cleaning skills. No tutorials, just me and the raw data.
My goals:
1. Figure out the best cleaning workflow
2. Track exactly how long it takes me
3. Document everything

Day 39/100 - #100DaysOfDataAnalysis
It was all about taking my Car Inventory Database
Project through the full data analysis pipeline: cleaning, aggregation, visualization and reporting.
#Excel #100DaysOfData #coursera #freecodecamp
1/5
Day 22/100 – #100DaysOfDataAnalysis
Started working on a gradebook style database ✅
The company is running tests to see which employees pass or fail, so I’ll be using conditional formatting and the OR function to flag results automatically
Day 21/100 – #100DaysOfDataAnalysis
I took a short break after resuming school, but I’m back and finally completed my employee payroll worksheet for January ✅
1/3

It’s been two quiet days since my last #100DaysOfDataAnalysis update.
I wasn’t feeling well and had to take a short break to rest and recover
I’m feeling much better now and ready to get back into my learning today😝

I’ll be starting 100 days of consistency challenge for Data Analytics, and I’d like to create a circle of 10 people who is interested in learning Data Analysis.If you’re struggling to learn alone or don’t know where to start - we can create a WhatsApp community to learn together.
Day 8/100 – #100DaysOfDataAnalysis
Today’s focus was on Excel auditing & printing essentials
✅Traced precedents & dependents to find formula links
✅Used error checking tools
✅Practiced page setup, margins & orientation
✅ Set print areas & explored page breaks
Day 4/100 – #100DaysOfDataAnalysis
Another free day = more Excel practice!
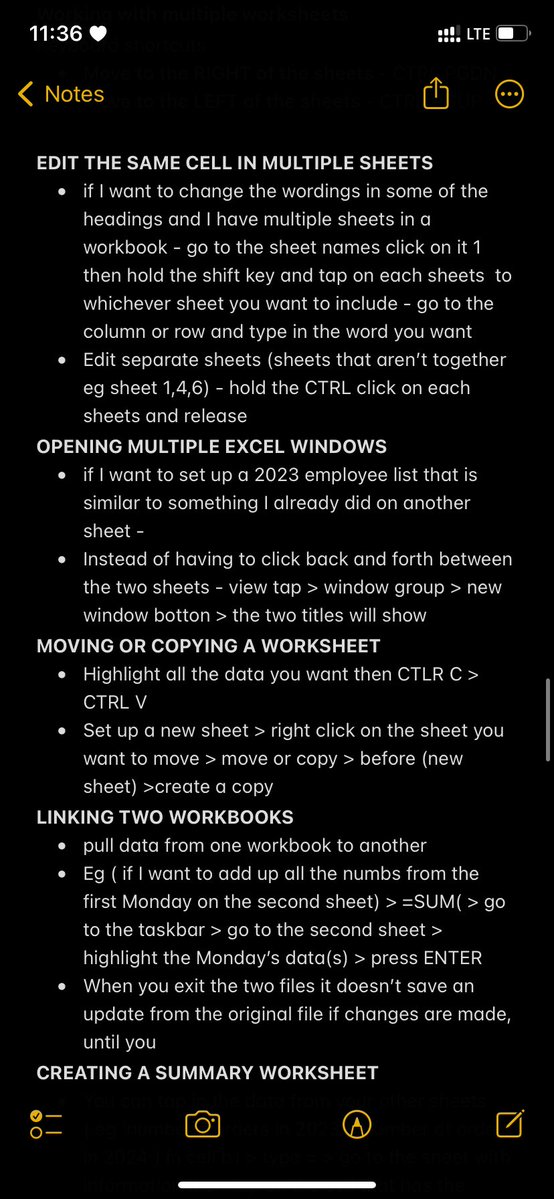
Learned to work across multiple sheets, link workbooks, summarize data, group info, and even import data from other sources.
Can’t wait to start small projects soon 👀
Any tips, Excel tricks? I’m all ears

Day 2/100 – #100DaysOfDataAnalysis
Practiced some of Excel formulas & functions( SUM, AVERAGE, MAX, MIN, COUNT ) today and learned how to filter, format, sort, and create basic charts.

Day 7✅ — just showing up and learning Data Analysis #100daysofdataanalysis
Just like I mentioned yesterday, I’m working on a car database where I had to download a car inventory text file online. That part actually took me a while, but I eventually found a good one.
Day 5✅ — just showing up and learning Data Analysis #100daysofdataanalysis
Today, I worked on a SALES REPORT and learnt Text to Columns, IF and SUMIF formulas, sorting, filtering, Pivot Tables, and pie charts. I spent more time learning than usual, but it was worth it


Day 4✅ — just showing up and learning Data Analysis #100daysofdataanalysis
Today’s assessment was about creating a Decision Maker to choose a job based on pay, job market, enjoyment, talent, and schooling. I enjoyed it because it felt personal


Day 3✅ �� just showing up and learning Data Analysis #100daysofdataanalysis
Today, I worked on Grade Book, learning conditional formatting, the OR formula, and charts. I also completed an assessment and practiced everything I learned


Day 2✅ — just showing up and learning Data Analysis #100daysofdataanalysis
Continued from where I stopped in Excel~ yesterday’s payroll assignment.
I learnt how and when to use the IF formula, and also explored relative vs. absolute cell referencing, which I applied in my work


Day 1✅ — just showing up and learning Data Analysis #100daysofdataanalysis
Today I started off with the foundations: what Data Analysis is and the types. I’ll be focusing mostly on Descriptive and Diagnostic Analysis for now. Then, I moved on to an Excel tutorial on YouTube

Hi Hi #datafam
Starting my #100DaysOfDataAnalysis today and will be completing my 100th day on my birthday🥰So cheers to 99days of consistency ahead.
#datafam #DataAnalytics

Day 33 of #100DaysOfDataAnalysis
Today I finally got my COVID-19 dataset imported into SQL (113x20) 🎉
It contains daily cases, deaths, global stats, and even economic indicators like oil prices & reserves
From total confirmed cases to peak daily new cases
#SQL #DataAnalytics


100 days of Data Analysis Challenge Starting tomorrow.
#100DaysOfDataAnalysis
A spreadsheet isn’t just rows and columns.
It’s a storybook of: Sales trends
Spending habits
Growth signals
Good analysts don’t just see numbers.
They uncover stories in the data.
#100DaysOfDataAnalysis #DataDriven

Data ≠ Decisions.
The real challenge isn’t collecting or analyzing data.
It’s turning insights into clear actions.
Great analysts don’t just crunch numbers.
They bridge the gap between data and decisions.
#100DaysOfDataAnalysis #DataDriven #DecisionMaking


Trends for you
Most Popular Users

Elon Musk 
@elonmusk
240.3M followers

Barack Obama
@barackobama
119.3M followers

Donald J. Trump
@realdonaldtrump
111.6M followers

Cristiano Ronaldo
@cristiano
109.1M followers

Narendra Modi
@narendramodi
107M followers

Rihanna
@rihanna
97.3M followers

NASA
@nasa
92.1M followers

Justin Bieber
@justinbieber
90.6M followers

KATY PERRY
@katyperry
86.9M followers

Taylor Swift
@taylorswift13
80.7M followers

Lady Gaga
@ladygaga
72.3M followers

Kim Kardashian
@kimkardashian
69.4M followers

Virat Kohli
@imvkohli
68.7M followers

YouTube
@youtube
68.6M followers

Bill Gates
@billgates
63.5M followers

The Ellen Show
@theellenshow
62.5M followers

CNN
@cnn
61.9M followers

Neymar Jr
@neymarjr
61.3M followers

X
@x
60.9M followers

Selena Gomez
@selenagomez
60M followers