Top Tweets for #100daysofdata

Day 94 / #100DaysOfData
-Started a new EDA + Power BI project using a Quick Commerce delivery dataset
-Handled missing values, removed duplicates, and validated the dataset
-A good chunk of today was spent understanding the data before jumping into analysis.

Day 93 / #100DaysOfData
-Started learning Pandas
-Worked on reading files (CSV, Excel, TXT, JSON)
-Learned indexing, filtering, and sorting data
Day 93 / #100DaysOfData
-Started learning Pandas
-Worked on reading files (CSV, Excel, TXT, JSON)
-Learned indexing, filtering, and sorting data
Day 92 / #100DaysOfData
-Covered array operations, broadcasting, matrices, random numbers
-Worked on reshaping, flattening, reversing arrays
-Also learned handling unique values, counts, and mathematical operations
Pretty much covered all core NumPy basics in one go.
Day 92 / #100DaysOfData
-Covered array operations, broadcasting, matrices, random numbers
-Worked on reshaping, flattening, reversing arrays
-Also learned handling unique values, counts, and mathematical operations
Pretty much covered all core NumPy basics in one go.
Day 91 / #100DaysOfData
-Started learning NumPy basics
-Understood arrays, shape, size, indexing, and basic operations
-Also explored reshaping and how arrays actually work under the hood
Day 91 / #100DaysOfData
-Started learning NumPy basics
-Understood arrays, shape, size, indexing, and basic operations
-Also explored reshaping and how arrays actually work under the hood
Day 90 / #100DaysOfData
-Spent time solving SQL problems on joins
-Worked on INNER, LEFT, and multi-table joins
-Getting more comfortable connecting tables and writing cleaner queries
Joins are finally starting to click.

Day 17: Capstone project complete. 🎯
Analyzed 400,000+ e-commerce transactions.
Built a full customer segmentation using RFM analysis.
948 Champions. 1,449 at churn risk. 82% revenue from UK.
Dashboard + full report on GitHub 👇
#DataAnalytics #100DaysOfData #Python
Building my capstone project.
Used RFM analysis to segment 4,339 customers.
948 Champions. 1,208 Lost. 275 At Risk.
Most businesses don't know which bucket their
customers fall into. Data analysts find out.
https://t.co/JGEHEtSfDV
#DataAnalytics #100DaysOfData #Python
Day 15: HR Analytics project complete.
Overtime employees leave at 3x the rate.
Sales department has the worst attrition ratio.
Data tells HR where to focus before it's too late.
GitHub 👇
https://t.co/JGEHEtSfDV
#DataAnalytics #SQL #100DaysOfData
Day 14: HR Analytics with SQL.
Found that employees working overtime
leave at 3x the rate of normal-hours staff.
Burnout isn't just a wellness issue.
It's a business cost problem.
GitHub 👇
https://t.co/JGEHEtSfDV
#DataAnalytics #SQL #100DaysOfData
Day 13: No new code today.
Just spent the day learning how to explain my work
like a real analyst — not just build it.
3 projects. Now I can defend every number in them.
That's the difference between a coder and an analyst.
#DataAnalytics #100DaysOfData

Day 12: Project 3 complete. 🛒
Analyzed 540,000+ e-commerce transactions.
Key finding: 82% of revenue comes from ONE country.
That's not a strength — it's a risk.
Live dashboard 👇
[https://t.co/w286bqr1d6]
#DataAnalytics #100DaysOfData #Tableau
![samicode_'s tweet photo. Day 12: Project 3 complete. 🛒
Analyzed 540,000+ e-commerce transactions.
Key finding: 82% of revenue comes from ONE country.
That's not a strength — it's a risk.
Live dashboard 👇
[https://t.co/w286bqr1d6]
#DataAnalytics #100DaysOfData #Tableau https://t.co/ZJyonpN2eK](https://pbs.twimg.com/media/HHqiybuWkAkmbn_.png)
Day 90 / #100DaysOfData
-Spent time solving SQL problems on joins
-Worked on INNER, LEFT, and multi-table joins
-Getting more comfortable connecting tables and writing cleaner queries
Joins are finally starting to click.
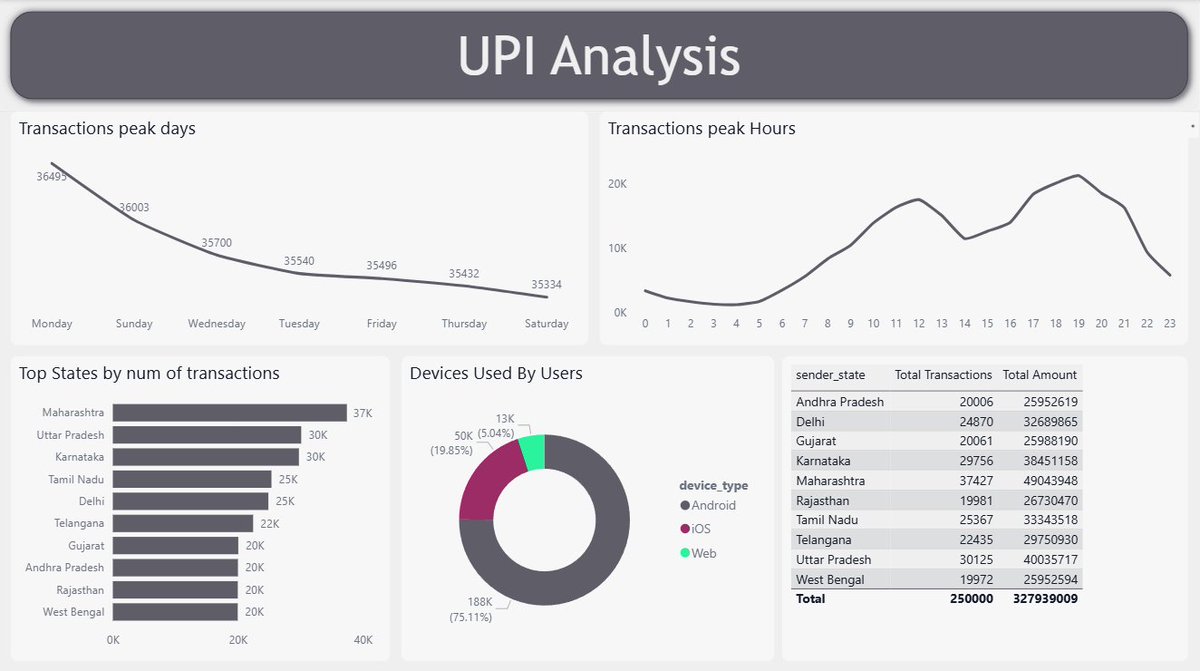
Day 89 / #100DaysOfData
-Analyzed UPI transaction data and built a full report
-Used Microsoft Fabric semantic model for data cleaning and structuring
-Covered metrics like total amount, transactions, category spend, peak hours, top banks, and user/device insights
#powerbi

Day 11: Analyzed 540,000+ e-commerce transactions.
UK generates 25x more revenue than the next market.
November is peak month — Christmas drives everything.
Data tells you where to focus. 📊
#DataAnalytics #100DaysOfData

Day 89 / #100DaysOfData
-Analyzed UPI transaction data and built a full report
-Used Microsoft Fabric semantic model for data cleaning and structuring
-Covered metrics like total amount, transactions, category spend, peak hours, top banks, and user/device insights
#powerbi
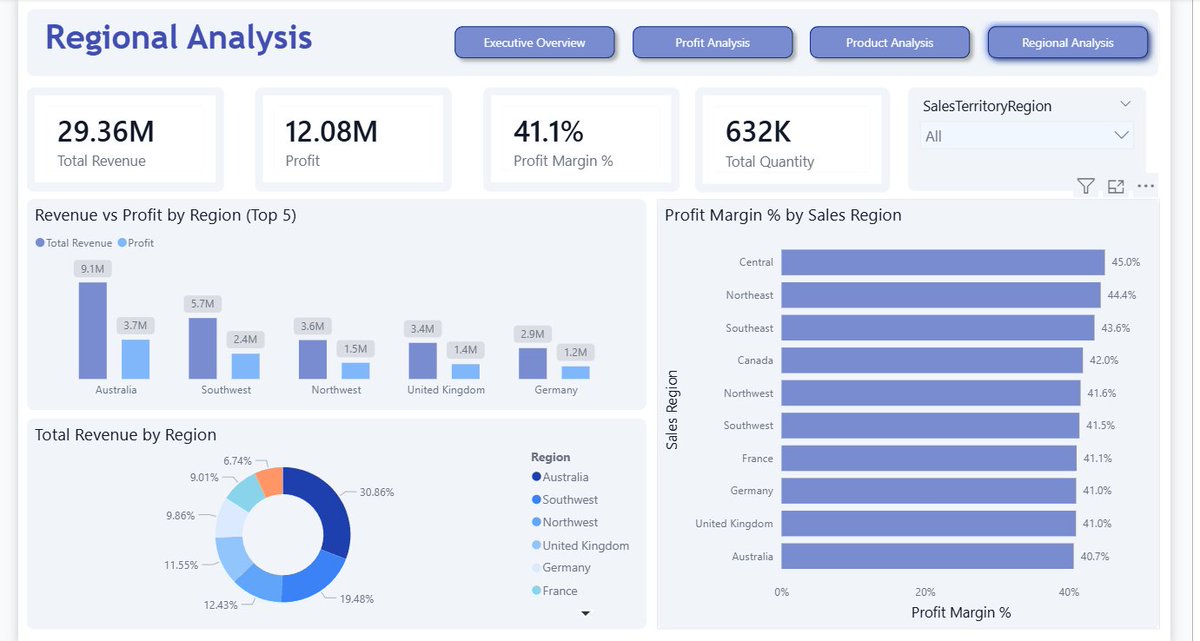
Day 88 / #100DaysOfData
-Completed my end-to-end Sales Analytics report
-Built multiple views: Executive Overview, Profit Analysis, Product Analysis, Regional Analysis
-Cleaned data, modeled star schema, created DAX measures, and designed the full dashboard


Day 88 / #100DaysOfData
-Completed my end-to-end Sales Analytics report
-Built multiple views: Executive Overview, Profit Analysis, Product Analysis, Regional Analysis
-Cleaned data, modeled star schema, created DAX measures, and designed the full dashboard
Day 87 / #100DaysOfData
-Built a Product Analysis view in my dashboard
-Compared revenue vs profit across products
-Identified high/Low profit-per-unit products
-Added bookmarks for better interaction
-Getting clearer product-level insights now

Day 10: Built a live COVID-19 dashboard
from 429,000+ real records.
SQL → Python → Tableau. Full pipeline.
Key finding: Nigeria's low infection rate
isn't good news — it's underreported data.
Dashboard live 👇
https://t.co/h60u7EuFk1
#DataAnalytics #100DaysOfData #Tableau
Day 9: Querying 429,000+ real COVID records with SQL.
Found that Nigeria's 0.12% infection rate
isn't low — it's underreported.
Limited testing + no access = invisible cases.
Data quality is just as important as the data itself.
#DataAnalytics #100DaysOfData #SQL
Day 87 / #100DaysOfData
-Built a Product Analysis view in my dashboard
-Compared revenue vs profit across products
-Identified high/Low profit-per-unit products
-Added bookmarks for better interaction
-Getting clearer product-level insights now
Day 86 / #100DaysOfData
-Made some improvements to the Executive Overview Page
-Created a new Profit Analysis view
-Added cost vs revenue and profit trends
-Starting to connect insights across different views


Day 8: Project 1 done. 🎯
Superstore Sales Analysis - 9,994 orders analyzed.
Findings:
→ Tables losing $17,725 at 26% discount
→Discounting is killing profit, not driving it
→ 3 sub-categories at a loss
Live on GitHub 👇
https://t.co/mIumxq8SLY
#DataAnalytics #100DaysOfData
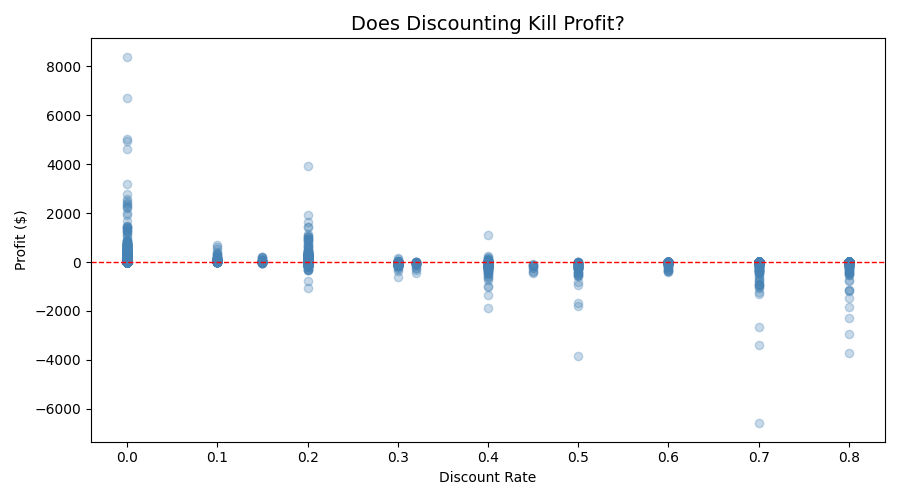
Day 7: Turned raw data into visuals.
This chart shows why blanket discounting
is silently killing profit.
Every dot below the red line = a loss.
The more you discount, the more you lose.
Data doesn't lie. 📉
#DataAnalytics #100DaysOfData
Day 86 / #100DaysOfData
-Made some improvements to the Executive Overview Page
-Created a new Profit Analysis view
-Added cost vs revenue and profit trends
-Starting to connect insights across different views
Day 85 / #100DaysOfData
-Built the Executive Overview of my sales dashboard.
-Spent today building out the visuals for page 1 in Power BI.
-Added KPIs, product & region insights, and a revenue trend.
more to build next.

Last Seen Hashtags on Sotwe
culona
Seen from Poland
stuttmynd
Seen from United Kingdom
马来西亚sm
Seen from Malaysia
단기임보처급구
Seen from United States
สนใจทักเฉพาะรับงานเท่านั้น
Seen from Thailand
nonicheugc
Seen from Spain
nenen #airsusu
Seen from Indonesia
Sasuke #gay
Seen from Germany
Bonnieblue
Seen from Turkey
elizabeth_taylor
Seen from Vietnam
Trends for you
Most Popular Users

Elon Musk 
@elonmusk
240.1M followers

Barack Obama
@barackobama
119.3M followers

Donald J. Trump
@realdonaldtrump
111.6M followers

Cristiano Ronaldo
@cristiano
108.8M followers

Narendra Modi
@narendramodi
106.9M followers

Rihanna
@rihanna
97.2M followers

NASA
@nasa
92.1M followers

Justin Bieber
@justinbieber
90.5M followers

KATY PERRY
@katyperry
86.7M followers

Taylor Swift
@taylorswift13
80.5M followers

Lady Gaga
@ladygaga
72.1M followers

Kim Kardashian
@kimkardashian
69.3M followers

YouTube
@youtube
68.6M followers

Virat Kohli
@imvkohli
68.4M followers

Bill Gates
@billgates
63.4M followers

The Ellen Show
@theellenshow
62.5M followers

CNN
@cnn
61.9M followers

Neymar Jr
@neymarjr
60.9M followers

X
@x
60.9M followers

CNN Breaking News
@cnnbrk
59.9M followers