Top Tweets for #30DaysofPowerbi

@TechnicalBben That's why I am starting a #30DaysOfPowerBI for my data analysts (enthusiast or beginner, or any level is welcome). At the end of the 30 days, they will be portfolio-ready, GitHub ati LinkedIn. Anyone can hop on it. 2026, Year of Intentionality

#30DaysofPowerBI
Day 9: Skincare analysis Dashboard
.
.
Total Revenue: $325,606.86 | 📦 Shipping Fee: $32,610.42
Top-performing salesperson: Anne Larsen
Beverages lead category revenue ($60.5k+)
NY incurs the highest shipping fee
Christina Lee tops shipping fee by ship

30DaysofPowerBI
Day 9: Skincare analysis Dashboard
.
.
-Central America leads all regions in total sales
-Sales fluctuated throughout 2022 with visible peaks in mid and late-year.
-United States generated the highest total profit.
Datset: @iam_daniiell

#30DaysofPowerBI
Day 9: Insurance Policy Dashboard
.
.
.
🚗 Private car use dominates (30K+), with commercial at 7.4K
🎓 Most policyholders have a Bachelor’s or High School education
👨👩👧 Majority of parents own cars tied to higher policy counts
Dataset from: @iam_daniiell

#30DaysofPowerBI
Day 8: Ride Services Dashboard
.
.
.
.
Wrapped up dive into ride sharing data with 10,000 rides📊
✅ 85% ride completion rate
🌧️ Most rides happen in clear weather
💳 Credit card dominates payment
🚗 SUVs cover the longest distance
Dataset from: @iam_daniiell

#30DaysofPowerBI
Day 8: Ride Services Dashboard
.
.
.
.
Wrapped up dive into ride sharing data with 10,000 rides📊
✅ 85% ride completion rate
🌧️ Most rides happen in clear weather
💳 Credit card dominates payment
🚗 SUVs cover the longest distance
Dataset from: @iam_daniiell
#30DaysofPowerBI
Day 7: Employee Retention Dashboard
.
.
.
.
📉 Churn rate at 26.54%!
Most customers leaving are on month-to-month contracts, have no tech support, & rarely have dependents.
Retention tip? Offer long-term deals + boost support services.

#30DaysofPowerBI
Day 5: Call Center Performance Dashboard
.
.
.
.
Tracking a total of 5,000 calls, with a resolution rate of 72.92%, this dashboard offers a deep dive into agent performance, topic-specific resolution, satisfaction rates, and daily call trends.


#30DaysofPowerBI
Day 5: Call Center Performance Dashboard
.
.
.
.
Tracking a total of 5,000 calls, with a resolution rate of 72.92%, this dashboard offers a deep dive into agent performance, topic-specific resolution, satisfaction rates, and daily call trends.
#30DaysofPowerBI
Day 4: Customer Demographic Dashboard
.
.
.
.
Analyzing purchasing behavior across categories, Subscription status, gender and location. Highlighting key metrics and kpi among 3,900 adult customers.
#datafam #PowerBI #DataAnalytics

#30DaysofPowerBI
Day:3 Diabetes Analysis Dashboard
.
.
.
.
Today’s dashboard dives into a health dataset analyzing diabetes outcomes in 768 patients using key metrics like glucose level, BMI, insulin, and age.
#datafam #PowerBI #DataAnalytics

#30DaysofPowerBI
Day:3 Diabetes Analysis Dashboard
.
.
.
.
Today’s dashboard dives into a health dataset analyzing diabetes outcomes in 768 patients using key metrics like glucose level, BMI, insulin, and age.
#datafam #PowerBI #DataAnalytics
#30DaysofPowerBI
Day 2: Sales Performance Dashboard
.
.
.
.
Few Insights:
📉 Sales Performance:
•Overall Decline: Total Sales fell by 5.44% between Jan 1 and Mar 30.
•Recovery: A sharp 22.01% increase (₦809.51) occurred from March 12–30.
#DataAnalytics #PowerBI

#30DaysofPowerBI
Day 2: Sales Performance Dashboard
.
.
.
.
Few Insights:
📉 Sales Performance:
•Overall Decline: Total Sales fell by 5.44% between Jan 1 and Mar 30.
•Recovery: A sharp 22.01% increase (₦809.51) occurred from March 12–30.
#DataAnalytics #PowerBI
#30DaysofPowerBI
Day 1: Global Finance Dashboard
.
.
.
.
Built a dashboard exploring Top Financial Services Companies by Revenue globally. Dashboard is not just graphic designing, it’s data visualized and questions answered.

#30DaysofPowerBI
Day 1: Global Finance Dashboard
.
.
.
.
Built a dashboard exploring Top Financial Services Companies by Revenue globally. Dashboard is not just graphic designing, it’s data visualized and questions answered.
⏳…..May 1 - May 30, kindly leave comments🫂

@MSPowerBI 🔹 What to expect? Daily insights, dashboards, and practical use cases.
🔹 Join me! Let’s grow together and explore the power of data storytelling.
Follow along and drop your thoughts! 💡📊 #PowerBI #DataAnalytics #LearningJourney #30DaysOfPowerBI

#day30
I just completed the DAX Functions chapter in Power BI, where I learned and practiced filtering & counting in DAX with ALL, FILTER, and CROSS FILTER functions. Also, practiced Iterating functions like SUMX, AVERAGEX, RANKX.
What Next?...
#DAX #30daysofPowerBI
#day28
Today, I took part of my Intermediate Dax functions chapter, where I learned and practiced row context, filter contexts .
#day22
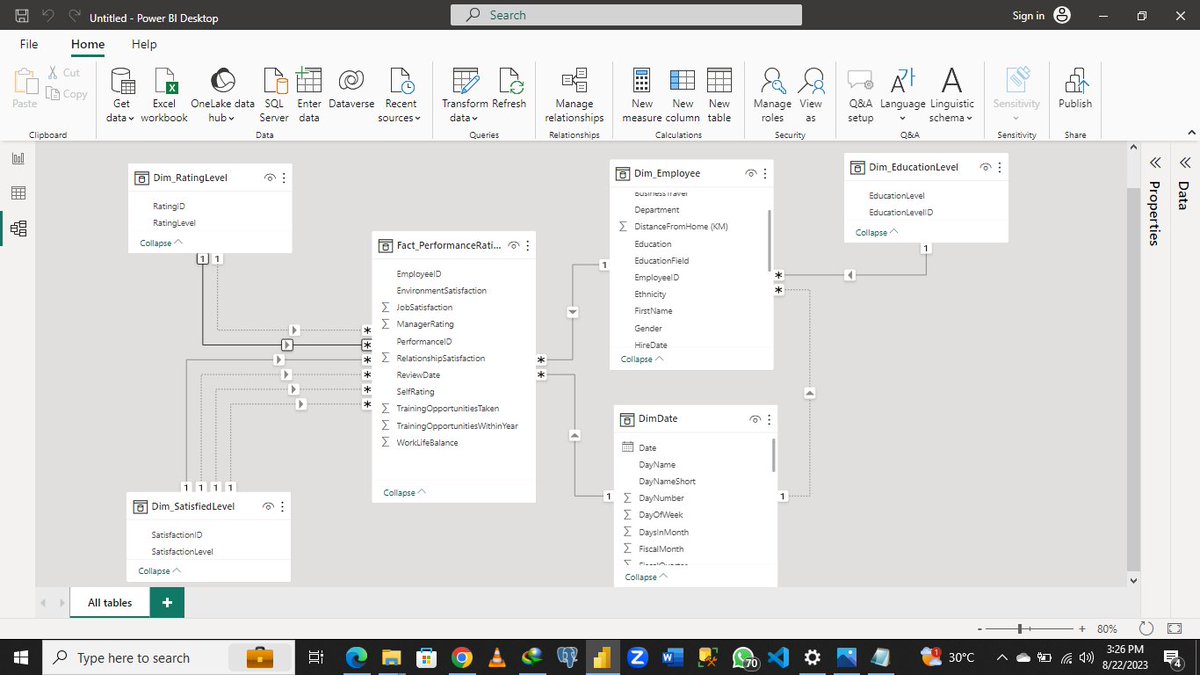
Started a Case Study analysis on HR Attrition & Employee Performance . Through the case study, I created a snowflake Data Model, Computed some measures and calculated columns. I also began creating charts for the report.
#dataanalytics #datavisualization #30daysofPowerBI


#day21
Completed the Intermediate Data Modelling chapter. Here, I extended my knowledge on Data modelling and practiced bi-directional cross filtering in data modelling. Other topics practiced were Measures, hierarchies and fixing Performance Issues in Power BI
#DataAnalytics
#Day3
I completed the Data Transformation chapter, where I learned how to manipulate the Northwind sales data with the Transpose function, Pivot & Un-Pivot, and Group By" ..Trust me, If you enjoyed Excel and SQL, this will become a walkover for you.
#30daysofPowerBI


#Day2
I did' do much of classes today as I was busy with work-related assignments.
I took some time to complete my Case Study course and began learning "Data Transformation in Power BI". This entails me transforming my data in Power Query so it is ready for analysis.

#Day1
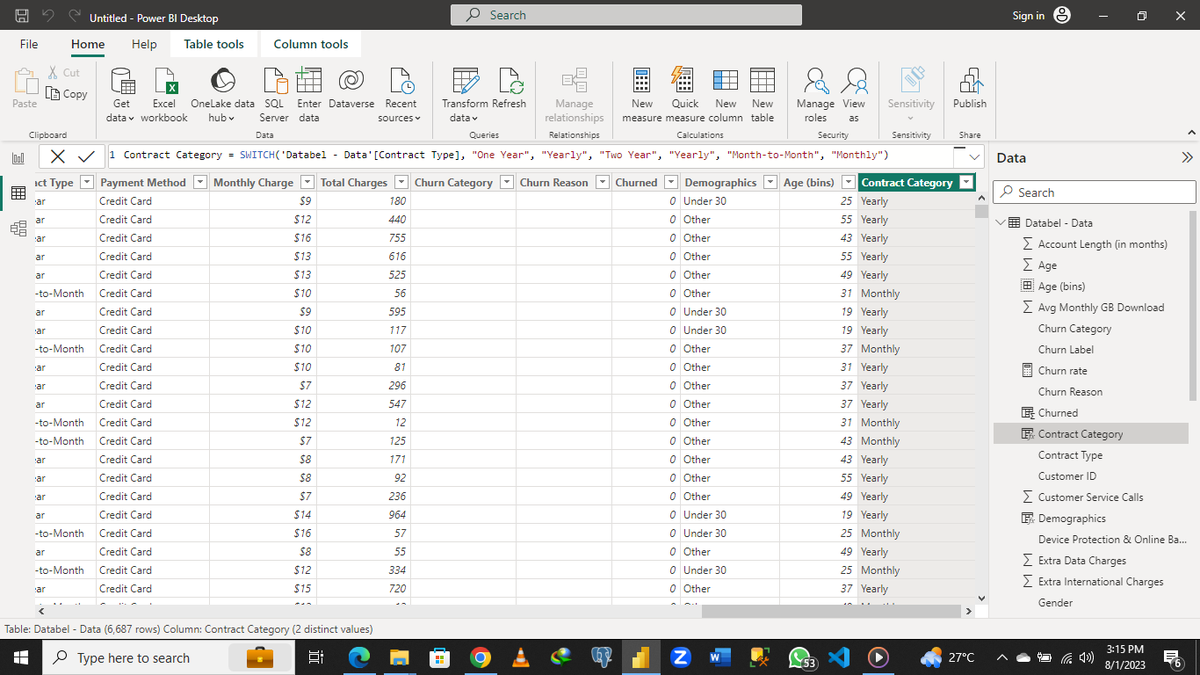
I explored, and analyzed a case study dataset called "databell", where I was able to put good use of DAX functions like SWITCH, IF, COUNTS, DISTINCT COUNT, DIVIDE, SUM, AVERAGEX to create new measures and new columns.
#30daysofPowerBI #DataAnalytics #datavisualization


#datafam
For the next 30 days, I will be documenting lessons, challenges and milestones for my #POWERBI career track on @DataCamp ..
The goal is to become better each day with this tool.. Thanks to @DataFestAfrica for the opportunity once again 🙏
#30daysofPowerBI
#datafam
For the next 30 days, I will be documenting lessons, challenges and milestones for my #POWERBI career track on @DataCamp ..
The goal is to become better each day with this tool.. Thanks to @DataFestAfrica for the opportunity once again 🙏
#30daysofPowerBI

Today I learnt how to control visual interface and the visual background in other to make the work look clean and clear🙂 #30daysofpowerBI
Today I was able to learn more about the interface, filters, format and also creating my first visualization ain't that great😀 #30daysofpowerBI


Welcome to #30DaysOfPowerBI, a series of text and video #PowerBI tips for newbies!
If you find these helpful, please let her know
More tips to c@learntechtant https://t.co/ktIg7dCk1n

I just published my #30DaysOfPowerBi review with @cic_datafellows on medium. visit and clap🤠 https://t.co/AeCy2dtR17
Last Seen Hashtags on Sotwe
Trends for you
Most Popular Users

Elon Musk 
@elonmusk
240.2M followers

Barack Obama
@barackobama
119.3M followers

Donald J. Trump
@realdonaldtrump
111.6M followers

Cristiano Ronaldo
@cristiano
109.2M followers

Narendra Modi
@narendramodi
106.9M followers

Rihanna
@rihanna
97.3M followers

NASA
@nasa
92.1M followers

Justin Bieber
@justinbieber
90.6M followers

KATY PERRY
@katyperry
87M followers

Taylor Swift
@taylorswift13
80.8M followers

Lady Gaga
@ladygaga
72.3M followers

Kim Kardashian
@kimkardashian
69.5M followers

Virat Kohli
@imvkohli
68.8M followers

YouTube
@youtube
68.6M followers

Bill Gates
@billgates
63.5M followers

The Ellen Show
@theellenshow
62.5M followers

CNN
@cnn
61.9M followers

Neymar Jr
@neymarjr
61.4M followers

X
@x
60.9M followers

Selena Gomez
@selenagomez
60.1M followers