

Top Tweets for #riskmonitor

Keeping an eye on the damn #RealRates and the #RiskMonitor while #SP500 futures are still down 0.85% overnight and the #VIX is up more than 4%.😌
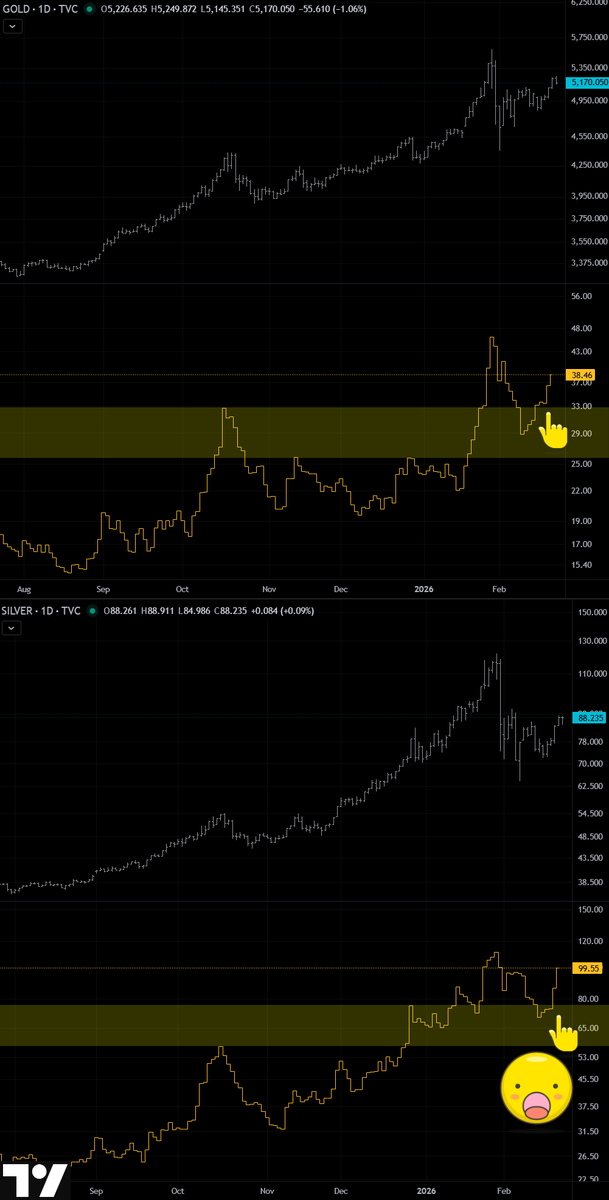
#Silver and the #miners are in a fragile spot, and a sudden spike in risk aversion would just ignite another flush.🙄


#RiskMonitor is in full optimism mode, with the #VIX sinking to new lows for this contract and every parameter pointing to prosperous times, peace, and tranquility.
Meanwhile, the #gold-to-#SP500 ratio is testing its descending trendline, quietly fantasizing about a surprise.😌


SECTOR RISK MONITOR — KW 23
In addition to today's weekly update.
Sector rotation across all categories.
Risk-on sold. Defensives held. Data in the monitor.
@TheBigCycleGame
Not financial advice. DYOR.
#SectorRotation #RiskMonitor #MacroAnalysis
#CIF #TheBigCycleGame

WEEKLY MACRO UPDATE — June 7, 2026
─────────────────
MARKETS
S&P 500
Close: 7,383
Weekly: -2.64%
First significant correction since late March
Structure: intact. No lower low formed.
The S&P 500 ended its nine-week winning streak
with its steepest one-day decline since October 2025.
Nasdaq
Close: 28,957
Weekly: -4.77%
Open gaps closed during the correction.
Structure: intact.
Friday marked the Nasdaq's worst single-day
performance since the tariff turmoil of April 2025.
Russell 2000
Close: 2,815
Weekly: -3.94%
Fakeout followed by retest of consolidation zone.
Structure: intact and following Dot-Com parallel.
Bitcoin: ~$62,000
Friday low: ~$59,000
Ethereum: ~$1,600
─────────────────
DOTCOM FRACTAL — STATUS
[Detailed update follows Monday]
All three indices remain within their
Dot-Com fractal structures.
No lower lows. No structural breaks.
The correction this week closed open gaps
on Nasdaq and S&P.
Whether this represents the shallow
consolidation visible in the Dot-Com structure
at this position, or simply a gap-close and flush,
will become clear in the coming days.
The Russell followed its own Dot-Com structure
with precision. Sticky throughout the week
due to momentum concentration in large caps.
Fakeout, retest of consolidation level,
structure maintained.
Target zones unchanged:
S&P 8,200 — 8,400 | Nasdaq 32,000 — 33,000
Russell 3,150 — 3,223.
─────────────────
THE PARABOLA — WHAT TEXTBOOK SAYS
The market is in a parabolic structure.
Parabolas are defined by accelerating momentum.
They do not pause for multi-month corrections
and then resume at a steeper angle.
That does not exist in documented market history.
What parabolas do:
they run until momentum exhausts.
Then they fall as fast as they rose.
The head-and-shoulders calls now emerging,
the summer lull predictions, the autumn top calls,
are structurally incompatible
with a running parabola.
Either the parabola is intact and runs further.
Or it is breaking, in which case
what follows is not a summer lull.
It is something larger.
─────────────────
SECTOR ROTATION — READING THE SIGNAL
The week produced a clear rotation signal.
SOXX Semiconductors: -10.44% on the week.
XLK Technology: -6.66%
IGV Software: -4.21%
Consumer Staples: +1.71%
Utilities: +0.93%
Healthcare: +0.61%
Financials: +0.21%
XLK/XLU spread: -7.53% on the week.
The market sold strong jobs data.
Same data that would have been
absorbed or ignored two months ago
is now interpreted as rate hike fuel.
Narratives follow price.
Not the other way around.
─────────────────
This could be read two ways.
First reading: capital is moving
from momentum into defensives.
Classic late-cycle behavior before a top.
The rotation into High Beta
may not materialize.
Second reading: this was a sentiment flush
driven by a temporary yield spike.
If one factor resolves,
Hormuz, inflation data, labor softness,
the narrative reverses
and momentum returns.
─────────────────
History offers a reference point.
In February and March 2007,
more than 25 subprime lenders declared bankruptcy.
The Dow lost 416 points in a single day.
New Century Financial, the largest US
subprime lender, filed for bankruptcy in April.
The S&P 500 made its all-time high
six months later, in October 2007.
The fractal was not finished.
The momentum was not finished.
The cycle absorbed the shock
and continued.
─────────────────
The Dot-Com fractal in 1999 and 2000
showed the same dynamic.
Rate hikes. Rising yields. Subprime warnings.
The market ran regardless
until the structure was complete.
From this perspective,
the sell-off this week could be
the sharp flush visible in the fractal
at this exact structural position.
Not a top. A reset before the final leg.
This is not a certainty.
But if the structure holds,
and if a catalyst emerges,
momentum has historically been strong enough
to override even significant fundamental warnings
in the final phase of a cycle.
The next few sessions will be telling.
─────────────────
THE NFP NARRATIVE vs. THE REALITY
Friday's selloff was attributed to a strong
jobs report. +172,000. Beat expectations.
The composition tells a different story.
Full-time jobs: -79,000 in May.
Part-time jobs: +251,000.
1.7 million full-time jobs lost since January 2025.
Last 12 months average: +59,000 per month.
Workforce: 159 million.
1999: +265,000 per month. Workforce: 128M.
2007: +93,000 per month. Workforce: 138M.
24% more workers today.
78% less job creation than 1999.
The headline beat the forecast.
The trend is a multi-year downtrend.
Both inflation and labor market data
are lagging indicators.
They confirm where the economy has been.
In 1999, the Fed raised rates six times.
The market kept running regardless.
─────────────────
GEOPOLITICS
Trump notably quieter than usual this week.
No major announcements. No escalation.
Subdued communication for his standards.
This is worth watching.
On April 9, 2025, a similar quiet period
preceded the 90-day tariff pause announcement.
The S&P surged 9.52% and the Nasdaq 12.16%
on that single day.
If a similar announcement is approaching,
whether on Iran, trade, or another front,
the market reaction could provide
the final fuel for the parabola's last phase.
Trump's restraint may signal
that something significant is being negotiated.
Conclusion pending confirmation.
─────────────────
CRYPTO
Bitcoin: ~$62,000. Friday low: ~$59,000.
Ethereum: ~$1,600.
The selloff from June 1 was more controlled
than a typical capitulation flush.
Pressure eased progressively through the week.
On-chain data shows significant liquidations.
Over $4 billion in a single week.
More Bitcoin holders are currently
in loss than in profit.
Total2 sitting on a long-term support trendline
that has held since approximately 2020.
Total between the 200 and 300-week moving averages.
A test of the 300-week MA from here is plausible.
Isolated in a crypto-only framework,
the bear market narrative is structurally valid.
In the macro context, we are at maximum divergence.
Traditional markets showing rotation signals.
Crypto showing capitulation signals.
Both simultaneously.
The reaction next week in traditional markets,
and how Bitcoin responds to the $59,000 zone or a deeper one,
will be the most important signals
of the coming weeks.
─────────────────
NEXT WEEK
US CPI data: Wednesday.
Expectation: 4.0 — 4.2%.
Fed meeting: June 16 — 17. First under Warsh.
SpaceX roadshow begins.
─────────────────
BOTTOM LINE
First meaningful correction since March.
Structure intact across all three indices.
No lower lows. Gaps closed.
Parabola running. Momentum trade rotating.
Full-time jobs declining while headlines beat.
Trump quiet. Geopolitical catalyst possible.
Crypto at maximum fear while equities correct.
Divergence at historical extremes.
The fractal says where we are.
The rotation confirms what is shifting.
The next few days will determine
whether this was a flush or a turn.
CIF: 82/90 — WARNING LEVEL ORANGE.
@TheBigCycleGame
Not financial advice. DYOR.
#WeeklyUpdate #MacroAnalysis #SPX
#Nasdaq #Russell2000 #DotComFractal
#CIF #EndCycle #Bitcoin #Crypto
#NFP #SectorRotation #Parabola #SpaceX
![TheBigCycleGame's tweet photo. WEEKLY MACRO UPDATE — June 7, 2026
─────────────────
MARKETS
S&P 500
Close: 7,383
Weekly: -2.64%
First significant correction since late March
Structure: intact. No lower low formed.
The S&P 500 ended its nine-week winning streak
with its steepest one-day decline since October 2025.
Nasdaq
Close: 28,957
Weekly: -4.77%
Open gaps closed during the correction.
Structure: intact.
Friday marked the Nasdaq's worst single-day
performance since the tariff turmoil of April 2025.
Russell 2000
Close: 2,815
Weekly: -3.94%
Fakeout followed by retest of consolidation zone.
Structure: intact and following Dot-Com parallel.
Bitcoin: ~$62,000
Friday low: ~$59,000
Ethereum: ~$1,600
─────────────────
DOTCOM FRACTAL — STATUS
[Detailed update follows Monday]
All three indices remain within their
Dot-Com fractal structures.
No lower lows. No structural breaks.
The correction this week closed open gaps
on Nasdaq and S&P.
Whether this represents the shallow
consolidation visible in the Dot-Com structure
at this position, or simply a gap-close and flush,
will become clear in the coming days.
The Russell followed its own Dot-Com structure
with precision. Sticky throughout the week
due to momentum concentration in large caps.
Fakeout, retest of consolidation level,
structure maintained.
Target zones unchanged:
S&P 8,200 — 8,400 | Nasdaq 32,000 — 33,000
Russell 3,150 — 3,223.
─────────────────
THE PARABOLA — WHAT TEXTBOOK SAYS
The market is in a parabolic structure.
Parabolas are defined by accelerating momentum.
They do not pause for multi-month corrections
and then resume at a steeper angle.
That does not exist in documented market history.
What parabolas do:
they run until momentum exhausts.
Then they fall as fast as they rose.
The head-and-shoulders calls now emerging,
the summer lull predictions, the autumn top calls,
are structurally incompatible
with a running parabola.
Either the parabola is intact and runs further.
Or it is breaking, in which case
what follows is not a summer lull.
It is something larger.
─────────────────
SECTOR ROTATION — READING THE SIGNAL
The week produced a clear rotation signal.
SOXX Semiconductors: -10.44% on the week.
XLK Technology: -6.66%
IGV Software: -4.21%
Consumer Staples: +1.71%
Utilities: +0.93%
Healthcare: +0.61%
Financials: +0.21%
XLK/XLU spread: -7.53% on the week.
The market sold strong jobs data.
Same data that would have been
absorbed or ignored two months ago
is now interpreted as rate hike fuel.
Narratives follow price.
Not the other way around.
─────────────────
This could be read two ways.
First reading: capital is moving
from momentum into defensives.
Classic late-cycle behavior before a top.
The rotation into High Beta
may not materialize.
Second reading: this was a sentiment flush
driven by a temporary yield spike.
If one factor resolves,
Hormuz, inflation data, labor softness,
the narrative reverses
and momentum returns.
─────────────────
History offers a reference point.
In February and March 2007,
more than 25 subprime lenders declared bankruptcy.
The Dow lost 416 points in a single day.
New Century Financial, the largest US
subprime lender, filed for bankruptcy in April.
The S&P 500 made its all-time high
six months later, in October 2007.
The fractal was not finished.
The momentum was not finished.
The cycle absorbed the shock
and continued.
─────────────────
The Dot-Com fractal in 1999 and 2000
showed the same dynamic.
Rate hikes. Rising yields. Subprime warnings.
The market ran regardless
until the structure was complete.
From this perspective,
the sell-off this week could be
the sharp flush visible in the fractal
at this exact structural position.
Not a top. A reset before the final leg.
This is not a certainty.
But if the structure holds,
and if a catalyst emerges,
momentum has historically been strong enough
to override even significant fundamental warnings
in the final phase of a cycle.
The next few sessions will be telling.
─────────────────
THE NFP NARRATIVE vs. THE REALITY
Friday's selloff was attributed to a strong
jobs report. +172,000. Beat expectations.
The composition tells a different story.
Full-time jobs: -79,000 in May.
Part-time jobs: +251,000.
1.7 million full-time jobs lost since January 2025.
Last 12 months average: +59,000 per month.
Workforce: 159 million.
1999: +265,000 per month. Workforce: 128M.
2007: +93,000 per month. Workforce: 138M.
24% more workers today.
78% less job creation than 1999.
The headline beat the forecast.
The trend is a multi-year downtrend.
Both inflation and labor market data
are lagging indicators.
They confirm where the economy has been.
In 1999, the Fed raised rates six times.
The market kept running regardless.
─────────────────
GEOPOLITICS
Trump notably quieter than usual this week.
No major announcements. No escalation.
Subdued communication for his standards.
This is worth watching.
On April 9, 2025, a similar quiet period
preceded the 90-day tariff pause announcement.
The S&P surged 9.52% and the Nasdaq 12.16%
on that single day.
If a similar announcement is approaching,
whether on Iran, trade, or another front,
the market reaction could provide
the final fuel for the parabola's last phase.
Trump's restraint may signal
that something significant is being negotiated.
Conclusion pending confirmation.
─────────────────
CRYPTO
Bitcoin: ~$62,000. Friday low: ~$59,000.
Ethereum: ~$1,600.
The selloff from June 1 was more controlled
than a typical capitulation flush.
Pressure eased progressively through the week.
On-chain data shows significant liquidations.
Over $4 billion in a single week.
More Bitcoin holders are currently
in loss than in profit.
Total2 sitting on a long-term support trendline
that has held since approximately 2020.
Total between the 200 and 300-week moving averages.
A test of the 300-week MA from here is plausible.
Isolated in a crypto-only framework,
the bear market narrative is structurally valid.
In the macro context, we are at maximum divergence.
Traditional markets showing rotation signals.
Crypto showing capitulation signals.
Both simultaneously.
The reaction next week in traditional markets,
and how Bitcoin responds to the $59,000 zone or a deeper one,
will be the most important signals
of the coming weeks.
─────────────────
NEXT WEEK
US CPI data: Wednesday.
Expectation: 4.0 — 4.2%.
Fed meeting: June 16 — 17. First under Warsh.
SpaceX roadshow begins.
─────────────────
BOTTOM LINE
First meaningful correction since March.
Structure intact across all three indices.
No lower lows. Gaps closed.
Parabola running. Momentum trade rotating.
Full-time jobs declining while headlines beat.
Trump quiet. Geopolitical catalyst possible.
Crypto at maximum fear while equities correct.
Divergence at historical extremes.
The fractal says where we are.
The rotation confirms what is shifting.
The next few days will determine
whether this was a flush or a turn.
CIF: 82/90 — WARNING LEVEL ORANGE.
@TheBigCycleGame
Not financial advice. DYOR.
#WeeklyUpdate #MacroAnalysis #SPX
#Nasdaq #Russell2000 #DotComFractal
#CIF #EndCycle #Bitcoin #Crypto
#NFP #SectorRotation #Parabola #SpaceX](https://pbs.twimg.com/media/HKM6YnwXIAAf3Tz.jpg)
#RiskMonitor is flashing signs of growing tension across the board...😌
#IranWar #Hormuz #VIX #RiskAversion

#RiskMonitor update.
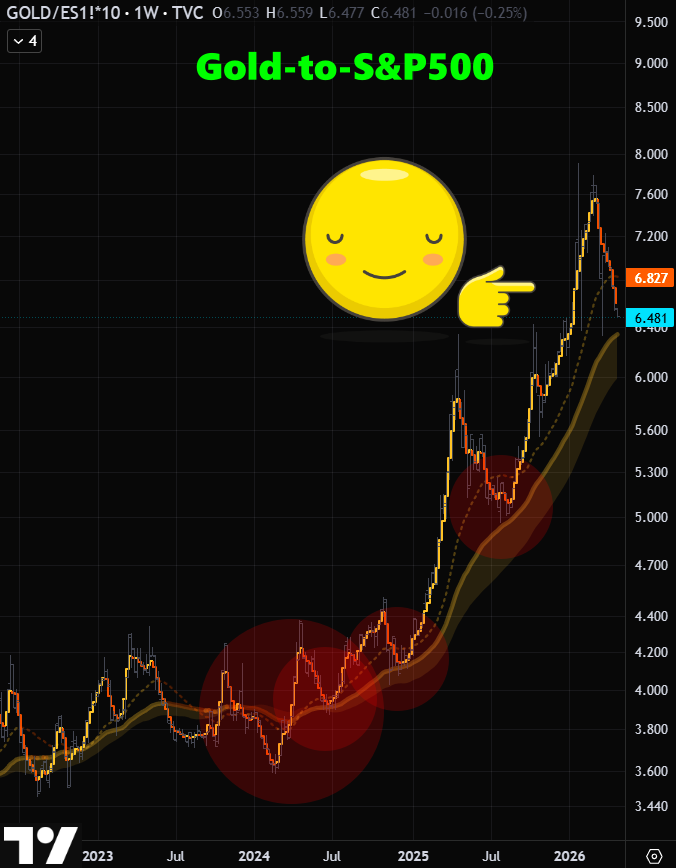
The relentless rise in #SP500, coupled with sliding #gold prices, is pushing the gold-to-S&P 500 ratio to fresh lows on lower timeframes. 🥲
And yet, on the weekly chart, this still looks like a reasonable correction within the phenomenal upleg from 2023.☺️
Keep your eyes on the ball. 😌
#PreciousMetals #Inflation #RealMoney #PurchasingPower


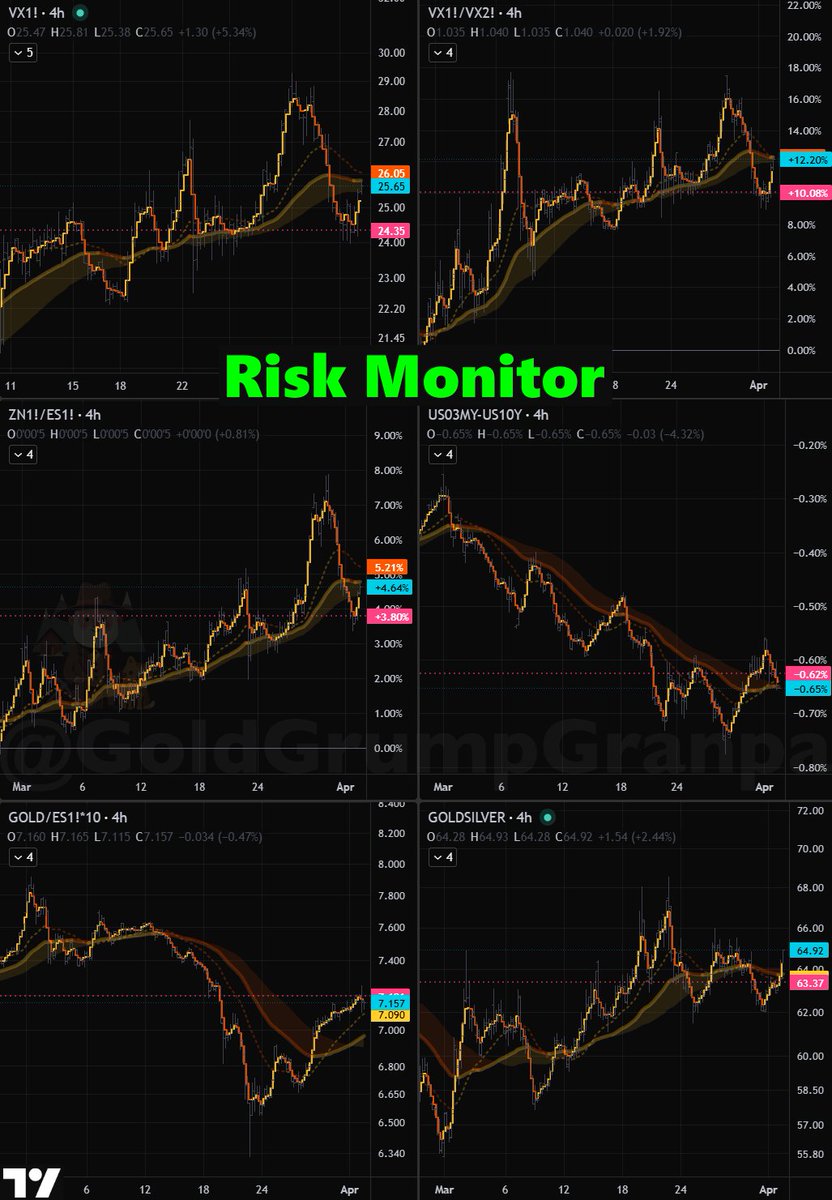
#RiskMonitor signaling the most tranquil environment since the start of the #IranWar and the choking of the #Hormuz Strait. ☺️
It makes sense to see some kind of #VIX repricing here going into an enigmatic weekend: you never know, and long #equities love a bit of insurance. 😌

#RiskMonitor: we are one headline away from either a full meltdown or a meaningful easing of tensions, so charts carry less weight right now. Still, I find it useful to keep this kind of broad framework in mind, if only to avoid chasing extended moves or selling in fear right when a rational approach would call for buying. ☺️
Of course, given the extraordinarily tense and dangerous environment we’re in, anything can happen at any moment, even more than usual. 😌
#IranWar #C130 #Volatility #VIX #SP500

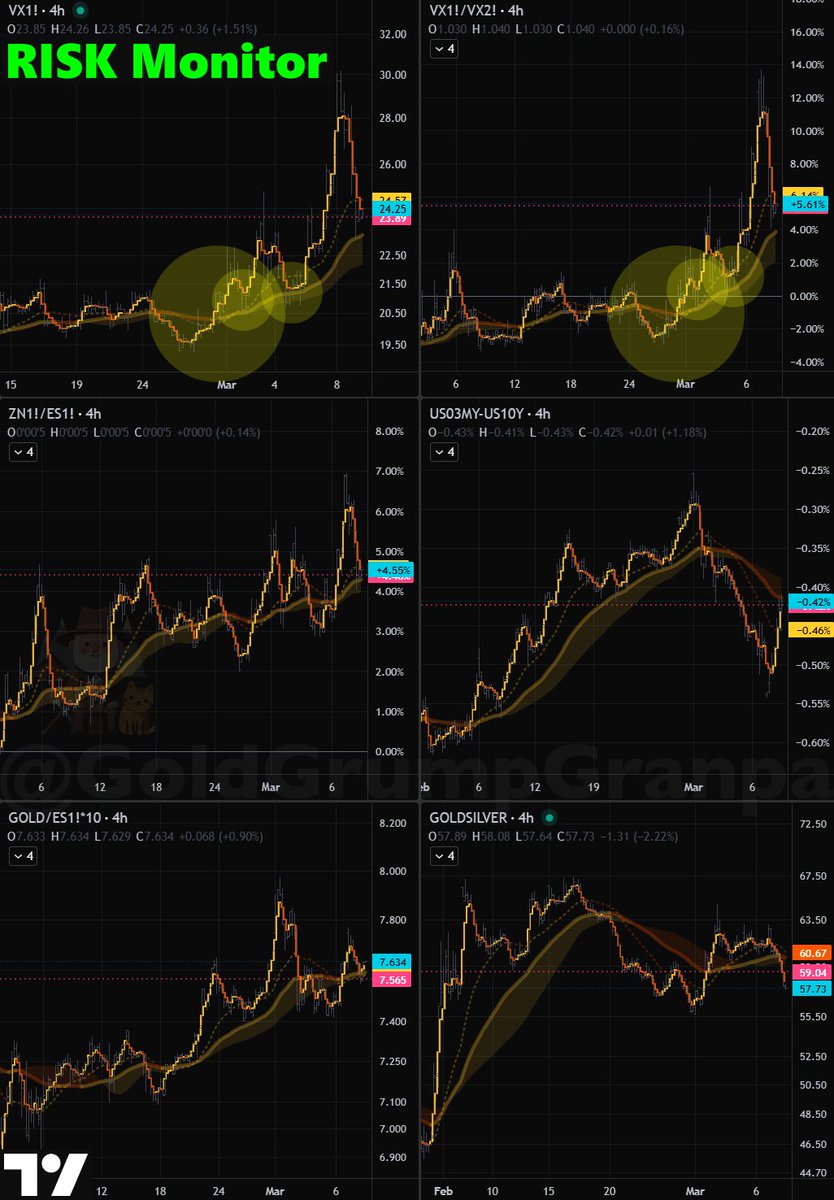
#RiskMonitor: Keep a vigilant eye on your #risk parameters, because these market conditions can be lethal if you do not manage size prudently. 😌
#VIX #RiskManagement #IranWar #Iran #OilPrices
RiskMonitor: #VIX is up 10%, flirting with 30, and the term structure, already in backwardation, is up another 2.5%, now at +18%.
The real elephant in the room is the US 3mo-10y spread, free-falling amid these tense, dangerous, flat-out crazy geopolitical conditions. 😵
#IranWar

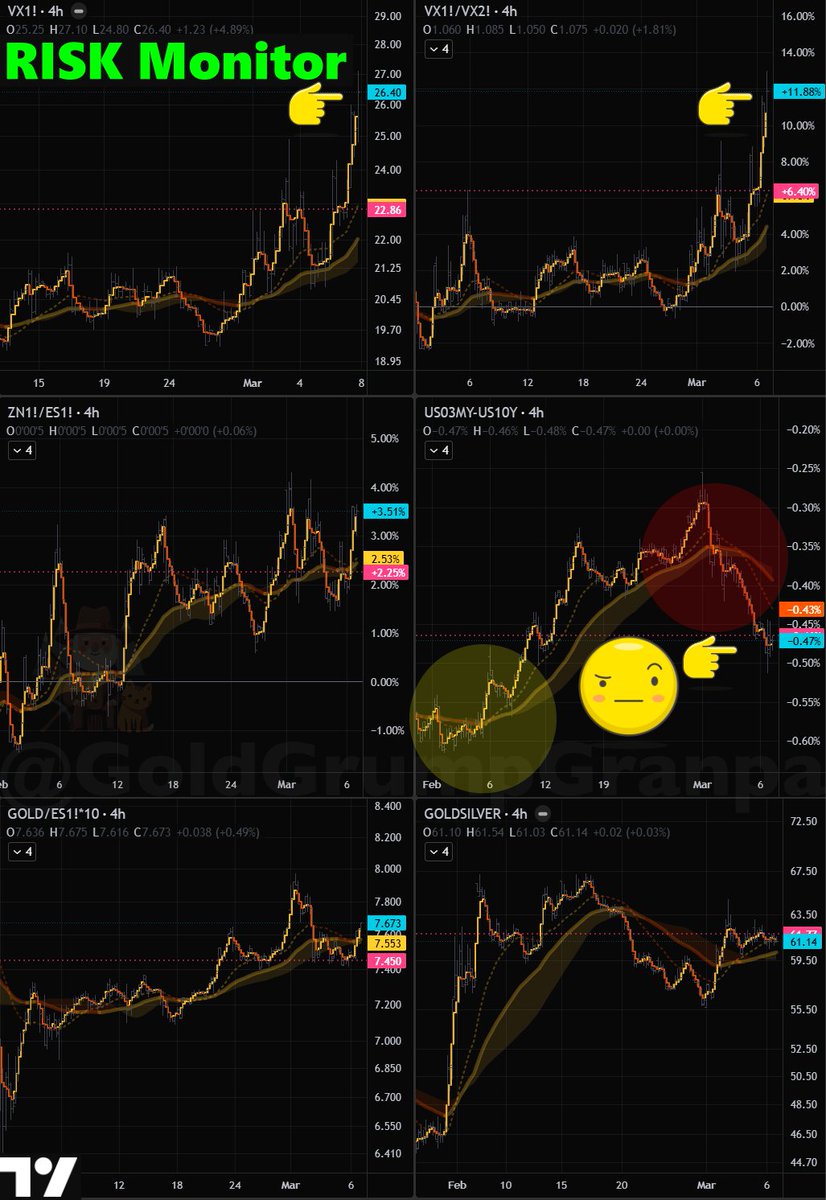
#RiskMonitor showing last week’s evolution in greater detail, with #VIX futures closing at 26.40 and the term structure steepening sharply.
Did you buy your insurance when it was cheap?😉
The most notable quadrant is the 3-month vs 10-year Treasury yield spread, which closed sharply lower after the gap up at the open. You would normally expect the opposite in a #RiskOff spike, but there has been no rush into #Treasuries this time. A very notable deviation from the classic risk-aversion script. 🤔
They are rushing to sell #TNotes with #VIX up nearly 30% on the week… I guess financing that $1.5T in #MilitarySpending won’t be so easy this time around. 😅
#Inflation #Iran #War
Find the #risk metrics that best fit your style and your portfolio composition, but track and monitor risk relentlessly, not only when things get tense like now, but before the facts. You want to buy your insurance when it’s cheap. 😉
#RiskMonitor #VIX #SP500 #Volatility #KOSPI

Find the #risk metrics that best fit your style and your portfolio composition, but track and monitor risk relentlessly, not only when things get tense like now, but before the facts. You want to buy your insurance when it’s cheap. 😉
#RiskMonitor #VIX #SP500 #Volatility #KOSPI
#CBOE #silver and #gold #volatility remain elevated and rising. 😵
Not only that… #VIX and #RiskAversion in general markets are rising too. Definitely keep an eye on this. 🫣
#GVZ #VXSLV #Index #ETF #RiskMonitor

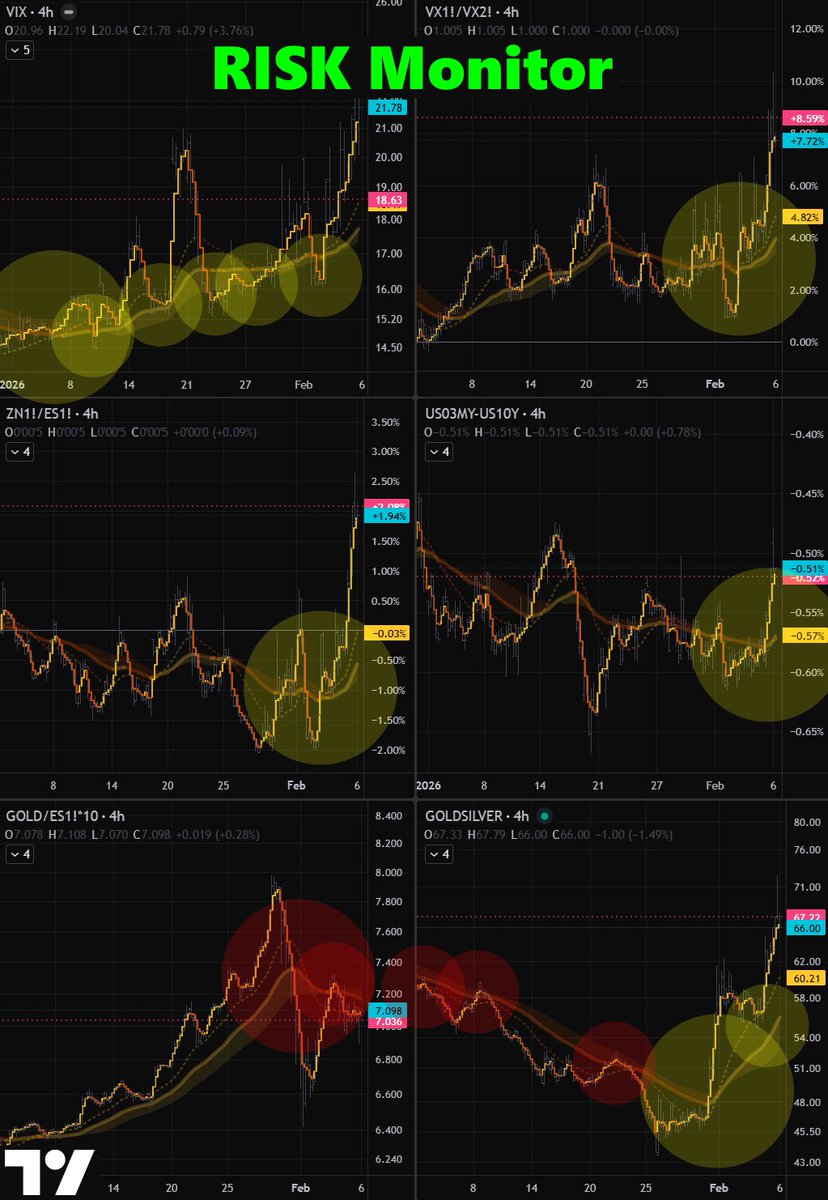
Always keep an eye on the #RiskMonitor: the temperature is slowly, stealthily, relentlessly rising. You do not want to be overexposed without proper insurance if things suddenly accelerate the wrong way. ���
Insurance is a cost to protect your precious sleep. 😌
#VIX #SP500

#RiskMonitor eased a bit, with the main metrics reverting to rising averages. #VIX is curling down after clearing the prior high, but tension remains elevated, even if almost stealthily. 😌
#Volatility #Treasuries #SP500 #GSR
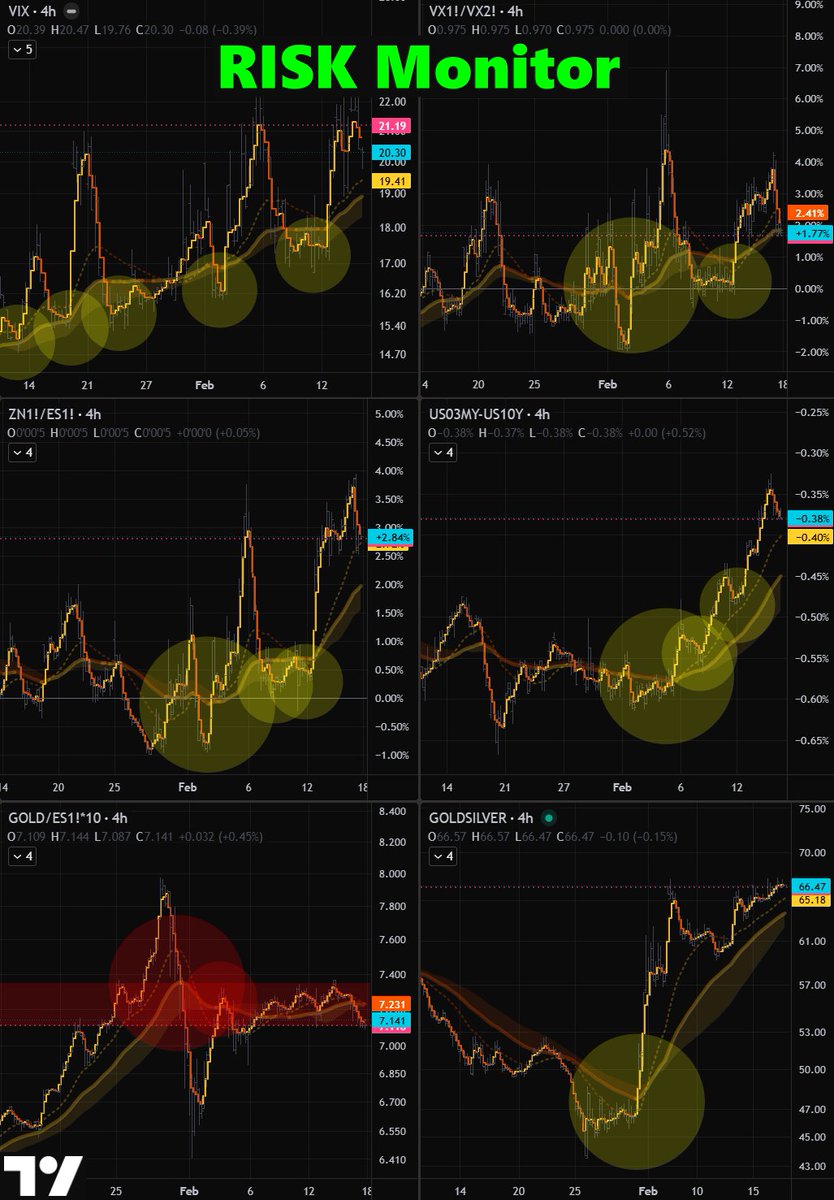
#RiskMonitor eased a bit, with the main metrics reverting to rising averages. #VIX is curling down after clearing the prior high, but tension remains elevated, even if almost stealthily. 😌
#Volatility #Treasuries #SP500 #GSR
#RiskMonitor: the only panel out of six that is not rising is the #gold-to-#SP500 ratio. 😑
#Risk #Volatility #MarketStructure #MiddleEast

#RiskMonitor shows some subtle, not so subtle tension across the board. 🤨
#VX futures above 21, all quadrants pushing higher.
Did you buy your #insurance when it was cheap last week? 😌
#Volatility #RiskAversion #SP500

Keep an eye on the #RiskMonitor and do not lose your shirt over a silly #NFP release. 😉
Most blowups come down to one thing: excessive position sizing.
#Trading #VIX #RiskManagement #Volatility

My #RiskMonitor is built so that when charts are trending higher, risk is rising. 😌
It breaks risk and volatility down through multiple lenses: #VIX futures and their term structure (VX1/VX2), the ratio of #Treasuries to the #SP500, the 3m–10y spread, and the ratios of gold versus the S&P 500 and #silver. 🤓
Even the gold-to-ES ratio in the lower left corner, correcting from a vicious 8 to around 7 and apparently ready to enter a short-term downtrend, remains quite elevated compared to a month ago.
Basically, all quadrants are whispering old stories about risk and insurance.
Do not dismiss them. 🤠

Last Seen Hashtags on Sotwe
Most Popular Users

Elon Musk 
@elonmusk
240.7M followers

Barack Obama
@barackobama
119.2M followers

Donald J. Trump
@realdonaldtrump
111.7M followers

Cristiano Ronaldo
@cristiano
110.9M followers

Narendra Modi
@narendramodi
107M followers

Rihanna
@rihanna
97.7M followers

NASA
@nasa
92.2M followers

Justin Bieber
@justinbieber
91M followers

KATY PERRY
@katyperry
87.8M followers

Taylor Swift
@taylorswift13
81.7M followers

Lady Gaga
@ladygaga
73.2M followers

Virat Kohli
@imvkohli
70.1M followers

Kim Kardashian
@kimkardashian
69.9M followers

YouTube
@youtube
68.7M followers

Bill Gates
@billgates
64M followers

Neymar Jr
@neymarjr
62.9M followers

The Ellen Show
@theellenshow
62.4M followers

CNN
@cnn
61.9M followers

Selena Gomez
@selenagomez
60.9M followers

X
@x
60.8M followers