🎉 Exciting News! Myself, Daisy Jones and Jess Hancocks new book, Tableau Certified Data Analyst Certification Guide, is out today! 📚✨
Huge thanks to @PacktPublishing, for their amazing support! 🙏
https://t.co/33djkBy0rs
#Tableau#DataAnalytics#Certification#NewRelease
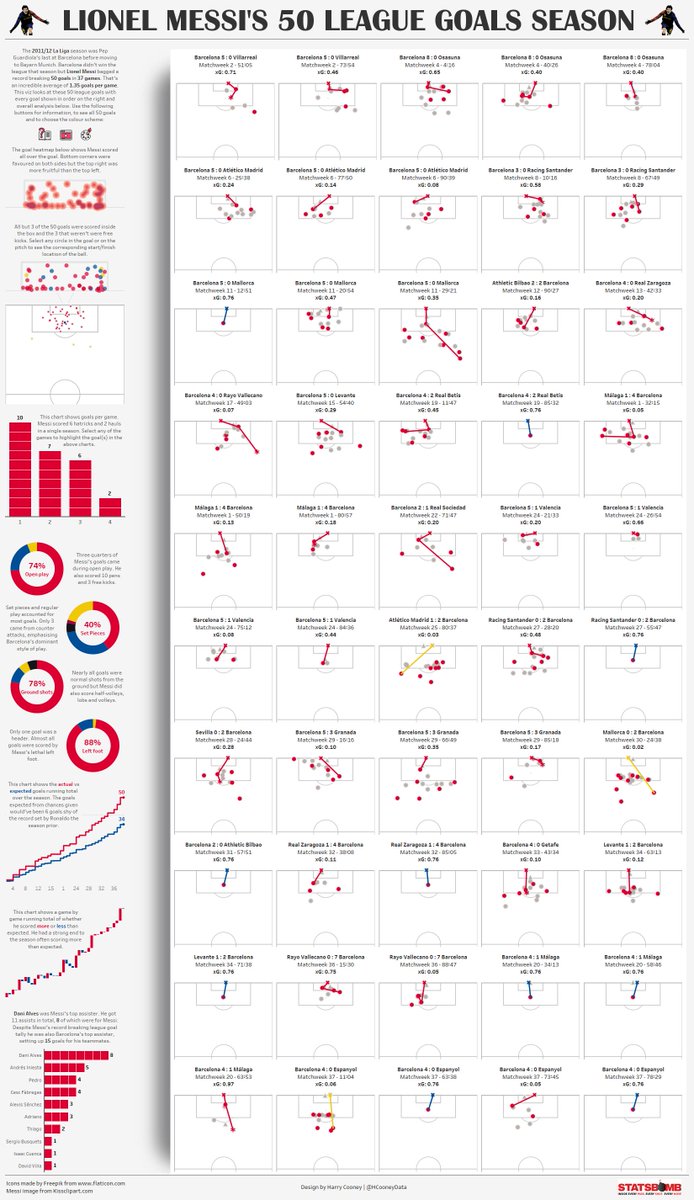
I've visualized the GOAT's 50 La Liga goals in a single season for my first #IronQuest and #SportVizSunday.
Each of the 50 goals is shown along with some overall analysis.
Here's the interactive version: https://t.co/s8Azy5yY2l
Here's my viz looking at some fake Twitter ad campaigns data.
Thanks @SParsonsDataViz for the advanced tables tutorial and Murilo Cremon for the design inspiration.
https://t.co/thixyu9HKf
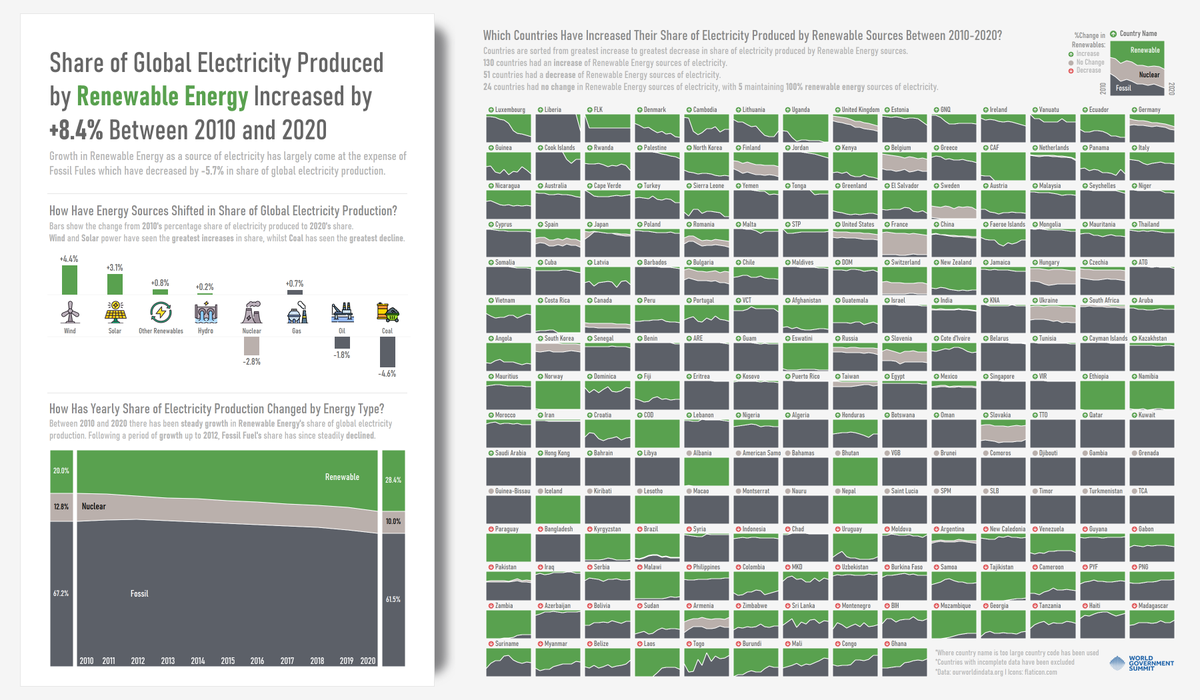
Here's my World Data Viz comp submission looking at the share of global electricity produced by renewables between 2010 and 2020.
I had to change the font for Tableau Public but also added some interactivity:
https://t.co/w4C9Vo8cOS
#PowerBI Report for #MakeoverMonday week 47 using #Deneb for the first time.
The UK's Rail Infrastructure Ranks Poorly & is Getting Worse!
https://t.co/mbB7pkMYeJ