Didn't know this guy was a joke...then I listened to this.
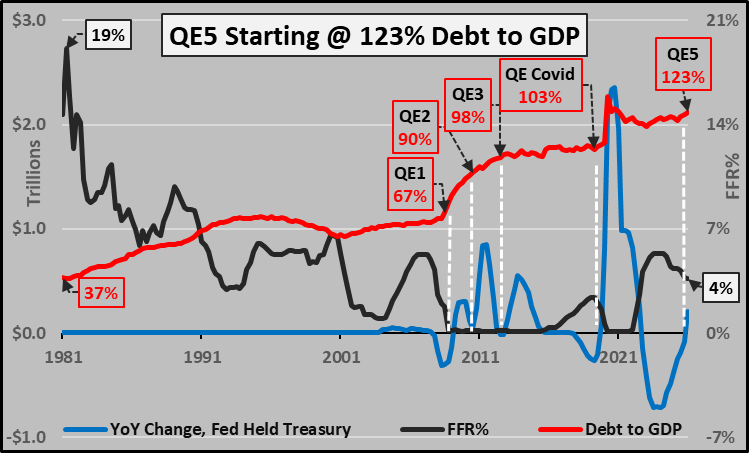
Since Dec 10th, 2025, the Fed has added $232 billion in US Treasury's to its balance sheet (total balance sheet growth is masked by Fed's ongoing sales of $15 billion monthly in MBS, which Fannie/Freddie in turn buy $15 billion monthly)...there is nothing misunderstood about another round of QE, which is now underway...starting at the highest level of debt to GDP yet. To suggest this isn't monetization...silly.
INSTEAD OF WATCHING NETFLIX TONIGHT
Spend 30 minutes with this.
A speech by the Head of Anthropic's Coding Agents research team that teaches you more about vibe coding than 100 paid courses ever could.
This is not a tutorial.
This is the person who actually builds the system explaining how it works from the inside.
Most people learning to vibe code are learning the surface.
This goes underneath it.
30 minutes tonight.
The people who watch this will build differently tomorrow.
Completely free.
Bookmark this before you open Netflix 👇
BREAKING: The Federal Reserve reported an operating loss of -$18.7 billion in 2025, marking its 3rd consecutive annual loss.
This brings the total 3-year loss to -$210.3 billion after the -$77.6 billion recorded in 2024 and -$114.0 billion in 2023.
The losses are primarily driven by the Fed paying out more in interest to banks and money market funds than it earns from its bond and MBS holdings.
Since the losses began in September 2022, the Fed has stopped remitting income to the Treasury Department, ending a streak that totaled +$1.36 trillion since 2008.
However, the Fed cannot become insolvent because it quite literally creates its own money.
Truly incredible.
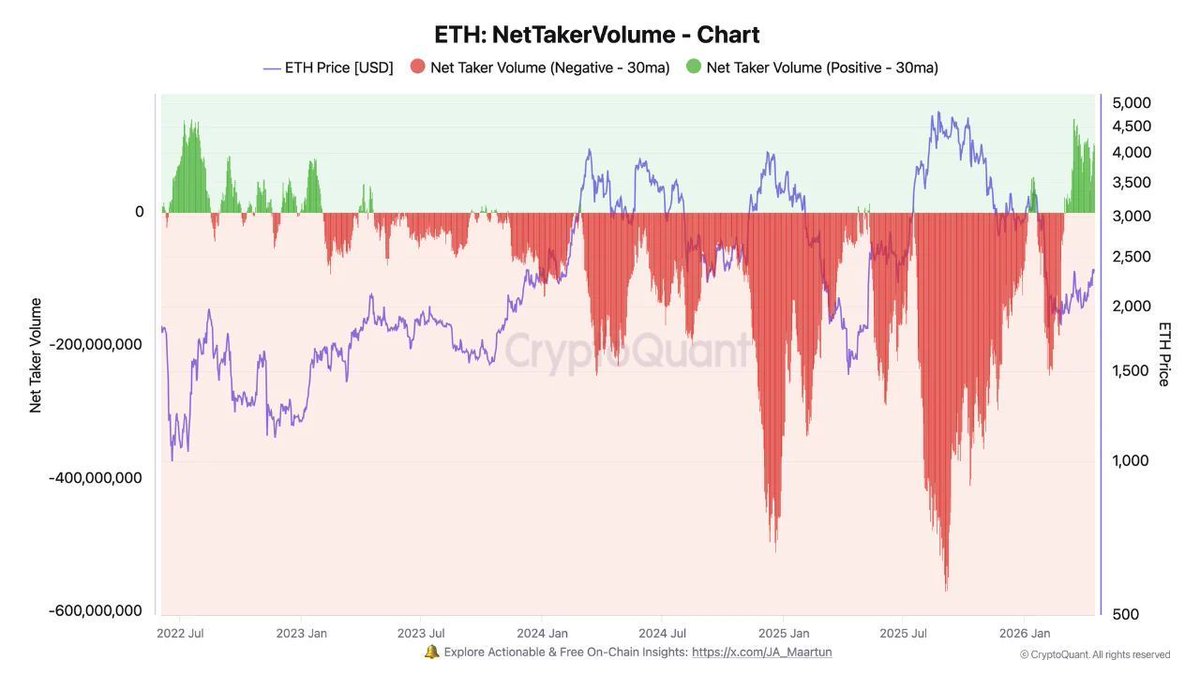
ETH IS SHOWING A DIFFERENT BEHAVIOR NOW
For the first time this cycle, buyers are absorbing supply and pushing price.
If this holds, this is early recovery territory.
📸 Darkfost
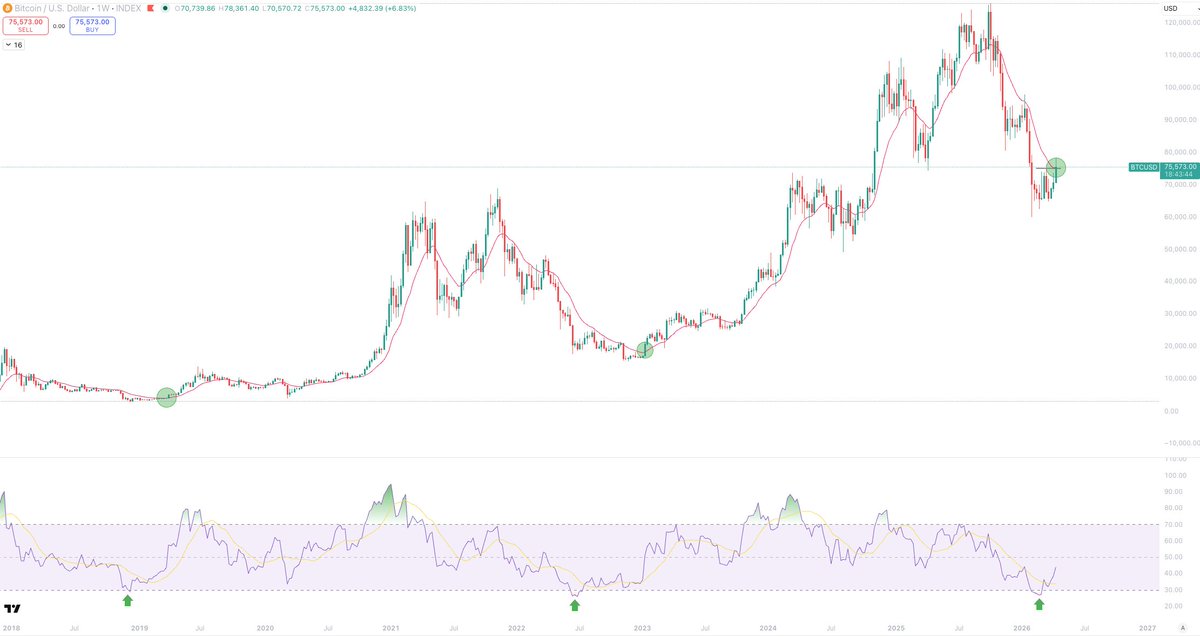
This weekly close is the most important one in a very long time.
Right now, Bitcoin has closed above the 1D 100EMA and retested in, for the first time since the top.
Every time it has done this, after the 1W RSI has reached oversold, it has marked the bottom.
We are also above the very important level of $74,400, which HTF bullish structure and the 2025 low.
If we close above that, its bullish.
If we close above both that and the 100D EMA, even more so
If we close below $74,400 it will confirm weakness, a SFP, and it will be pretty bearish.
I'll be looking for local shorts at that stage and evaluating the next levels of interested support.
Keep it simple guys.
PRESIDENT TRUMP SAID, “INSTEAD OF ATTACKING INDUSTRIES OF THE FUTURE, WE WILL EMBRACE THEM, INCLUDING MAKING AMERICA THE WORLD CAPITAL FOR CRYPTO AND BITCOIN.” 🔥
BULLISH 🚀
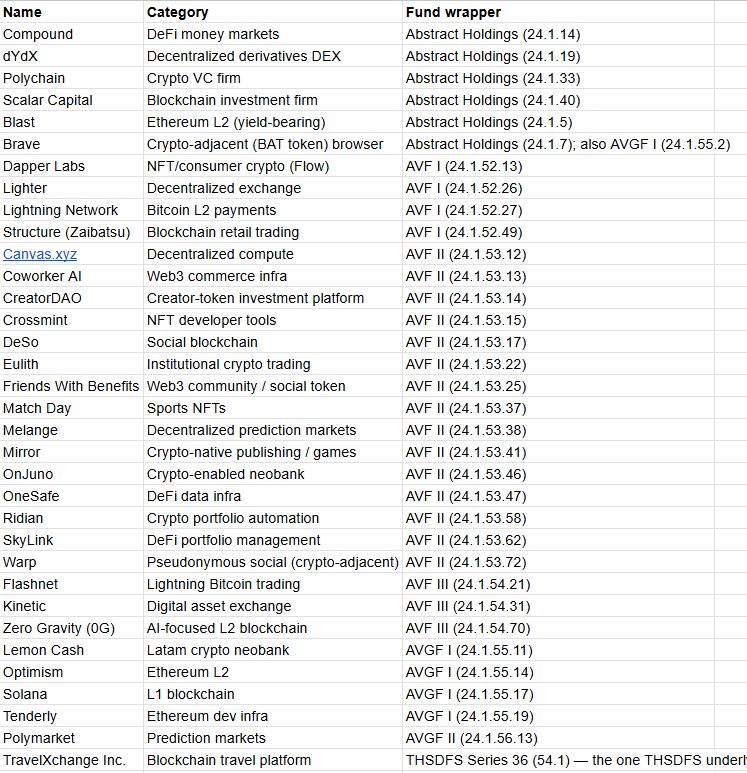
Kevin Warsh owns 30+ crypto projects and youre brearish
the next Fed Chair's disclosure includes: Solana, Optimism, Blast, Compound, dYdX, Polychain, Scalar Capital, Lightning Network, Lighter
the next Fed Chair is more degen than you
⚠️ DER CHART DEN NIEMAND SEHEN DARF!
Drei Crashes. 30 Jahre. Dasselbe Muster - und es formt sich gerade zum vierten Mal.
Du scrollst durch deinen Feed. Zwischen Memes und Meinungen taucht ein Chart auf. Drei Panels.
S&P 500 oben.
Zinskurve in der Mitte.
Fed Funds Rate unten.
30 Jahre Marktgeschichte auf einen Blick.
Du schaust genauer hin.
Und dann siehst du es.
Vor jedem großen Einbruch der letzten drei Jahrzehnte hat sich dasselbe Setup abgespielt. Jedes. Einzelne. Mal.
Neue Allzeithochs. Die Zinskurve invertiert, entinvertiert sich. Die Fed beginnt zu senken.
2000. Dotcom-Blase. Minus 51%.
2008. Finanzkrise. Minus 58%.
2020. Pandemie. Minus 35%.
Drei von drei.
@MarketMike hat diesen Chart am Sonntag gepostet. Seine Worte: "Ich tu nicht so als wüsste ich was passiert. Ich finde nur interessante Muster im Markt."
CT hat sofort reagiert.
@drmunaalshaikh: "Klassische Spätzyklusfalle. Smart Money jagt nicht hinterher. Die positionieren sich."
@MarchandCorne geht weiter. Nennt ein konkretes #Bitcoin Ziel - $40.000. Seine Logik: In akuten Liquiditätskrisen blutet BTC als Erstes.
Jetzt schau auf die Zahlen von heute.
S&P 500 bei 6.816. Nah am Allzeithoch. Die Zinskurve - nach der längsten und tiefsten Inversion seit Jahrzehnten - gerade erst wieder positiv. 10Y-2Y Spread bei +0,51%. Die Fed senkt die Zinsen vom höchsten Stand seit 2007.
Dieselbe Sequenz. Zum vierten Mal.
Der Nasdaq hat seit Oktober bereits 8,6% verloren. 3 Billionen Dollar Marktkapitalisierung - weg. Bisher nur die Vorspeise.
@MarketMike hat in derselben Woche noch einen zweiten Chart gebracht. Die 12-Monats-Veränderungsrate beim Ölpreis - über 91%.
Sein Kommentar: "Jeder einzelne Spike in dieser Größenordnung hat dazu geführt, dass etwas gebrochen ist." Von 1987 über die Dotcom-Blase bis 2022 - jedes Mal hat danach etwas nachgegeben.
CT wird nervös. Rezessions-Erwähnungen auf X sind in einer Woche um 30% gestiegen. Rezessions-Creators um 32%. Mehr als Rauschen - das nimmt Fahrt auf.
@MarketMike selbst warnt: "Bärenmärkte fallen nicht geradeaus. Sie kommen in Wellen. Jede einzelne trickst die Leute aus - sie glauben der Boden ist drin."
Jetzt die Frage, die auf CT kaum jemand stellt.
Was passiert mit $BTC, wenn der Aktienmarkt tatsächlich um 30 bis 50% korrigiert?
2020 hat Bitcoin erst 50% verloren. Dann über 600% Rallye. Aber die Struktur hat sich seitdem komplett verändert. Milliarden in ETF-Zuflüssen. Institutionelles Kapital, das nicht in Panik verkauft. Gold auf neuen Allzeithochs - und historisch rotiert Smart Money mit 3 bis 6 Monaten Verzögerung von Gold in Bitcoin.
Falls der Aktienmarkt crasht, ist Krypto kurzfristig mit drin. Aber genau in diesem Moment beginnt die Rotation - und die war historisch jedes Mal brutal profitabel.
Dieser Chart hat dreimal recht behalten. Er zeigt gerade exakt dasselbe.
Klar - "diesmal ist es anders." Das sagen sie jedes Mal.
Lass uns das gemeinsam beobachten - Abonniere rein 🤝
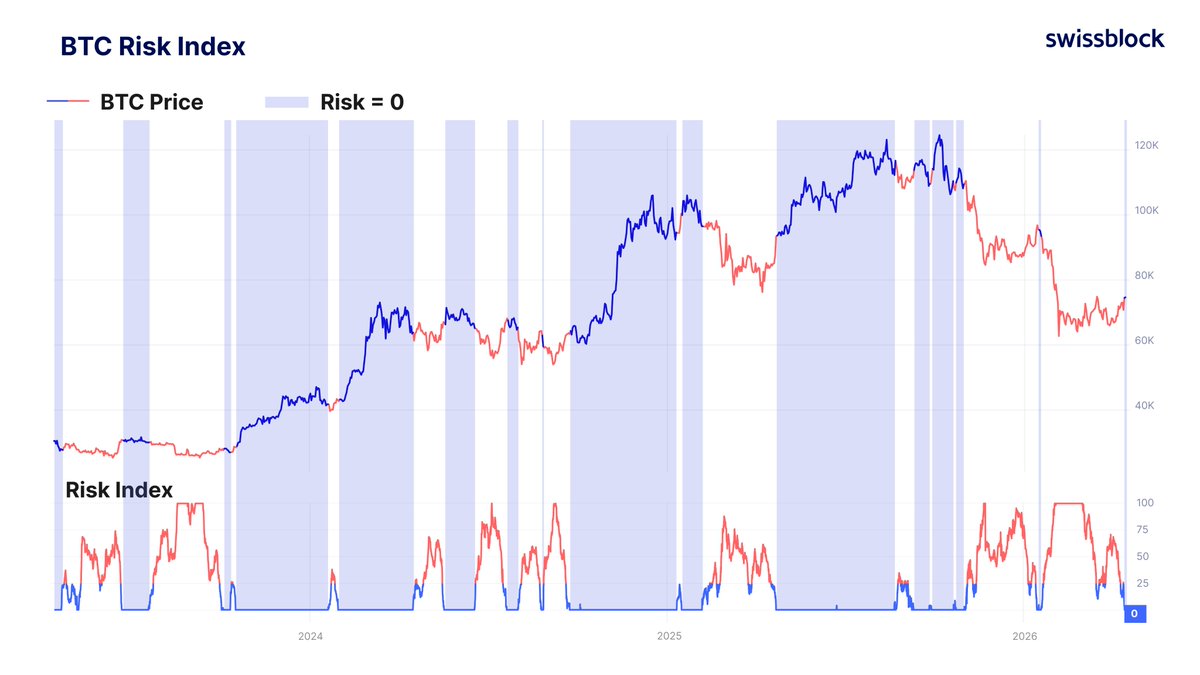
Bitcoin Risk Index just hit 0, a full low-risk regime.
Historically, these zones mark where selling pressure is fully exhausted and bullish structure can begin to rebuild.
But it is crucial to understand:
this is where bottoming completes, not where expansion begins.
Next step?
Stabilization inside the low-risk regime, and bulls absorbing any remaining selling pressure.
$2 BILLION BSTR CEO ADAM BACK SAYS HE WILL BUY UP TO $1,500,000,000 WORTH OF #BITCOIN THIS MONTH
THAT'S 21,000 BTC LEAVING THE MARKET IN DAYS
SAYLOR'S PLAYBOOK IS SPREADING 🚀
One of the coolest graph ever in all history of Bitcoin. Watch the Veritasium video in the comments to understand the general significance of what is described below.
What it is: At each of the 4,084 consecutive data points, we have a vector Fᵢ = (Δlog t, Δlog P) — just the step the price takes in log-log space. We normalize these to unit direction vectors, then interpolate them onto a regular 40×40 grid across the (log t, log P) plane using scattered data interpolation.
The curl is then computed numerically on that grid:
curl(F) = ∂Fy/∂x − ∂Fx/∂y
Red regions mean the field locally rotates counterclockwise — price is accelerating upward relative to what the field direction would suggest, like the leading edge of a bull run.
Blue regions mean clockwise rotation — price decelerating, bear market structure.
What's striking is the pattern isn't random noise — there's clear spatial structure.
The red and blue regions are organized relative to the power law line (gold), with a tendency for red above and blue below in certain time periods.
This is the rotational component that the Helmholtz decomposition will isolate — the part that represents the boom-bust cycling around the power law attractor rather than motion toward or away from it.
So much for a hawkish incoming Fed chair.
A Fed–Treasury accord that’s about to fundamentally reshape interest rates.
None of us own enough hard assets.
H/t @zerohedge