Austin resale market update:
We have said this over and over, and I want to say it again clearly: we have never called this a recovery. Activity can bounce. Weekly numbers can wiggle. Some neighborhoods can feel more stable than others. But stability is not the same thing as recovery, and the data continues to argue that Austin resale housing is still working through a market adjustment rather than launching into a clean rebound.
Looking at the last 13 Thursday real-time samples, the story is pretty straightforward. Real-time pending sales fell from 2,260 to 1,862, a decline of 17.6%. The Rolling 30-day pending count fell from 2,125 to 1,678, down 21.0%. That matters because pending sales are the demand response. They tell us what buyers are actually doing, not what we wish they were doing.
At the same time, months of supply rose from 4.27 to 5.33, an increase of almost 25%. That is not what recovery looks like. Recovery usually comes with demand firming up enough to absorb supply. Instead, what we are seeing is supply staying elevated while demand softens. That combination creates friction, and friction creates pressure.
Values are also sending an important message. On the updated chart, pending values are now softer than sold values, which is not the direction you want if you are hoping for a stronger second half of the year. Pending pricing is the forward signal. Closed pricing is the backward confirmation. When pending values start trailing sold values, the market is essentially telling us that the next round of closings may not be as friendly as the last one.
Then add in the CP/LP ratio, which slid from 97.53% to 96.71% over these same 13 weeks. That is another quiet but important sign of weakening seller leverage. Buyers are not chasing. Sellers are giving up more at the closing table. In a healthy recovery, that ratio usually firms up, not drifts lower.
And we cannot ignore mortgage rates here. Rates have continued to take a beating, and higher financing costs are doing exactly what higher financing costs do: they reduce affordability, shrink the buyer pool, and make sellers compete harder for a smaller group of qualified buyers. When rates stay elevated and demand softens into late summer, the risk is not just a slow patch — the risk is a hard fall season for values, especially if sellers keep coming to market with spring pricing expectations.
That does not mean every submarket collapses tomorrow. It does mean the setup for Q3 and into year-end is not especially friendly. We are seeing softer demand, rising supply, weakening forward values, and lower close-price-to-list-price ratios. None of that looks like recovery to me.
We have called this market muddy, fragile, and still searching for footing. I think that remains the right framing today.
Macro Context. Local Precision.
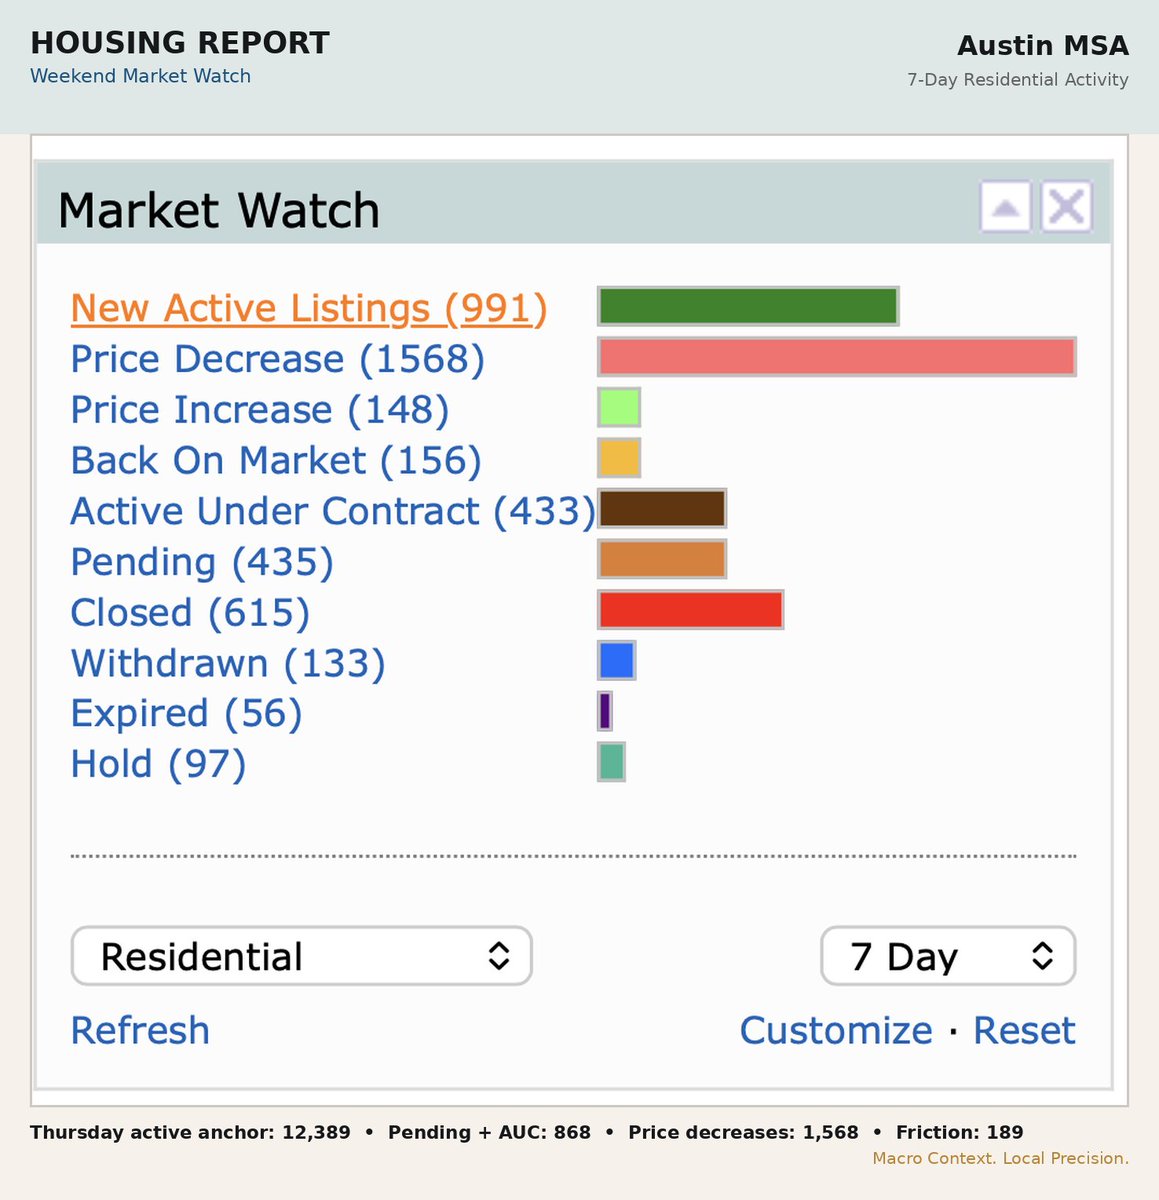
Weekend Market Watch across Houston, San Antonio, and Austin.
The clean read:
Houston is still the largest flow market. More new listings, more pending activity, more price reductions, and more exits. It is busy, but that does not mean it is clean.
San Antonio is softer, but not as sharp as Austin. Price reductions are running ahead of pending activity, but the imbalance is not as aggressive.
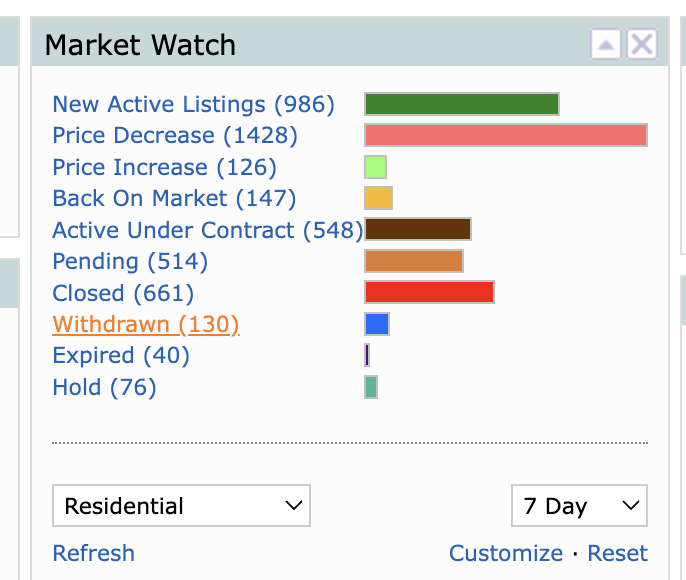
Austin remains the clearest pricing-pressure market of the three. Over the last 7 days, Austin had 1,568 price reductions against 868 pending contracts when Pending and Active Under Contract are combined.
That is not a recovery signal. That is a market still trying to find the clearing price.
I am not putting much energy on closed sales in this view. Weekend closed counts can run light because of reporting lag. The better real-time read is new listing flow, price reductions, and pending demand.
The theme is pretty simple:
Houston has scale.
San Antonio has softness.
Austin has the loudest pricing pressure.
And here is the teaser: we now have access to DFW data. That market is officially on the growth plan for July.
Texas is getting bigger on this page.
Macro Context. Local Precision.
Texas market watch:
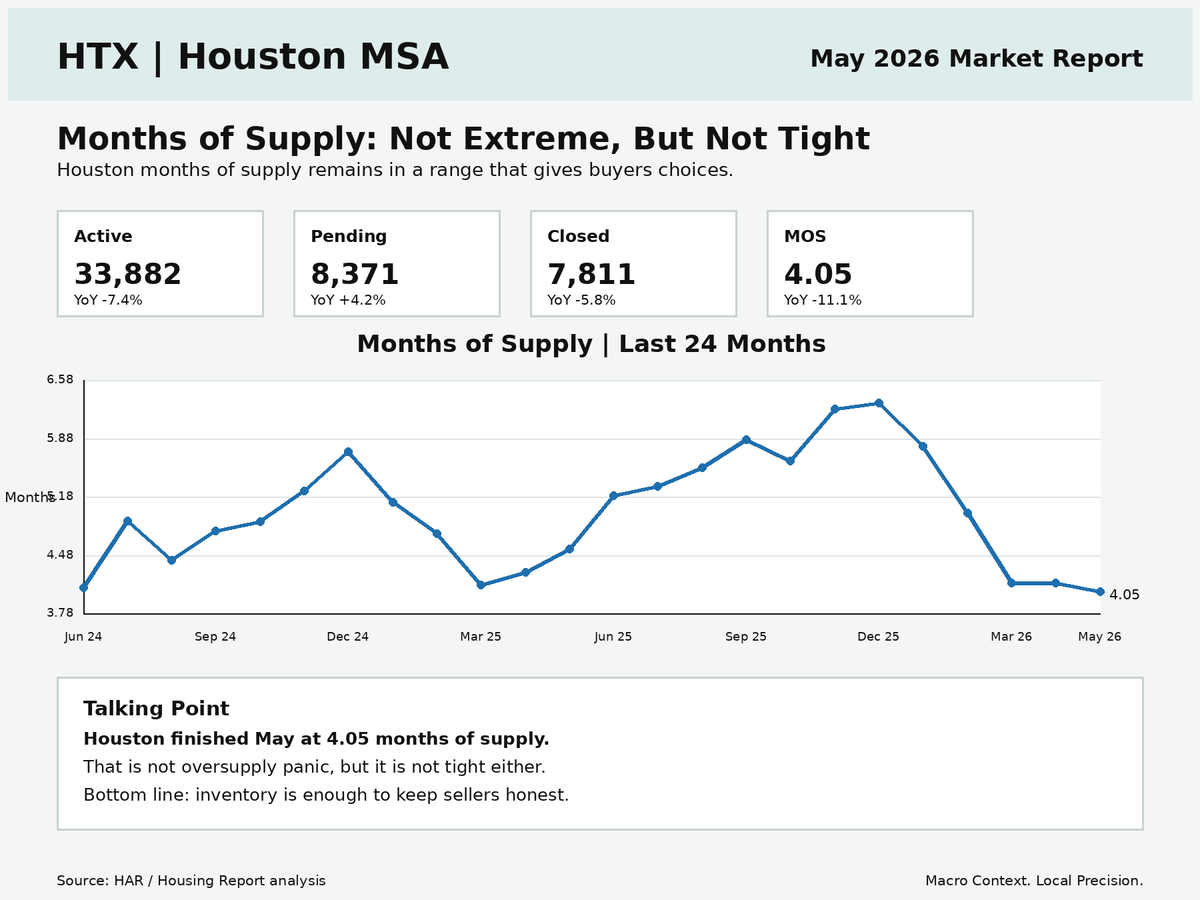
Months of supply is not screaming panic, but it is clearly not tight either.
HTX: 4.05 MOS
STC: 5.4 MOS
ATX: 4.00 MOS
That gives buyers choices and keeps sellers honest.
The story is not “crash.”
The story is inventory, pricing discipline, and buyer leverage returning to the table.
Macro Context. Local Precision.
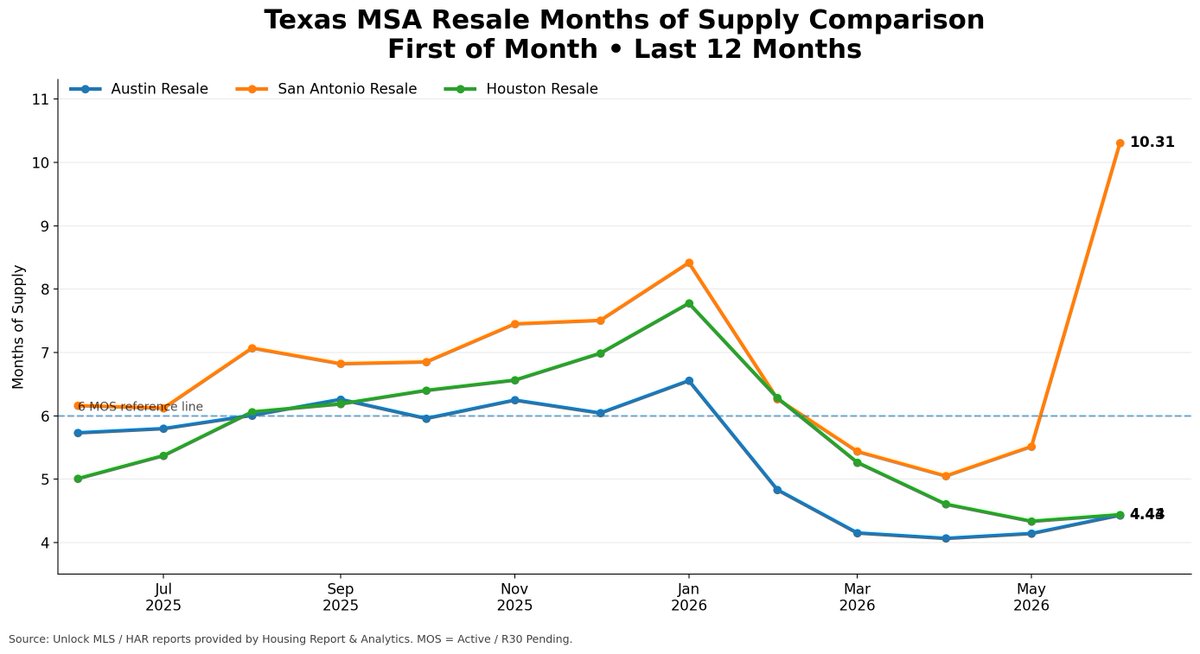
Austin, San Antonio, and Houston resale markets are telling very different stories.
Looking at resale months of supply on the 1st of each month over the last year, San Antonio is the clear stress point.
Austin resale moved from 5.73 months in June 2025 to 4.43 months in June 2026. That is a 22.7% improvement year over year.
Houston resale moved from 5.01 months to 4.44 months, an 11.4% improvement year over year.
San Antonio went the other direction.
SA resale moved from 6.16 months to 10.31 months, a 67.3% increase year over year.
That is the contrast.
Austin and Houston both had winter inventory pressure, but by spring they moved back into a more functional range. San Antonio did not. It broke higher.
This does not mean Austin or Houston are perfect. Both still have stale listings, affordability pressure, and sellers who may need to adjust.
But San Antonio resale is where the market stress is showing up most clearly.
Austin and Houston look pressured. San Antonio looks stressed.
Resale DOM gets even more interesting when you stop looking at all inventory as equal.
I broke resale inventory into DOM buckets and compared:
Active resale listings / Pending resale listings
That gives us a simple market-pressure read by age of inventory.
And the result is pretty loud.
0–21 DOM: 2.25 active listings per pending
22–60 DOM: 4.06
61–90 DOM: 5.29
91–120 DOM: 5.45
121–150 DOM: 3.79
151+ DOM: 7.23
Translation:
Fresh resale inventory is where buyers are engaging.
Older resale inventory starts piling up faster than demand.
By the time resale listings reach 151+ DOM, there are more than 7 active listings for every pending listing in that bucket.
That is not just “more days on market.”
That is market separation.
This is why DOM matters.
A listing does not just get older.
It starts competing in a weaker pool.
Fresh inventory gets attention.
Stale inventory gets leverage applied against it.
The longer resale inventory sits, the more it stops acting like supply and starts acting like background noise.
:::
There are really three types of sellers in this market:
1. Opportunity sellers
Shoot for the stars, hope for the unicorn, and wait for the next fool to show up.
2. Fair-market sellers
Price 1–2% above fair market, stay close enough to reality, and try to get the deal done without bleeding time.
3. Energy sellers
Price 1–2% below market, create urgency, drive traffic, and let buyers compete.
Here is the part sellers hate hearing:
If you want multiple offers, lower days on market, and a stronger closed-price-to-list-price ratio, Option 3 is usually the best play.
If you want a clean transaction without turning your listing into a science experiment, Option 2 works.
If you want to chase a number while holding costs, opportunity cost, rate pressure, and buyer fatigue eat your lunch…
Option 1 is available.
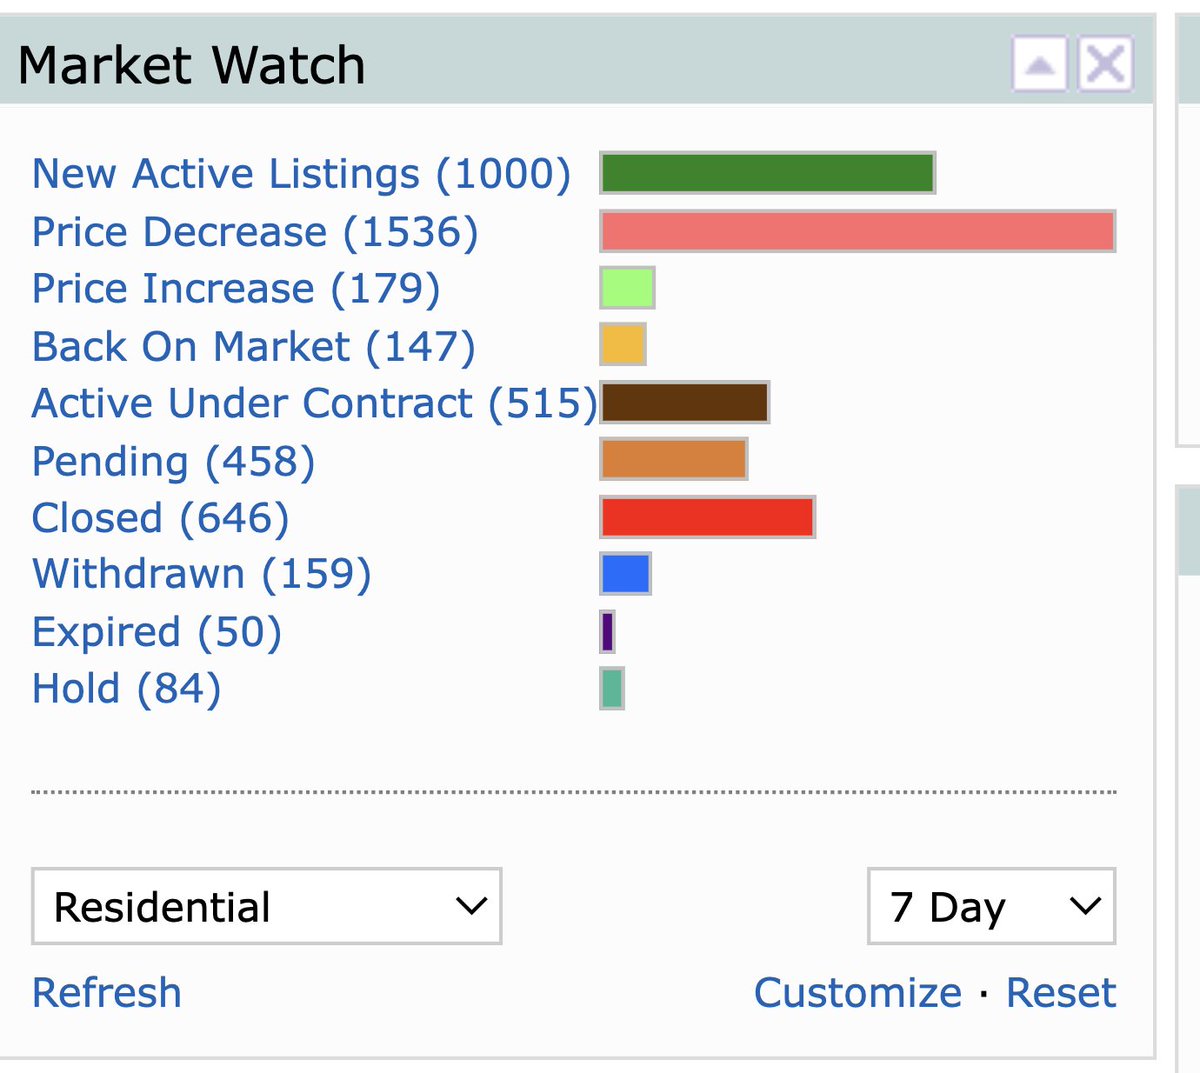
Now look at the last 7 days:
New Active Listings: 1,000
Price Decreases: 1,536
Price Increases: 179
Active Under Contract + Pending: 973
That is not a market whispering.
That is a market yelling:
Too many sellers are chasing price instead of creating energy.
Price reductions are not just “adjustments.”
They are the receipt for starting too high.
Buyers are not ignoring homes.
They are ignoring bad math.
Monday was violence.
Tuesday was “hold my beer.”
Wednesday, PPI walked in wearing brass knuckles and took the rate-cut narrative out back.
Hot wholesale inflation is not exactly the love language buyers, sellers, builders, or loan officers were hoping for.
The bond market heard the data and said:
“So we’re still pretending cuts are right around the corner?”
This is what pricing pressure looks like at the bottom of the market.
List price: $80,000
Time on market before going pending: 3 weeks
Time under contract: 2 weeks
Closed price: $60,000
That is a 25% discount from list price.
And this was not a high-end home sitting in fantasy-land pricing.
This was already an inexpensive listing.
That matters.
Because when even the lower-priced homes are closing with meaningful pricing pressure, the issue is not just luxury weakness. It is not just overpriced sellers at the top. It is affordability pressure working its way through the entire market.
Buyers are not simply asking:
“Can I afford the house?”
They are asking:
“Does this price make sense in this rate environment?”
Right now, the answer is increasingly:
Only if the seller is willing to meet the market.
@RickPalaciosJr Austin's New home Build Closings for April Preliminary numbers show a massive dip. Now give them a week and see how they tighten up. Narch is always a soft month for the MSA.
April new-home sales got my attention at first.
New-build closed units were down sharply from March, which looks dramatic on the surface. But when you step back and look at the last decade, April has usually been a cooldown month for new-home closings in the Austin MSA.
That matters.
A one-month drop is not automatically a builder pivot. It may simply be normal seasonal timing.
The bigger question is whether this is just the typical April pause — or whether builders are starting to manage volume more carefully after several years of elevated supply, incentives, and affordability pressure.
My read:
April by itself is not the alarm.
The follow-through in May and June is what matters.
If new-build closings rebound, this was likely seasonal noise.
If they do not, then we may be looking at a more meaningful shift in builder strategy.
For now, April is a watch item — not a conclusion.
Raw data sources: Austin, San Antonio and Houston Boards of Realtors; Zillow
Analysis: Housing Report
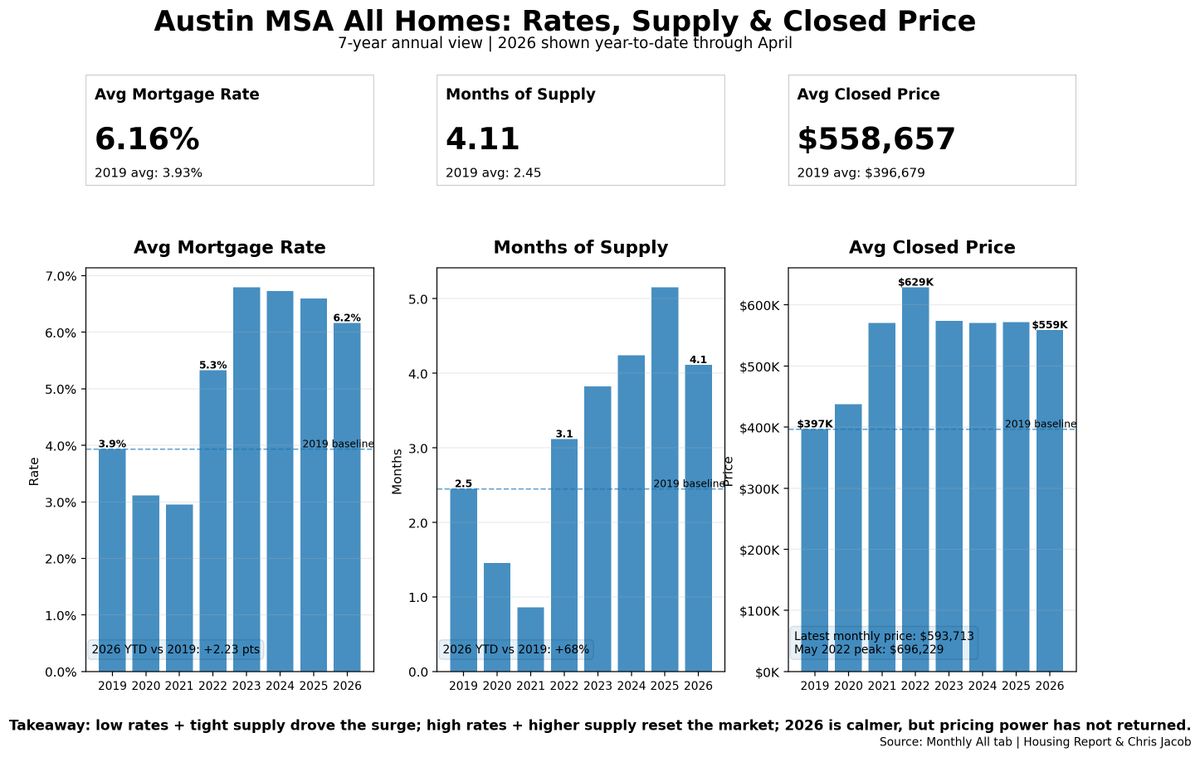
Rates explain the affordability shock.
Months of supply explains the leverage shift.
Average closed price tells the truth.
From 2019–2021, Austin had the perfect price-growth setup: lower rates, tighter supply, and aggressive demand.
Then 2022 reset the market.
Rates moved higher.
Supply rebuilt.
Buyers lost purchasing power.
And pricing stopped behaving like 2021.
Now in 2026, the market is calmer — but it is not “fixed.”
Rates are still well above 2019 levels.
Months of supply is still elevated.
Average closed price is still below the 2022 peak.
That is the story:
The market is healthier than last year in some ways, but sellers have not regained pricing power.
Buyers are active.
They are just not chasing old prices.
Austin resale is beginning to define a clearer payment-clearing range.
Using a payment-based floor model, the current pricing floor is approximately $555k, with a tradeable band of roughly $599k to $638k. The latest market readings are notable relative to that range:
SA Sold SP Resale: $603k
SA Pending LP Resale: $620k
Active LP Resale: $719k
That places closed resale value near the lower end of the tradeable band and pending resale pricing inside it, while much of the active market remains priced materially above where payment math appears to clear.
For investors, that distinction matters.
This does not look like a market where broad pricing power has returned. It looks more like a market still clearing through affordability discipline. Buyers remain active, but engagement appears concentrated where payment burden works — not where seller expectations remain anchored to prior conditions.
The practical takeaway is straightforward: the tradeable market is clustering near the floor band, while execution risk appears higher for inventory priced materially above it.
In this type of environment, separating aspirational list pricing from actual clearing value matters more than headline activity alone.
Bottom line: Austin resale appears to be forming a more defined payment-based clearing range. That framework is useful for underwriting, pricing discipline, and identifying where the market is most capable of transacting.
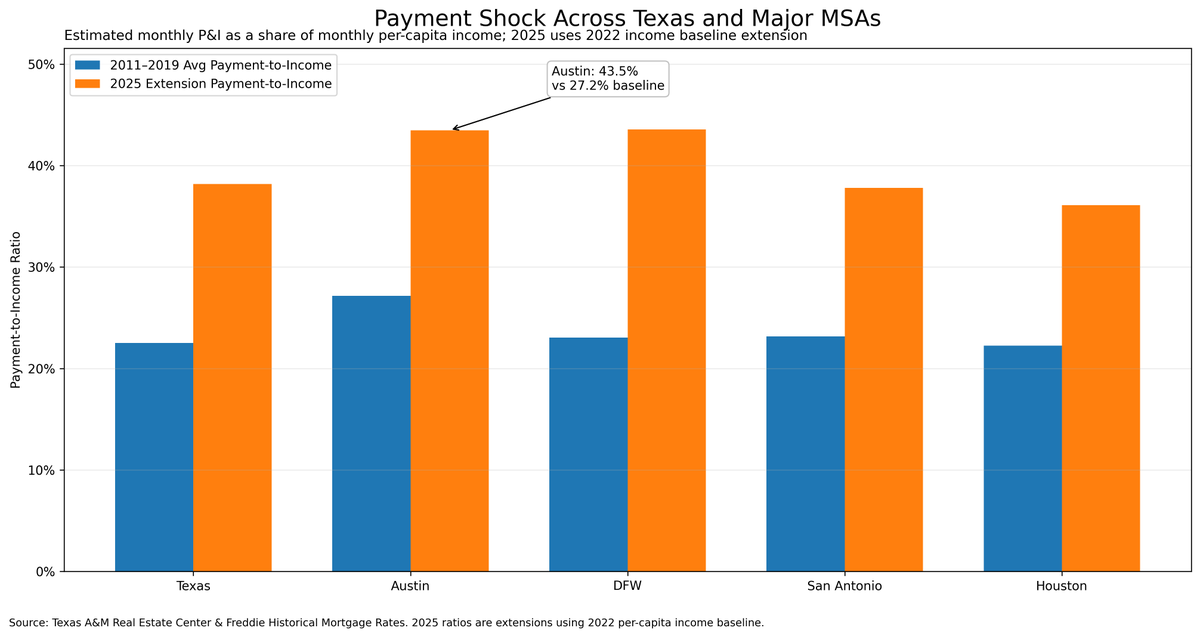
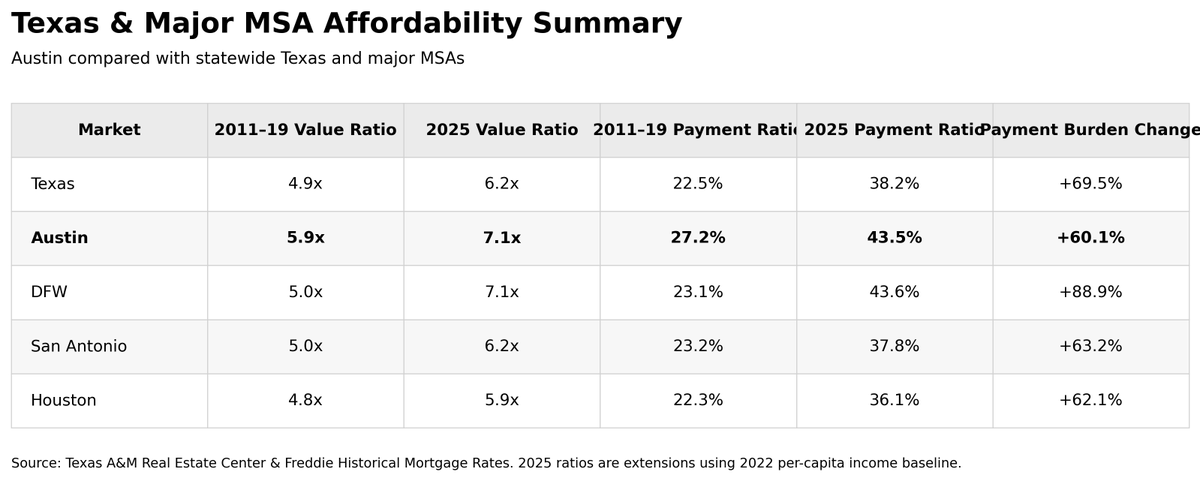
Austin used to be the clear Texas affordability outlier.
Now the stress has spread.
Using the 2011–2019 period as the pre-pandemic baseline, Austin’s estimated payment-to-income ratio averaged about 27%.
By the 2025 extension, that number is roughly 44%.
That is a major reset.
But Austin is no longer alone.
DFW is now essentially at the same payment stress level, also near 44%. Texas overall has moved from roughly 23% to 38%.
So the story is not just that Austin became expensive.
The story is that the cost of ownership across Texas has reset higher.
Austin still screens expensive, but the gap between Austin and the other major MSAs has narrowed because payment stress has moved statewide.
Bottom line:
Austin corrected more in price, but affordability stress is no longer just an Austin problem.
It is now a Texas problem.
Prices corrected in some markets. Payments did not.
Morning — this is the cleanest view of the housing cycle you’ll see.
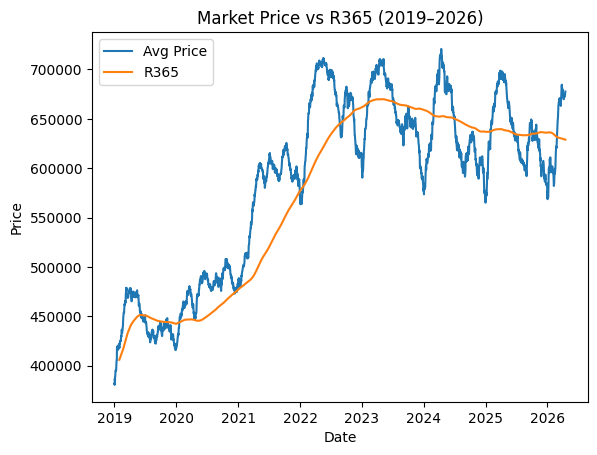
This is 2019 → today, with one question:
👉 Where is the market vs where it should be?
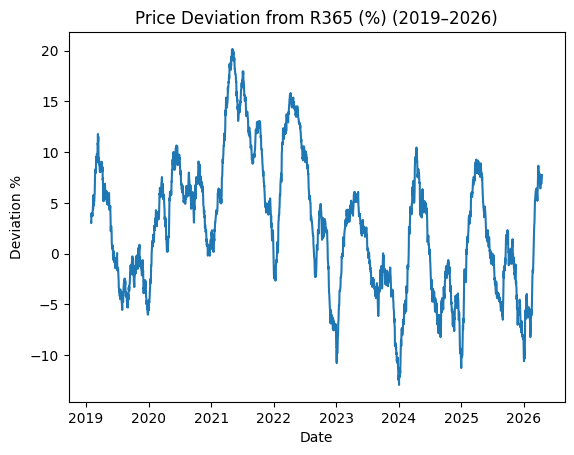
1. The entire cycle in one chart
2019 → balanced market
2020–2022 → massive overshoot above equilibrium
2023–2026 → full reversion
👉 That orange line (R365) is reality
👉 The blue line is emotion + liquidity
2. The pandemic distortion is obvious
Look at 2021–2022:
👉 Prices ran +15% to +20% ABOVE equilibrium
That was never sustainable.
That was:
Stimulus
Ultra-low rates
Artificial demand pull-forward
3. Now look at today
We’ve fully unwound it.
👉 The market is now:
Oscillating around equilibrium
Frequently dipping below it
4. The second chart is the truth
Deviation from R365:
2021 → +20% (peak overheating)
2023 → sharp correction
2024–2026 → consistently negative prints
👉 That’s your signal:
We are now in a value-driven market
5. This explains the confusion in real time
Why people feel “off” about the market:
Activity is improving ✔
But pricing isn’t ✔
👉 Because:
Transactions clear at equilibrium — not at seller expectations
6. What happens next (this is the edge)
R365 is now:
👉 Flat to slightly declining
So even if:
Pendings rise
Closings increase
👉 Prices will continue to:
Gravitate toward or slightly below equilibrium
7. The key shift most people miss
Pre-2022:
👉 Price momentum drove the market
Today:
👉 Affordability sets the ceiling
Bottom Line
2021 = artificially high
2023 = correction
2026 = equilibrium
👉 And sometimes… slightly undervalued
Final Take
If you understand this:
👉 You stop chasing headlines
👉 And start tracking where the market should clear
Because right now:
The opportunity isn’t in volume — it’s in mispricing
Existing Pending Sales — Quick Take
Pending volume is up.
+12% YoY
+80% current pendings
But prices tell the story:
👉 -8.6% YoY in pending values
Bottom line
Buyers are active — just not at last year’s prices.
This isn’t a recovery.
It’s price-driven clearing at lower values.
Morning — quick take on what’s actually happening in the market.Listings are still materially overpriced.Yes — pending sales are up. I agree.
But… those contracts are coming in at roughly 6% lower values vs the same period in https://t.co/RAR0JRGUBG what’s really happening?Volume is picking up
Prices are still resetting lower
We’re now pushing toward new post-pandemic lows
And the usual “summer bounce”?
👉 It’s not showing up.Bottom line
2026 is shaping up to be a summer of value purchases, not price appreciation.Buyers are stepping in — just not at last year’s prices.
4 Years After QE Ended — What the Data Is Actually Showing
1) Home Values: Resilient, But No Longer Driving the Story
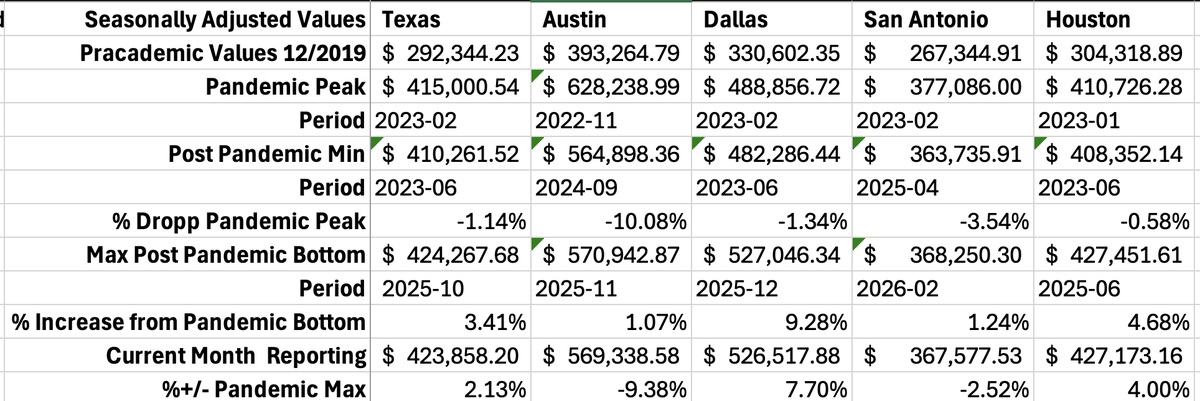
Across Texas metros:
• Texas: +2.1% vs pandemic peak
• Dallas: +7.7%
• Houston: +4.0%
• Austin: -9.4% (only major reset)
• San Antonio: -2.5%
👉 Outside of Austin, home values have largely held or exceeded peak levels
Even after:
rate shock
affordability compression
supply normalization
That’s a very different outcome vs prior cycles.
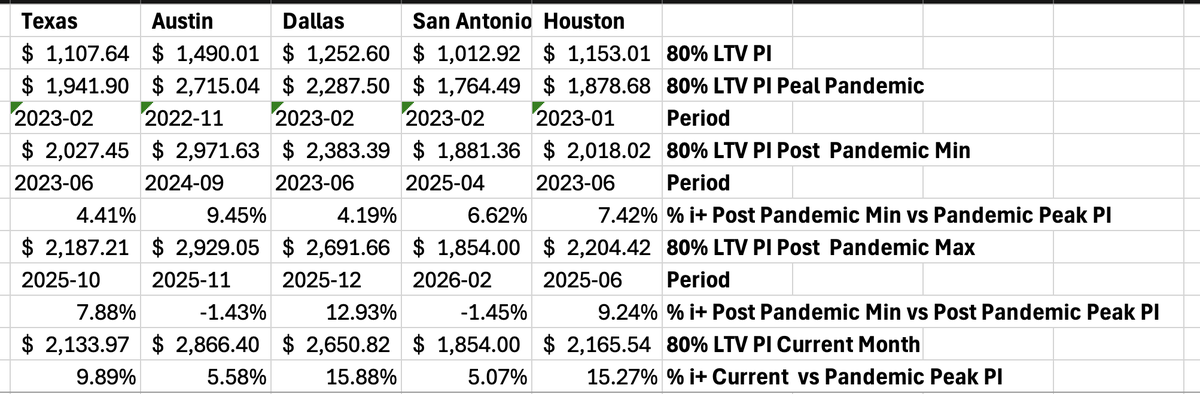
2) Cost of Ownership: This Is Where the Real Reset Happened
Now look at payments (80% LTV P&I):
• Texas: +9.9% vs pandemic peak
• Dallas: +15.9%
• Houston: +15.3%
• Austin: +5.6%
• San Antonio: +5.1%
👉 Even where prices are flat or down…
👉 ownership costs are still UP meaningfully
3) The Disconnect (This Is the Key Insight)
Prices didn’t reset — payments did.
The Fed ended QE → rates repriced →
but instead of prices collapsing:
• Sellers held the line
• Builders used incentives
• Supply came on gradually
So the adjustment happened through:
👉 monthly payment, not asset value
4) Market Behavior Since QE Ended
This explains what we’ve all been seeing:
• Transaction volume fell (affordability shock)
• Prices stayed sticky (no forced selling)
• Markets moved sideways / slow grind
• Austin corrected first (most rate-sensitive market)
5) Where We Are Now
We’re ~4 years into tightening and:
• Values = stable to slightly positive (most markets)
• Payments = structurally higher
• Affordability = still constrained
Bottom Line
👉 The post-QE housing reset was not a price crash
It was a:
→ cost of capital reset
→ affordability reset
→ activity reset
Forward View (Next ~45 Days) — New Construction Values
Both timeframes are aligned → slightly lower
• R30 Forecast: ~-20.6% from peak
• R365 Forecast: ~-11.25% from peak
More importantly:
👉 Both are trending down vs current levels
What this tells us
This removes the noise of short-term volatility and shows:
• The recent bounce is not expected to hold
• Pricing pressure is still working through the system
• Both short-term and long-term models are pointing in the same direction
Interpretation
This is a continuation signal, not a turning point:
• Not accelerating downward
• But also not stabilizing yet
👉 Just a controlled, ongoing softening
Key Insight
When both:
Short-term (R30) and
Long-term (R365)
are forecasting lower at the same time…
👉 The market is still in adjustment mode, not transition.
Bottom Line
Over the next ~45 days, new construction values are expected to drift slightly lower.
No sharp move — just continued pressure at the margin.