One account made +$113.48.
The other four combined lost $11.84.
Five accounts. +$101.64 overall. Here’s how the week actually went 👇
Lighter points day — Week 6 of my copy-trading journal on Robinhood Chain with @Hyperankio.
Account 1 carried the week with +18.54%.
Account 4 took a hit from the sudden LIT drop, going from +$58.61 last week to −$26.19 this week.
Account 3 recovered to +$7.43, but its maximum drawdown reached $148.26 along the way. A pretty uncomfortable ride for that small green finish.
Account 2 added +$8.15. Account 5 finished at −$1.23 after a $57.34 drawdown.
Across all five accounts:
• Weekly PnL: +$101.64
• Trading volume: $41,323.60
• New points: +2.819687
• Total points: 23.739251
PnL increased 25.9% versus last week, while volume fell 21.1% and new points fell 31.7%. That slowdown in points is worth tracking alongside the trading results.
Meanwhile, Lighter on Robinhood Chain recorded $3.672B in spot + perpetual volume, 18,729 unique trader accounts and 8,685,125 trades during Sep 25–Oct 1 (UTC).
Full account results and drawdowns are in the image. I’ll keep sharing the rough weeks too.
7/
Whatever you pick, run it in paper mode first. Same
sizing, same limits, no real orders.
If a stop loss is hit, copying stops and the open
positions are yours to decide on. We don't guess for
you.
https://t.co/VAsKlncg5o
1/
Most people copy a trader on default settings. That's
how a $300 wallet ends up copying a $2M whale
badly.
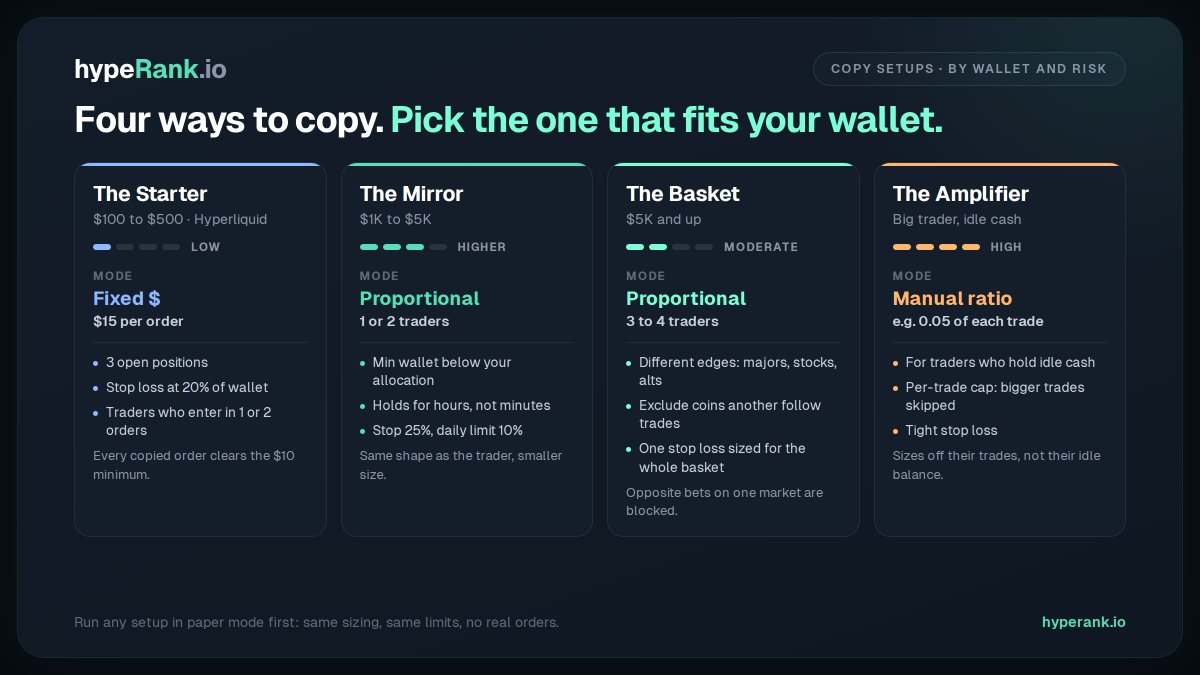
Four copy setups, by wallet size and risk appetite.
Every number below is a setting you can type in.
6/ The Amplifier: aggressive
Some big accounts trade a fraction of what they hold.
Proportional sizes you off their whole account: their
$50K trade on a $1M account becomes $250 on your
$5K.
Manual ratio 0.05 copies 5% of every trade, $2,500 here.
That is leverage by choice. Set a per-trade cap
(anything above it is skipped) and a tight stop loss.
We pulled every deposit and transfer since day one for the top and bottom 1%.
Winners: median $39K put in. Half of them between $14K and $99K.
Losers: median $45K. Half between $20K and $137K.
Roughly the same wallets, opposite results.
The winners' median return on what they put in: +33%. The losers': −23%.
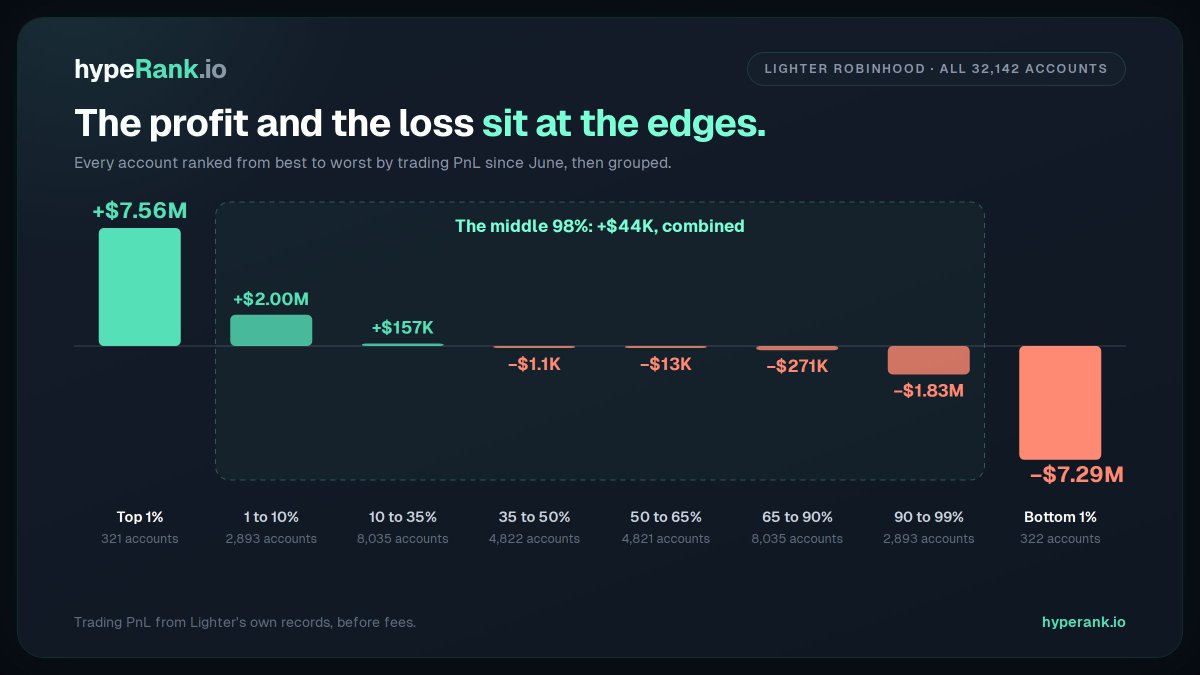
32,142 accounts have traded on Lighter Robinhood since June. Together, they are up $314K.
That number hides everything.
The top 321 accounts made $7.56M.
The other 31,821 lost $7.24M.
1% of traders took 78% of all the profit. The single best account made $684K on its own, more than twice the whole exchange's net.
Trading PnL from Lighter's own records, before fees.
Who you copy matters more than whether you copy.
#Lighter & #Hyperliquid
A note on the chart: the account counts mirror by design. We ranked every account by PnL and cut the list into percentile groups from each end (1%, 9%, 25%, 15%), so matching groups hold the same number of accounts.
What differs is the money. The top 321 accounts made $7.56M, the bottom 322 lost $7.29M, and the 31,499 in between netted $44K.
We checked the counterparties. Most of it doesn't look like wash trading. It's like a typical top account's biggest counterparty is only about a fifth of its volume. There is a small pocket that does look like it: accounts with near-identical numbers passing PnL to each other in a single fill. Pairs like that make up about 5% of the top 1%'s profit.
Partly, yes. Trading PnL is zero-sum before fees, so every dollar won is lost by someone else. The mirror at the edges comes from size: the top 1% by PnL are in 80% of all volume, the bottom 1% in 31%.
It's also a young venue, about three months old with 32K accounts. In a pool that small, a few hundred large traders end up on both sides of most trades, so the biggest winners mostly win from other big players.
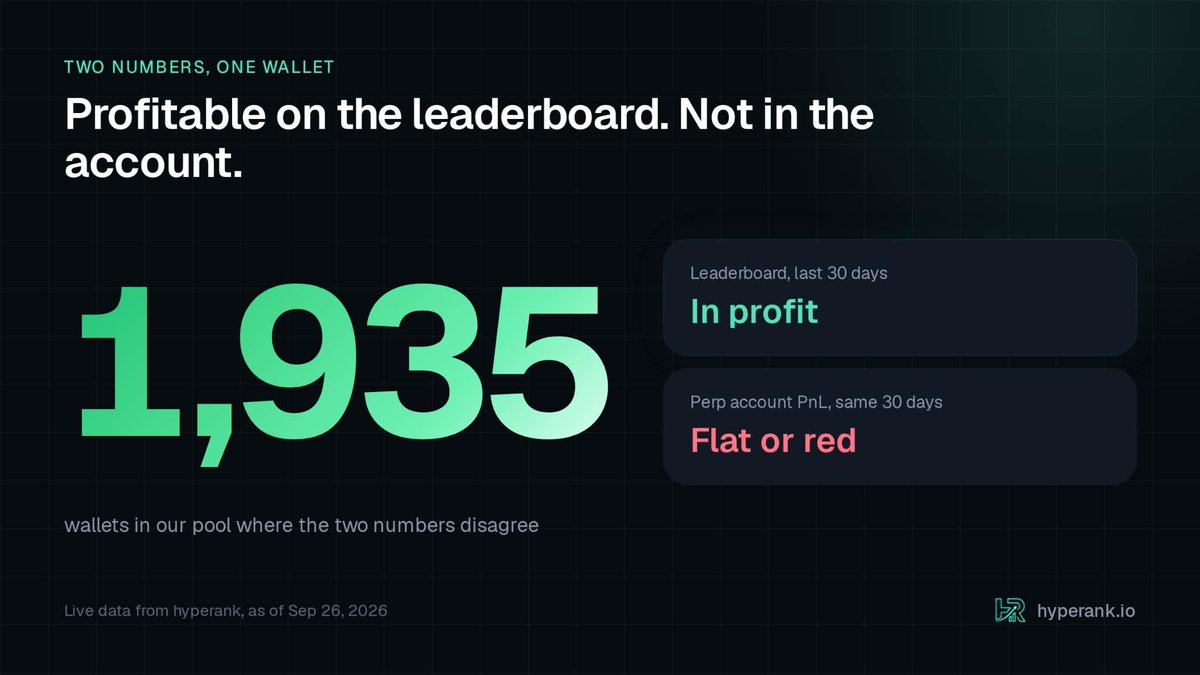
1,935 #Hyperliquid wallets in our pool show a profitable month on the leaderboard.
Pull the 30 day PnL from their own perp account and it's flat or negative.
Same wallet, same month, two different answers. We go with the one that comes from the account itself, and when they disagree the wallet doesn't make the list.
Good call, sizing is a big one. a wallet can fail for more than one reason so these overlap, but out of the 4,680:
534 were running leverage too high to copy safely
490 had margin near max or were sitting close to liquidation
639 had a 30 day drawdown too deep to ignore
and 18 had an almost perfect win rate where winners vs losers just didn't add up. win rate is usually the last number that tells you anything.
There are 46,867 wallets on the #Hyperliquid leaderboard right now.
We take the top 7,400 and go through their trades one by one. 2,720 are still standing at the end.
The rest look fine from the outside. It's the fills that give them away.
I'll post what we find in there every day this week. What's the first thing you check before copying someone?