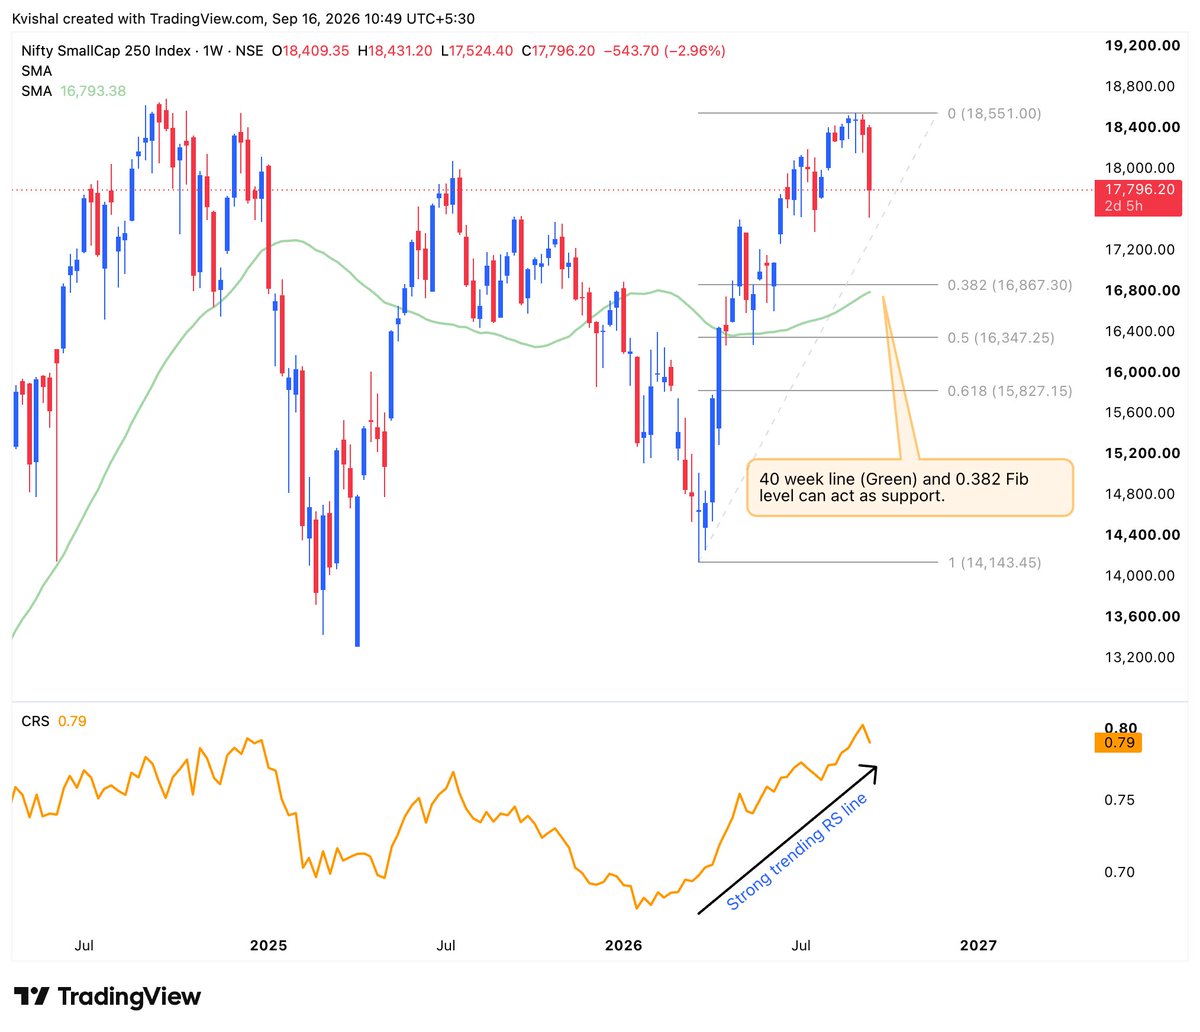
The Nifty Smallcap 250 Index is now testing the levels highlighted earlier, the 0.382 Fibonacci retracement and the 40 week moving average.
Time to watch the price action closely.
#Nifty#NIFTYBANK#smallcap250
Why I believe the long-term structure of Smallcap 250 is still intact 📈
Smallcap 250 has had a massive run since March.
After such a sharp move, some profit booking + consolidation is healthy, especially when the index looks extended technically and valuations remain elevated.
I’ve marked the key potential support zones on the chart.
Yes, Fed policy, global liquidity and crude can impact near-term sentiment.
But from a long-term/positional trading perspective, the bigger trend still looks intact.
The key now is to watch how the index behaves around these support zones. If buyers step in and the structure holds, the correction could create a better risk-reward opportunity.
Let the correction come. Watch the key support zones. Look for opportunities.
As Warren Buffett famously said: “Be fearful when others are greedy, and greedy when others are fearful.”
#Nifty #Banknifty #Smallcap #Fed
Long-term market breadth continues to deteriorate. Only 30% of liquid stocks are trading above their 200 DMA, with participation gradually slipping towards the March - April lows.
The weakening breadth suggests that the deterioration is becoming increasingly broad-based, warranting caution even if the headline indices remain relatively resilient.
#Nifty #BankNifty
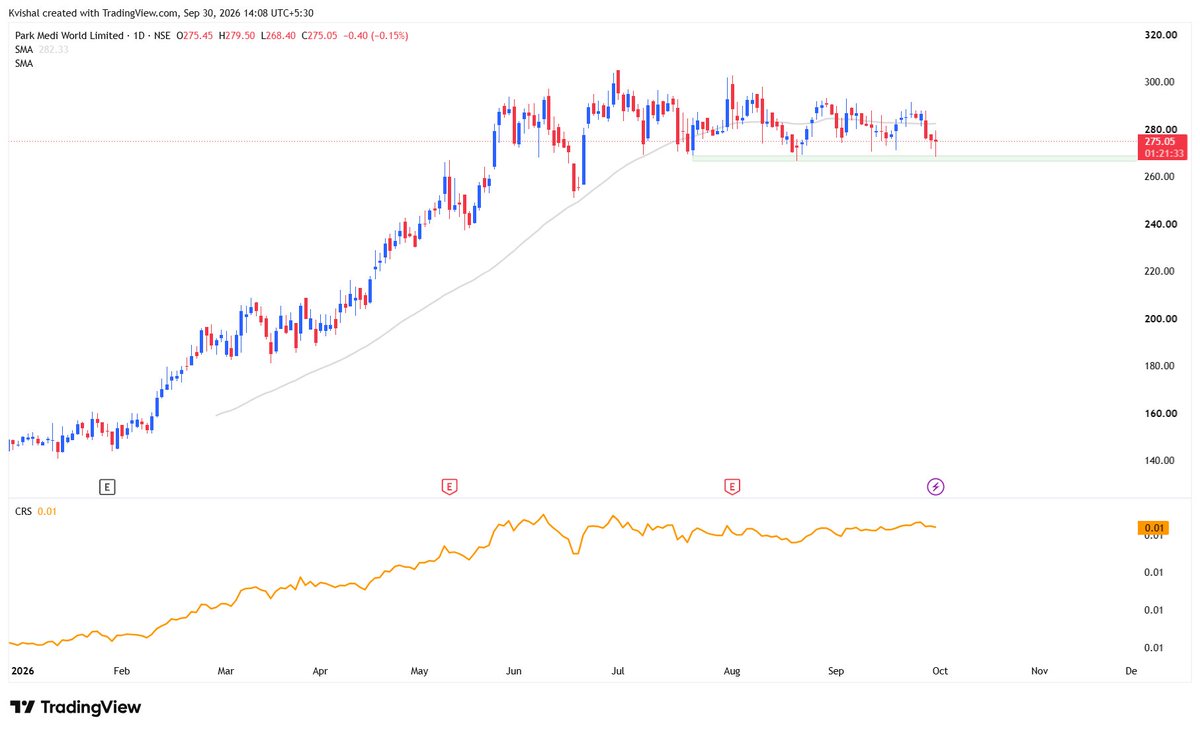
NSE:PARKHOSPS
Park Medi World is showing strong relative strength among Nifty Total Market hospital stocks, holding up well while most peers continue to decline (orange line).
The stock is currently consolidating around its 50 DMA, with the ₹265 region continuing to act as support.
What’s interesting is the contraction in volume during the consolidation, suggesting that supply is drying up as the stock moves sideways.
Strength is often easiest to spot when everything around it is weak.
#Nifty #Banknifty #PARKHOSPS #Hospital
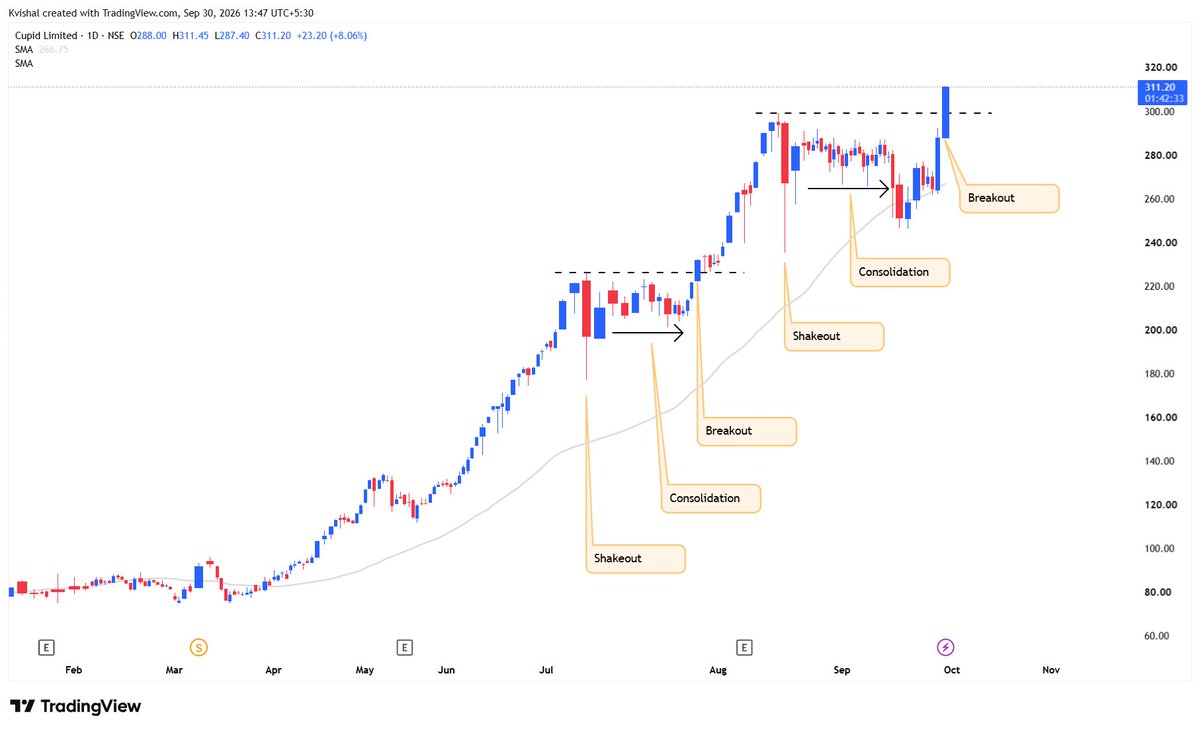
NSE:CUPID
Different price. Same story.
Shakeout → consolidation → breakout.
Cupid has repeated the structure again and is now breaking into fresh ATHs with a wide-range bullish candle.
#Nifty#Banknifty#CUPID#Smallcap250
NSE: POWERICA
The interesting part isn't just the breakout. It's where the breakout is coming from.
Powerica Ltd. belongs to two groups that have been showing strong relative strength, Nifty IPO Index and Heavy Electrical Equipment.
Today, the stock broke out with a wide-range bullish candle backed by strong volume.
Price is breaking out. Volume is confirming. The group is already showing strength. Now comes the important part: Can the stock sustain the breakout?
#Nifty #Banknifty #POWERICA
Nifty India Defence is showing weakness, with the index forming a bearish candle as of 11:00 AM. (Chart no shown)
But underneath the index, several micro-cap Aerospace & Defence stocks are printing long-tail candles and rejecting lower levels.
When the sector sells off, watch the stocks that refuse to break down.
#Nifty #BankNifty #NiftyDefence #Microcap
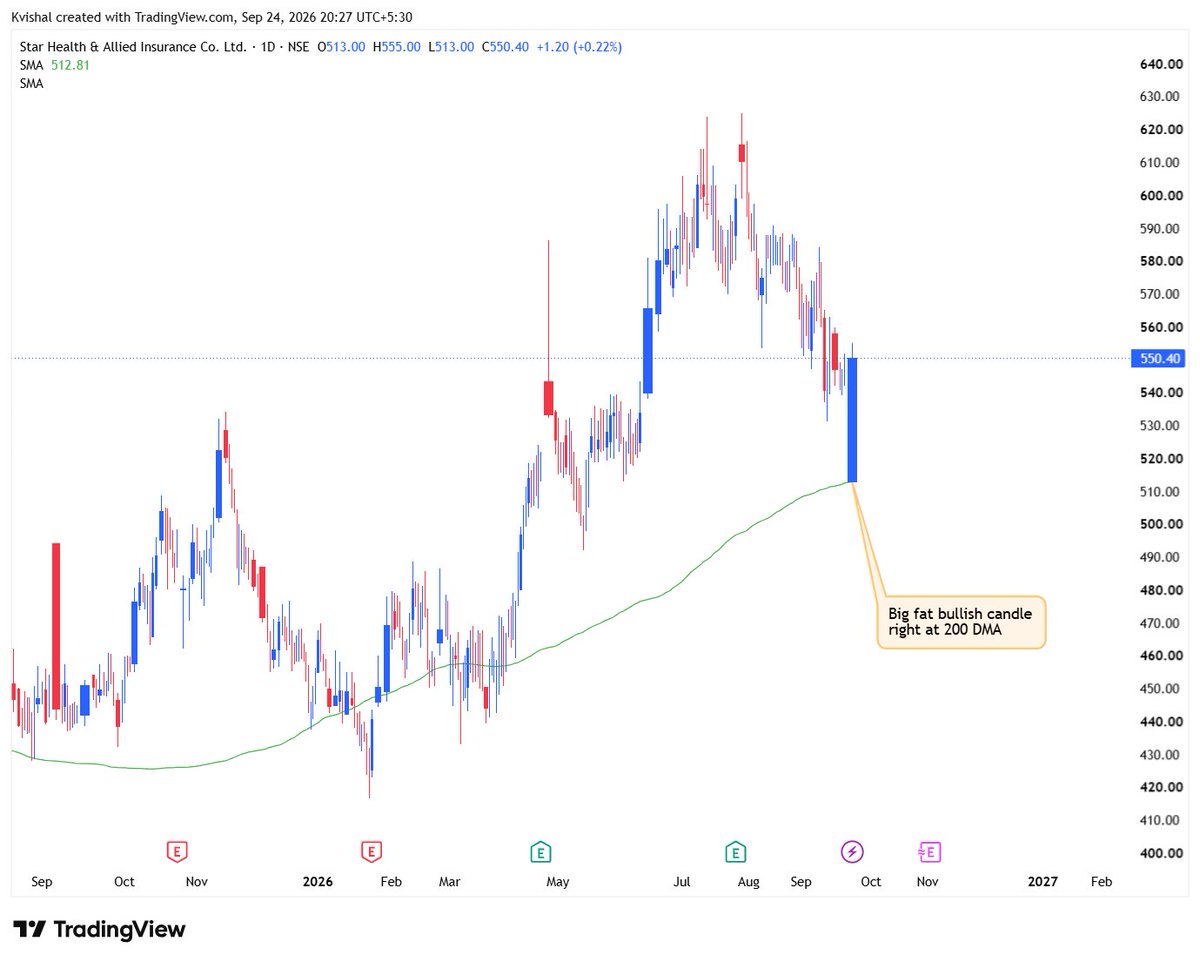
Star Health showed the most strength among Insurance stocks today.
A wide-range bullish candle on heavy volume right at the rising 200 DMA suggests buyers stepped in aggressively at lower levels.
#Nifty#Banknifty#StarHealth
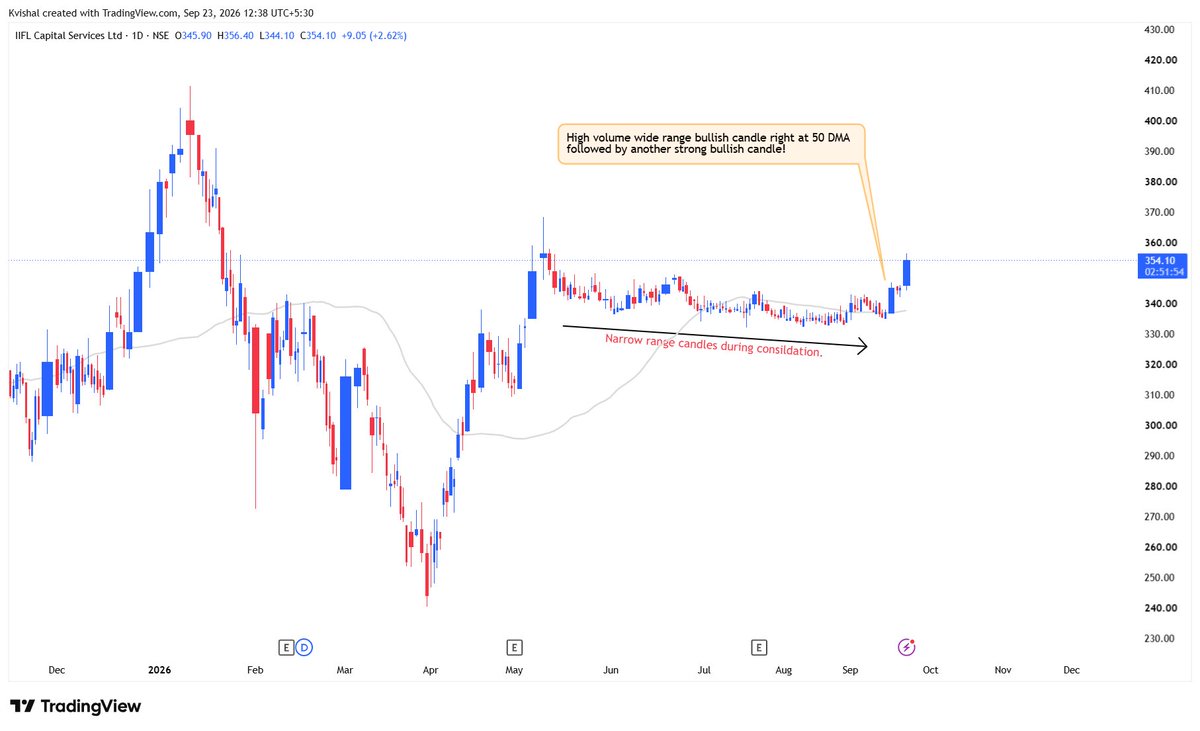
IIFL Capital Services has been showing tight price action over the last few months following its previous upmove.
The technical setup is interesting, but the fundamentals make it worth watching:
• Retail broking revenue +13% YoY
• Institutional + IB revenue +27% QoQ
• Operating margin expanded to ~35.8%
• Operating PBT +4% QoQ
• AIF & PMS AUM at ~₹4,400 Cr
Price is tightening while the underlying business continues to show resilience.
One to watch for a potential breakout. Volume expansion and relative strength would be key confirmations.
#Nifty #banknifty #swingtrading #IndianMarkets
Hindustan Copper Update:
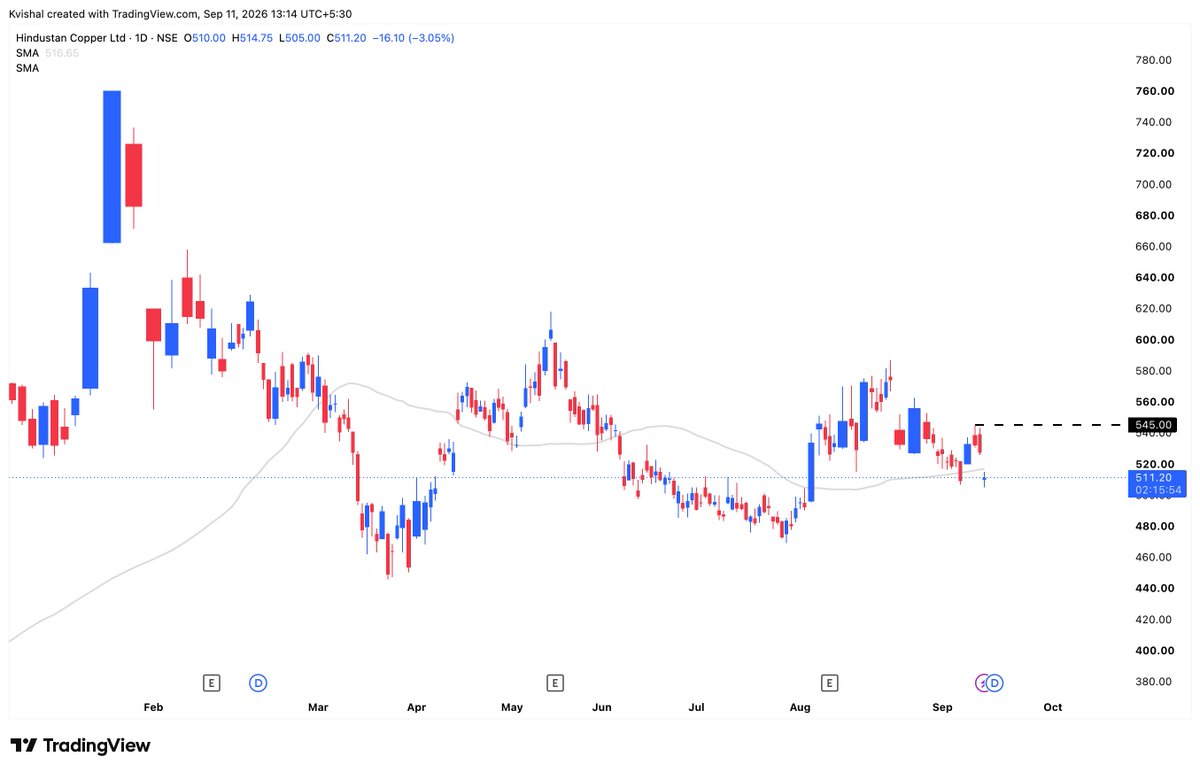
HindCopper formed a long-wick candle right around its 50 & 200 DMA, indicating selling pressure at these key moving averages and suggesting the possibility of further downside.
However, despite the recent weakness, the stock has not yet broken its key trending pivot. Looking at the broader structure, HindCopper still appears to be consolidating within a wider range rather than having decisively shifted into a downtrend.
For now, the key level to watch remains the trending pivot. A decisive break below it would provide stronger confirmation of a trend deterioration.
#Nifty #Banknifty #HindCopper
Hindustan Copper - Update
In my previous post, I highlighted ₹540–545 as a key supply/resistance zone.
The stock is now facing supply around those levels.
A few things to note:
• Price Action: ₹540–545 continues to act as a strong supply zone.
• Sector Weakness: The entire Non-Ferrous pack, HINDCOPPER, HINDALCO, HINDZINC & NALCO has come under pressure.
• Copper: Copper prices have corrected sharply after hitting record highs, partly due to uncertainty around proposed US copper tariffs.
• Macro: Rising crude, higher global yields, a stronger dollar and broader risk-off sentiment are adding pressure to metal stocks.
• Fundamentals: HINDCOPPER’s recent results remain strong — Revenue +81% YoY and PAT +162% YoY.
• Long-term Theme: The structural copper supply-demand story remains constructive.
For now, ₹540–545 remains the key level to watch.
A decisive breakout above this zone, preferably with strong volume, would be constructive.
Until then, the supply zone deserves respect.
#Nifty #Banknifty
Why I believe the long-term structure of Smallcap 250 is still intact 📈
Smallcap 250 has had a massive run since March.
After such a sharp move, some profit booking + consolidation is healthy, especially when the index looks extended technically and valuations remain elevated.
I’ve marked the key potential support zones on the chart.
Yes, Fed policy, global liquidity and crude can impact near-term sentiment.
But from a long-term/positional trading perspective, the bigger trend still looks intact.
The key now is to watch how the index behaves around these support zones. If buyers step in and the structure holds, the correction could create a better risk-reward opportunity.
Let the correction come. Watch the key support zones. Look for opportunities.
As Warren Buffett famously said: “Be fearful when others are greedy, and greedy when others are fearful.”
#Nifty #Banknifty #Smallcap #Fed
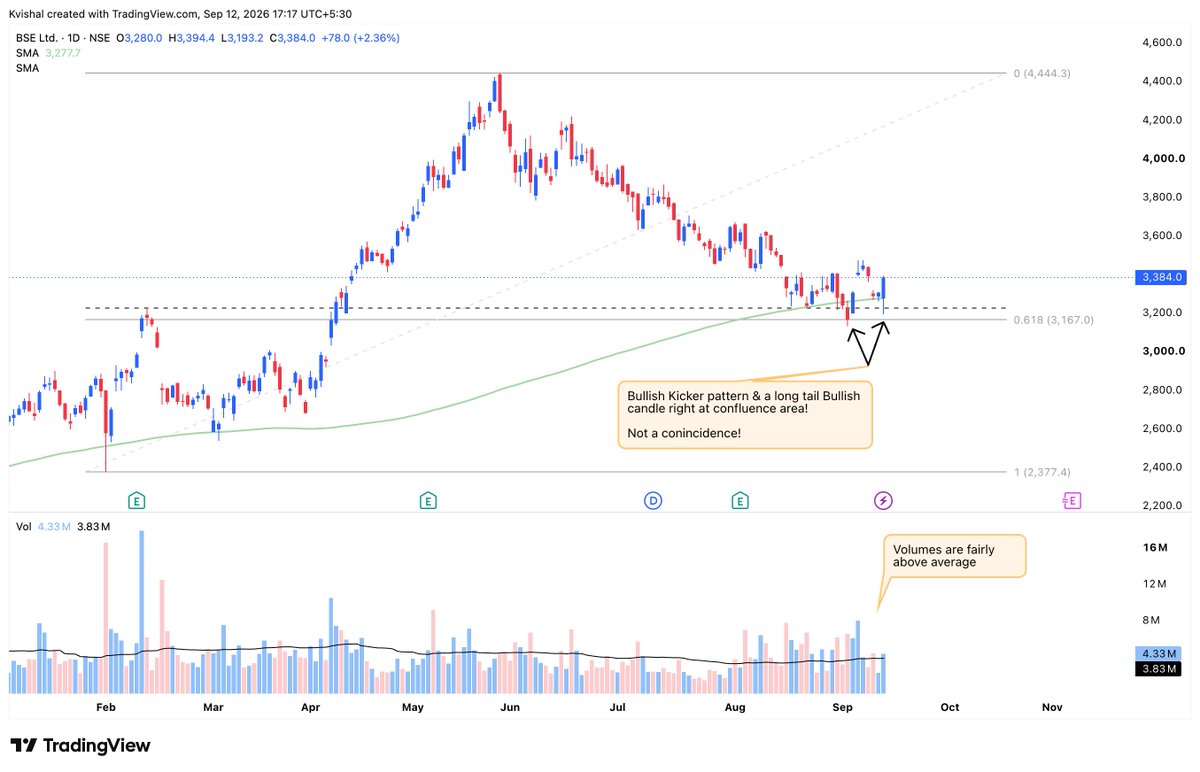
The story is in the candles.
As seen on the chart, BSE is attracting strong buying around the 3,150–3,200 zone.
The area has multiple confluences:
• 200 DMA - Green line
• Previous resistance - now being tested as support
• 0.618 Fibonacci retracement — Golden Ratio
• Bullish candles emerging right from this confluence zone
Fundamental triggers worth watching:
• SEBI is reviewing the CAS settlement methodology, with one proposal potentially delinking derivatives settlement from CAS for a year ,an important development for BSE's derivatives business.
The technical setup is interesting. The fundamentals provide an additional reason to watch this zone closely.
#Nifty #Banknifty #BSE #SEBI
Hindustan Copper - Update
In my previous post, I highlighted ₹540–545 as a key supply/resistance zone.
The stock is now facing supply around those levels.
A few things to note:
• Price Action: ₹540–545 continues to act as a strong supply zone.
• Sector Weakness: The entire Non-Ferrous pack, HINDCOPPER, HINDALCO, HINDZINC & NALCO has come under pressure.
• Copper: Copper prices have corrected sharply after hitting record highs, partly due to uncertainty around proposed US copper tariffs.
• Macro: Rising crude, higher global yields, a stronger dollar and broader risk-off sentiment are adding pressure to metal stocks.
• Fundamentals: HINDCOPPER’s recent results remain strong — Revenue +81% YoY and PAT +162% YoY.
• Long-term Theme: The structural copper supply-demand story remains constructive.
For now, ₹540–545 remains the key level to watch.
A decisive breakout above this zone, preferably with strong volume, would be constructive.
Until then, the supply zone deserves respect.
#Nifty #Banknifty
With Copper prices at ATHs on the LME, Hindustan Copper has formed a Bullish Kicker pattern right around its 50 & 200 DMAs, signalling a potential shift in sentiment following the recent OFS-led sell-off.
The setup is further supported by strong Q1 FY27 numbers: Revenue +81% YoY and PAT +163% YoY.
Interestingly, peers across the Non-Ferrous Metals space, Hindalco, Hindustan Zinc & NALCO, have also formed bullish patterns around their 50/200 DMAs, suggesting improving strength across the group.
In the near term, 540-542 remains an important resistance zone. If the stock absorbs this overhead supply, the broader uptrend could resume.
#Nifty #Banknifty #HINDCOPPER
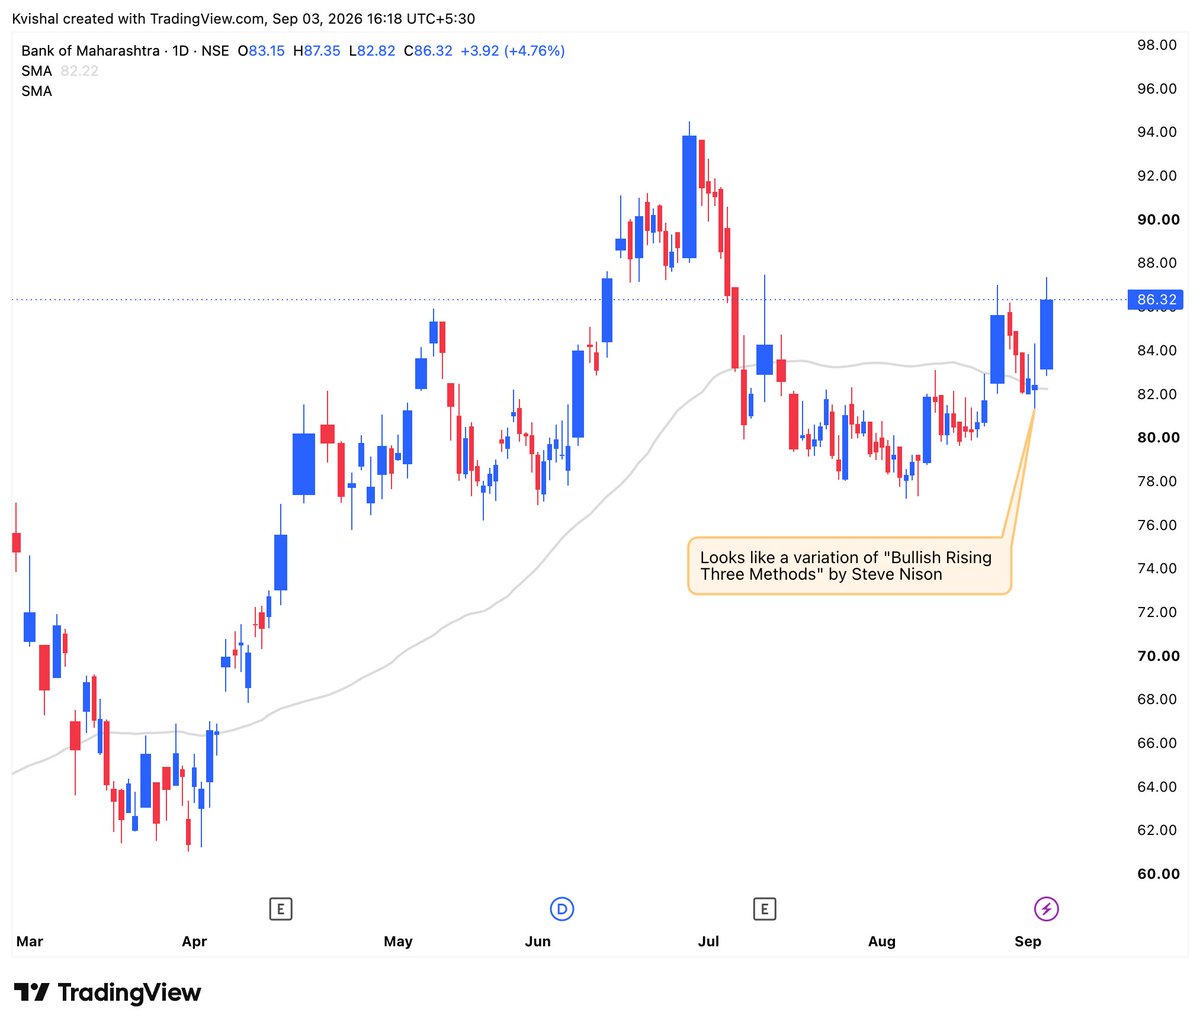
As seen from the attached chart, Bank of Maharashtra has formed a "Bullish Rising Three Methods" candlestick pattern right at 50 DMA, suggesting a potential continuation of the prevailing trend.
What makes the setup interesting is the confluence of price structure + 50 DMA support + candlestick pattern.
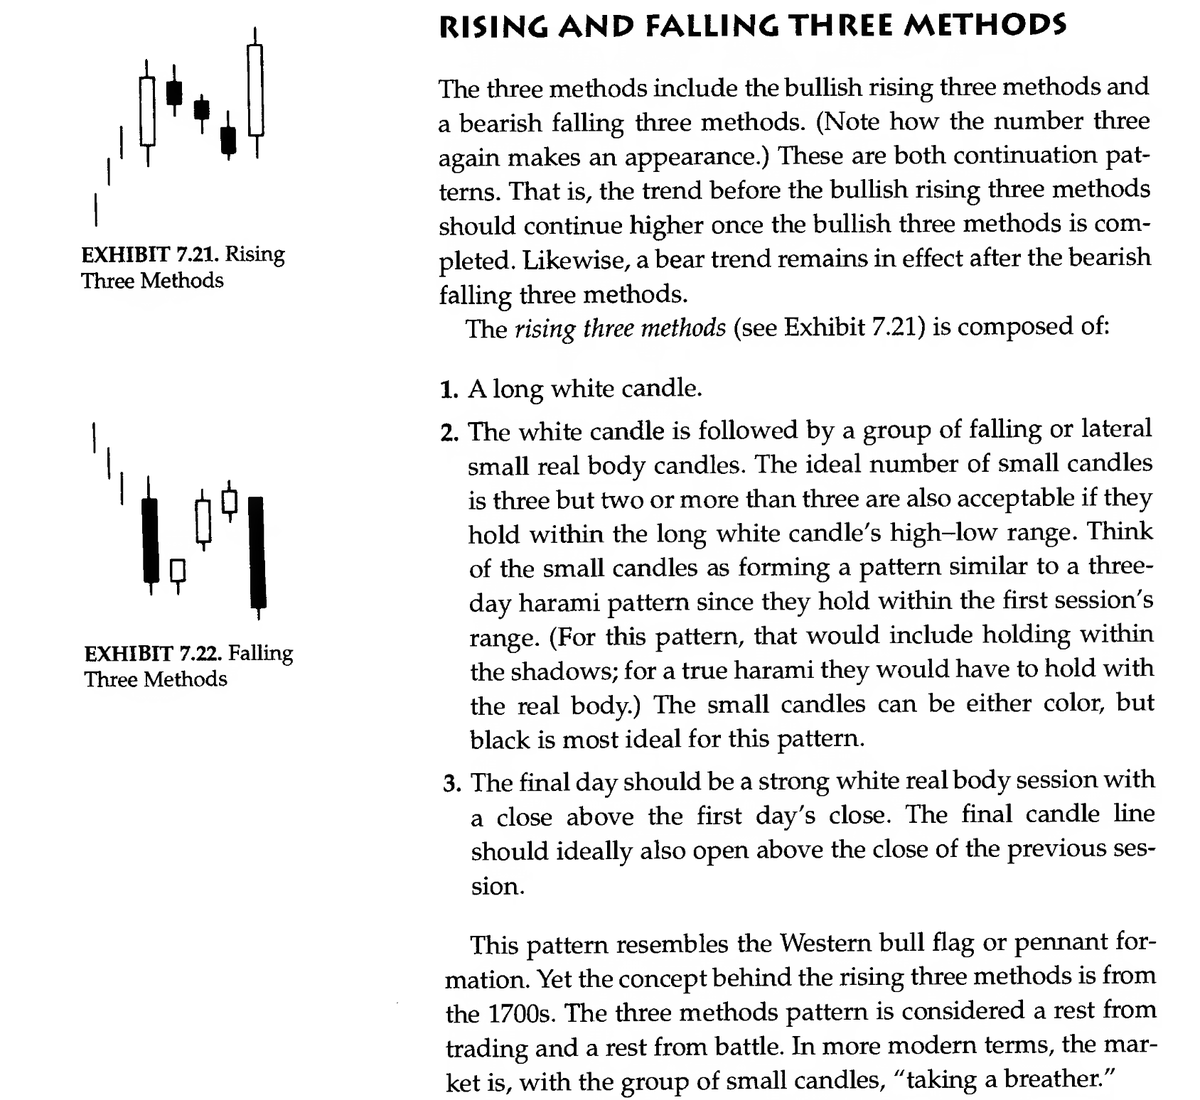
As described by Steve Nison in his book "Japanese Candlestick Charting Techniques", the Rising Three Methods is a bullish continuation pattern.
Now, let’s see if the candles tell the story. 📈
#Nifty #Banknifty #MahaBank
IIFL Capital Services has been showing tight price action over the last few months following its previous upmove.
The technical setup is interesting, but the fundamentals make it worth watching:
• Retail broking revenue +13% YoY
• Institutional + IB revenue +27% QoQ
• Operating margin expanded to ~35.8%
• Operating PBT +4% QoQ
• AIF & PMS AUM at ~₹4,400 Cr
Price is tightening while the underlying business continues to show resilience.
One to watch for a potential breakout. Volume expansion and relative strength would be key confirmations.
#Nifty #banknifty #swingtrading #IndianMarkets
BSE’s technical setup suggests that demand may be quietly returning.
Interestingly, this is happening despite recent brokerage downgrades and concerns around F&O volumes. With Nifty 50 inclusion coming up on September 30, the setup is worth watching.
If the chart starts improving while sentiment remains weak, it could be worth watching closely.
#Nifty50 #BankNifty #BSE
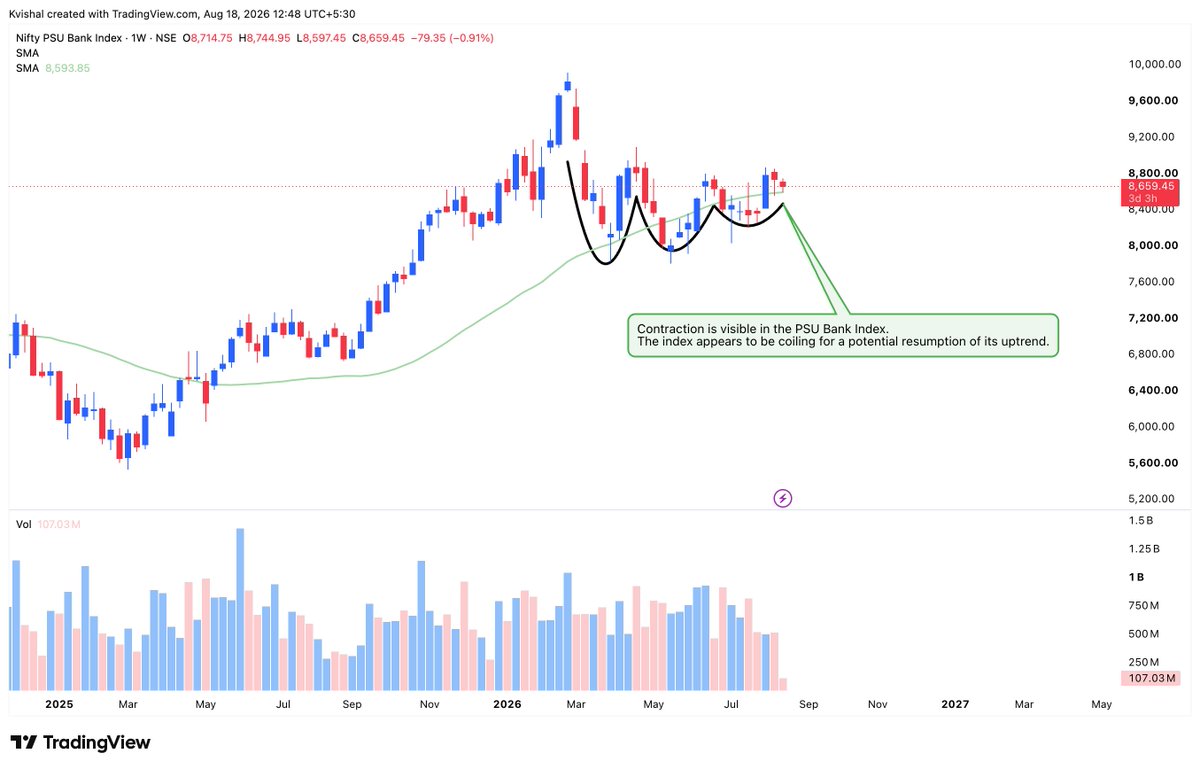
The PSU Banking Index looks like it is gearing up for a potential upmove.
Valuation:
The current P/E stands at 7.83, nearly 5% below its 5-year median P/E of 8.31. On this metric, the index appears reasonably valued, if not slightly inexpensive.
Technical Structure:
The index is attempting to find support around its 40-week moving average (green line).
While the weekly candle is still developing, the daily chart looks constructive. The underlying structure suggests that something may be brewing beneath the surface.
Now, we wait for confirmation.
#nifty #banknifty #PSUBANK