#USDCAD — WEEKLY TIMEFRAME FORECAST 📊
The Weekly market structure remains bullish. 📈
Price is now approaching our Weekly Order Block — a key area to watch.
🎯 Our Expectation:
If price retests the Weekly OB and respects the zone, we will look for bullish confirmation and potentially a long-term bullish move.
⚠️ This post is for educational purposes only and is not financial advice. We are not telling anyone to take or avoid this trade.
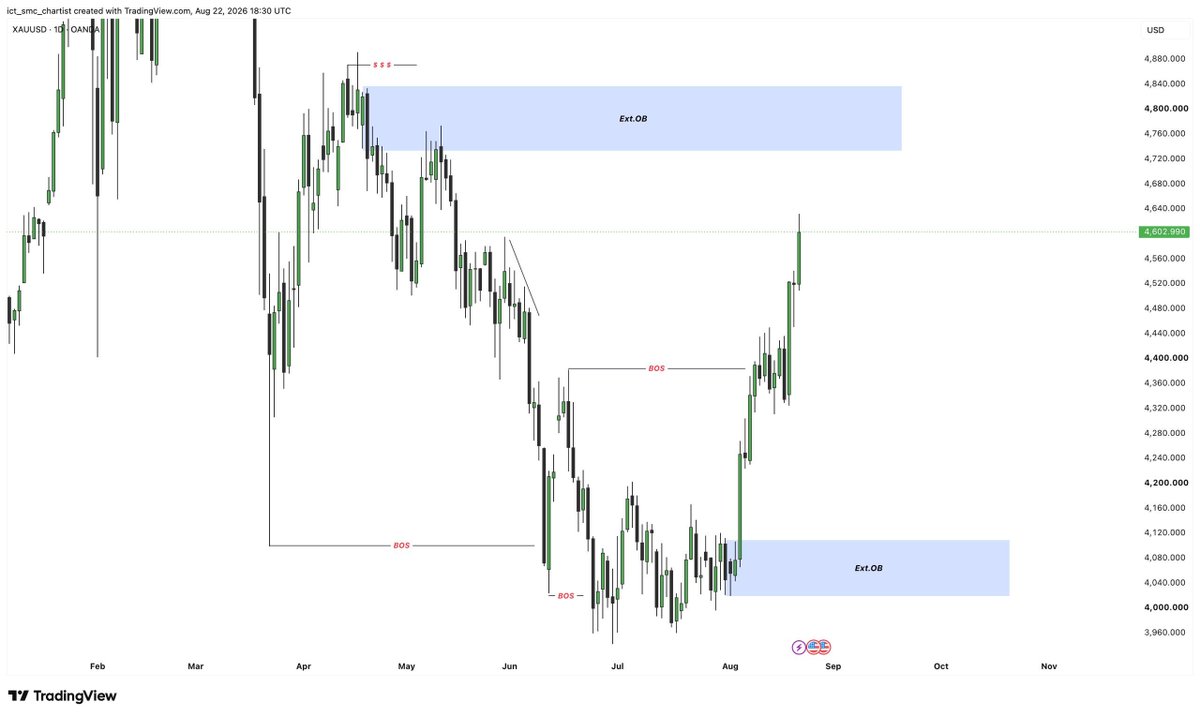
🥇 GOLD — DAILY TIMEFRAME FORECAST
The Daily market structure remains bearish. 📉
🔴 Extreme OB = Our Main Selling Zone for the Long Term
This is the key area we are watching for potential bearish continuation.
⚠️ We will NOT take a blind entry at the Extreme OB.
We will wait for proper confirmation before entering.
We have also marked important H4 & H1 key levels.
These levels remain valid until price retests the Daily Bearish OB.
No blind entries. No FOMO. Wait for confirmation. 🎯
⚠️ This post is for educational purposes only and is not financial advice. We are not telling anyone to take or avoid this trade.
₿ BTCUSD — DAILY TIMEFRAME FORECAST
The Daily market structure remains bearish. 📉
🔴 Extreme Order Block = Key Level
This is our main POI for potential bearish trend continuation.
When price reaches the Extreme OB, we will NOT take a blind entry.
We will wait for proper confirmation and structure reaction before entering.
**POI gives us the location.
Confirmation gives us the entry.**
⚠️ This post is for educational purposes only and is not financial advice. We are not telling anyone to take or avoid this trade.
🇪🇺🇺🇸 EURUSD — DAILY TIMEFRAME FORECAST 📊
The Daily structure remains bearish as long as the valid swing high holds.
🔴 Daily Bearish Order Block = Key Level
This is our main area for potential bearish trend continuation.
We have two scenarios:
🟢 SCENARIO 1 — H4 Pullback
If the market pulls back on H4, we will look for bullish opportunities from the H4 Bullish OB, targeting the Daily Bearish OB.
🔴 SCENARIO 2 — Daily Bearish OB Retest
If price reaches the Daily Bearish OB first, we will look for sell confirmation for a potential long-term bearish move.
🎯 Simple Plan
Daily Structure = Bearish
Valid Swing High = Bias Protection
Daily Bearish OB = Main Sell POI
H4 Bullish OB = Pullback Opportunity
Structure first → POI second → Confirmation → Entry.
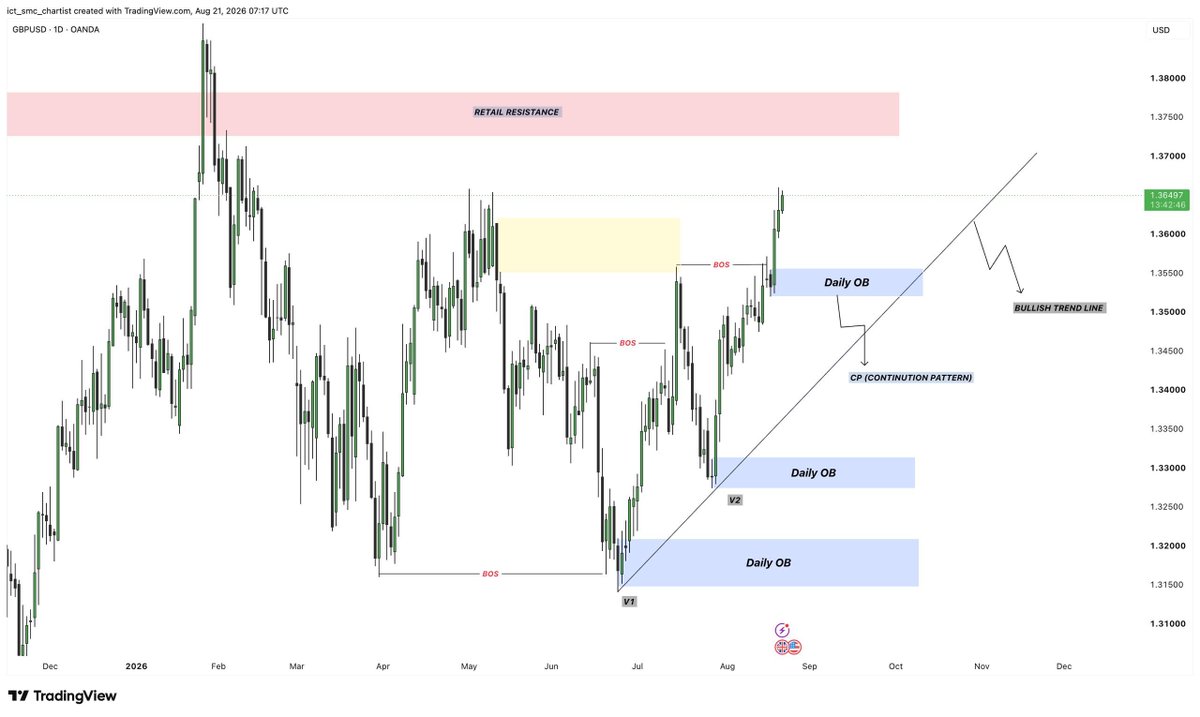
#GBPUSD DAILY + H4 ANALYSIS
📈 Daily TF: Bullish trend remains active with a strong bullish market structure + bullish trendline confluence.
📍 H4 TF: Our bullish POI levels remain the key zones to watch.
We are currently waiting for price to retest the H4 Bullish OB.
🎯 Trade Plan: If price reaches the H4 OB and gives confirmation, we will look for a BUY trade in the direction of the higher-timeframe trend.
⚠️ No chasing price — wait for the POI retest + confirmation.
#GBPUSD #Forex #SMC #ICT #SmartMoney #PriceAction #ForexAnalysis
The idea behind this bullish setup:
Liquidity was taken → MSS confirmed → Order Block/FVG respected → Entry → Buy-Side Liquidity became the target.
Patience + confirmation = cleaner execution. 📈
Educational content only. Not financial advice.
#ICT#SMC
#GOLD WEEKLY FORECAST & POI LEVELS
In this video, we cover Gold from Weekly → Daily → H4 → H1 and identify the key Institutional POI Levels to watch.
📊 Weekly & Daily Bias
🎯 H4 + H1 POI Levels
💧 Liquidity & Market Structure
🔄 Reversal & Continuation Scenarios
⚡ Entry Confirmation Areas
We are not chasing the market — we are waiting for price to reach our POIs and confirm the structure.
Watch the full analysis and prepare for the next Gold move. 🔥
#GOLD #XAUUSD #GoldAnalysis #Forex #ICT #SMC #Trading
📊 USDCAD WEEKLY + H4 ANALYSIS
📈 Weekly TF: Market structure is bullish, and price is now moving toward a Weekly Bullish OB for a potential retest.
📉 H4 TF: Short-term trend remains bearish until price reaches the Weekly Bullish OB.
📍 H4 Bearish POI: We have key bearish POI levels for potential selling opportunities.
🎯 Trade Plan:
If price does not reach the Weekly Bullish OB, our H4 Bearish POI levels remain valid for bearish continuation.
⚠️ Weekly Bias = Bullish | H4 Trend = Bearish retracement
Wait for price to reach the POI and confirmation before entering.
#USDCAD #Forex #SMC #ICT #SmartMoney #PriceAction #ForexAnalysis
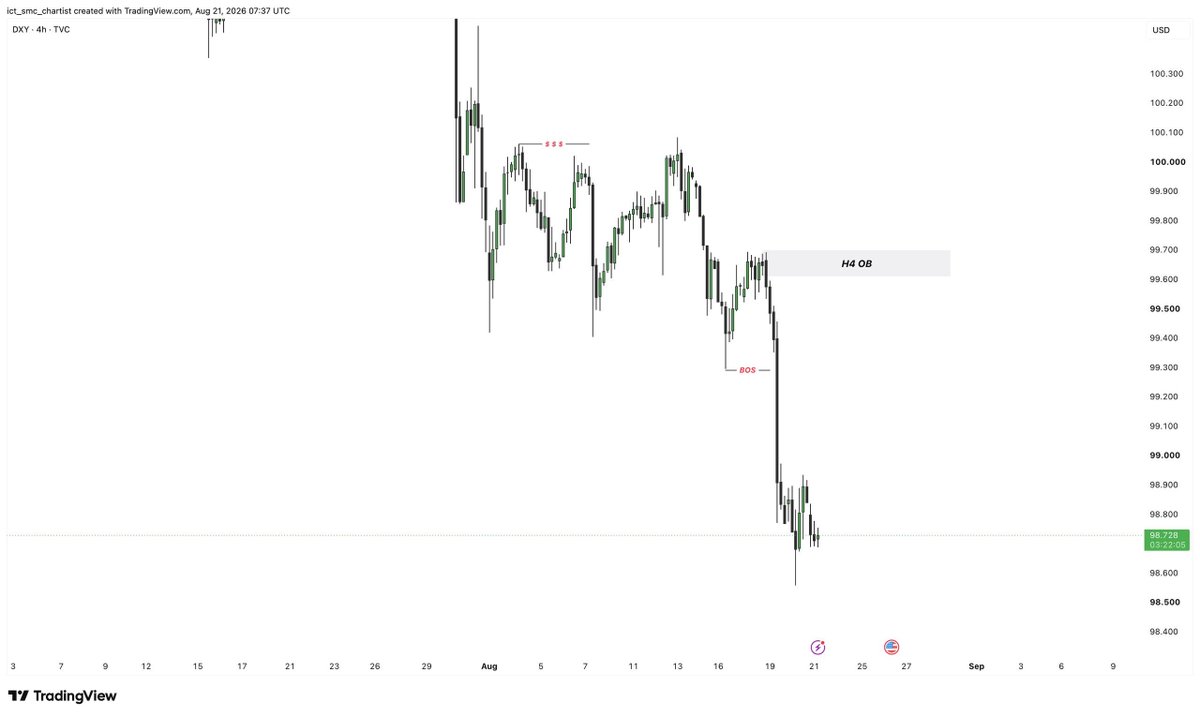
📊 DXY DAILY + H4 ANALYSIS
📈 Daily TF: Bullish market structure remains active.
📍 Daily Bullish OB: This is our key zone for long-term bullish continuation.
📉 H4 TF: Short-term structure is currently bearish, with the H4 Bearish OB remaining valid for potential selling opportunities.
🎯 Trade Plan: We will look for H4 bearish continuation until price reaches the Daily Bullish OB.
⚠️ HTF Bias = Bullish | H4 Trend = Bearish Retracement
Wait for the POI + confirmation before entering.
#DXY #DollarIndex #Forex #SMC #ICT #SmartMoney #PriceAction #ForexAnalysis
#Xauusd The setup was simple:
1️⃣ Buy-Side Liquidity sweep
2️⃣ Bearish displacement
3️⃣ BOS confirmation
4️⃣ Retracement into OB + FVG
5️⃣ Sell entry
6️⃣ Sell-Side Liquidity target 🎯
We waited for the market to confirm before entering.
Not financial advice. Educational content only.
#Trading #SMC #GoldTrading
We’ll wait for price to reach the Daily OB.
Then, on the lower timeframe, we’ll look for a liquidity sweep + MSS/BOS confirmation before taking the entry.
No confirmation = No trade.
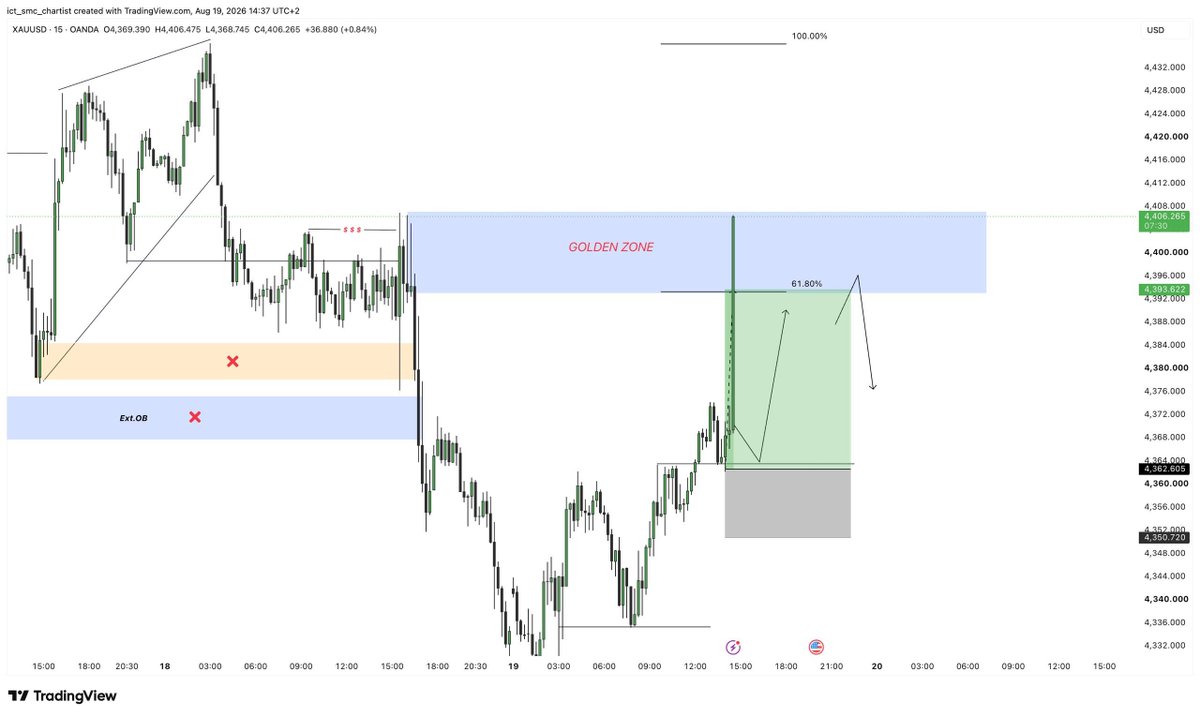
Gold Analysis → Target Hit ✅🎯
15M structure gave us the area of interest.
Golden Zone + 61.8% = key reaction area.
Price tapped the zone and delivered the expected move.
Another setup executed according to the plan.
#XAUUSD#ICT