Retoucher and Student of Market
⚠️ Not a financial adviser. Do your own research. Not SEBI registered
(All posts and Charts are for Educational Purpose only )
Nifty// Prediction theory based on the past chart. There are three points I mentioned. Zoom in to read them and save the post.
Point 1: 2 years of consolidation before 2020 correction and just like that happened now in 2026
Point 2: 38 percent (monthly) retracement comes exactly at retracement closing (Swing low is 2008 correction and swing high is 2020 high)
Point 3: Similar swings and retracement prediction 38 percent correction comes near to 19200 but can wick below 18200 to 18600 range for quick reversal.
All these mentioned here is just based on past study if cycle repeats.
(Not a financial adviser. Do your own research. Not SEBI registered. All posts and Charts are for Educational Purpose only. I am just chart(Math) enthusiastic)
#nifty #sensex
Nifty// Does anybody predicted this? That too in July? Some good serious accuracy here? check the attached post with diagram. Leave your questions if any. (Not a financial advisor, just chart enthusiastic, Do your own reasearch before buy/sell) #nifty#sensex#niftycrash
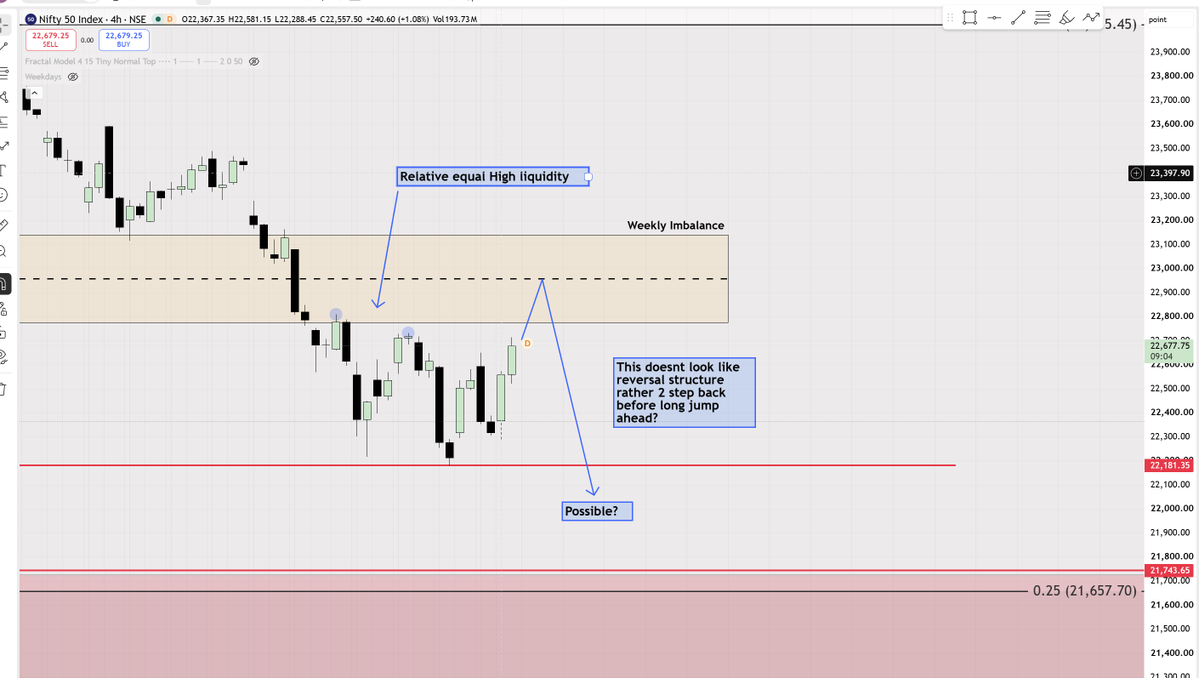
Nifty// Does it look like manipulation move? 2 step back before long jump kind of? Important to see how does it react in this gap but surely doesn't look like reversal structure. I could be wrong totally. Just a view. #nifty#sensex
(Just study Purpose, I am not an advisor)
@MagicNifty People operate on emotions only. Ultimately they forget whatever they are invested in is their choice according to their risk appetite. You have given valuable studies always. And Market is all about probabilities.
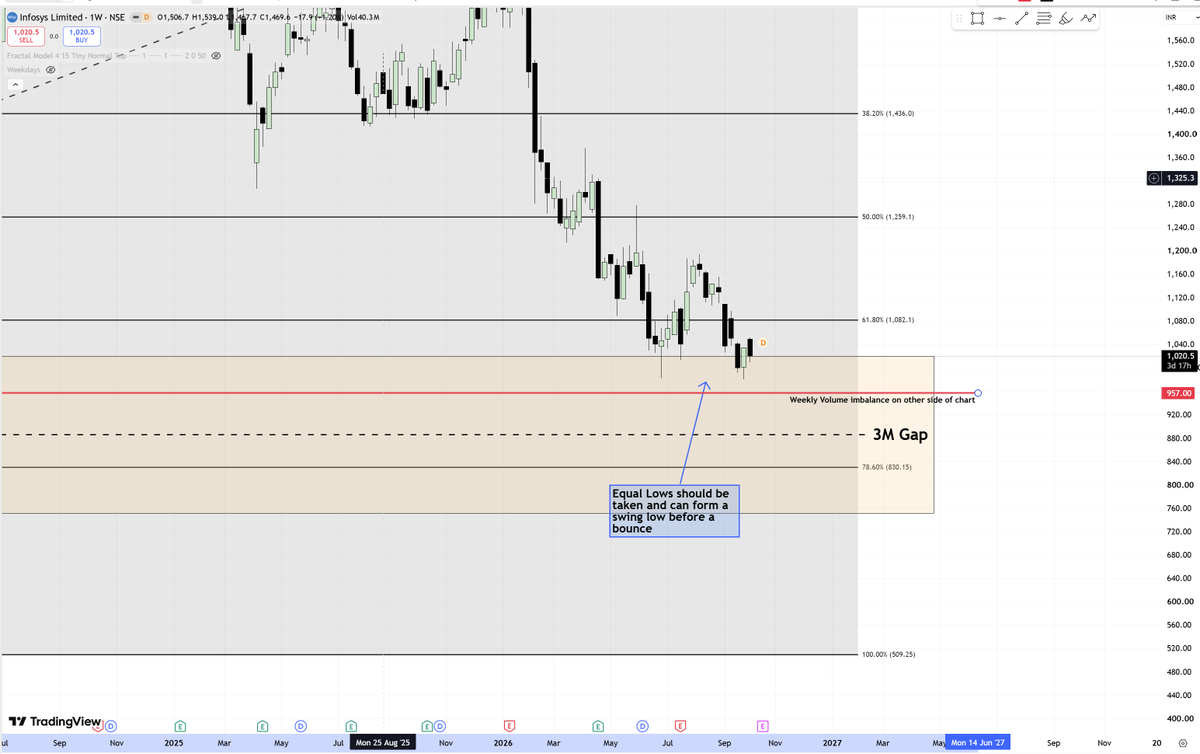
Infosys// Forming a equal low and opening candle of Monday is bearish. Can retrace into deeper 3M GAP? There is some imbalance present at 957 on other side of the chart. Interesting to see how does it work out.
#infy#infosys
(Not a financial adviser. Do your own research. Not SEBI registered. All posts and Charts are for Educational Purpose only. I am just chart enthusiastic)
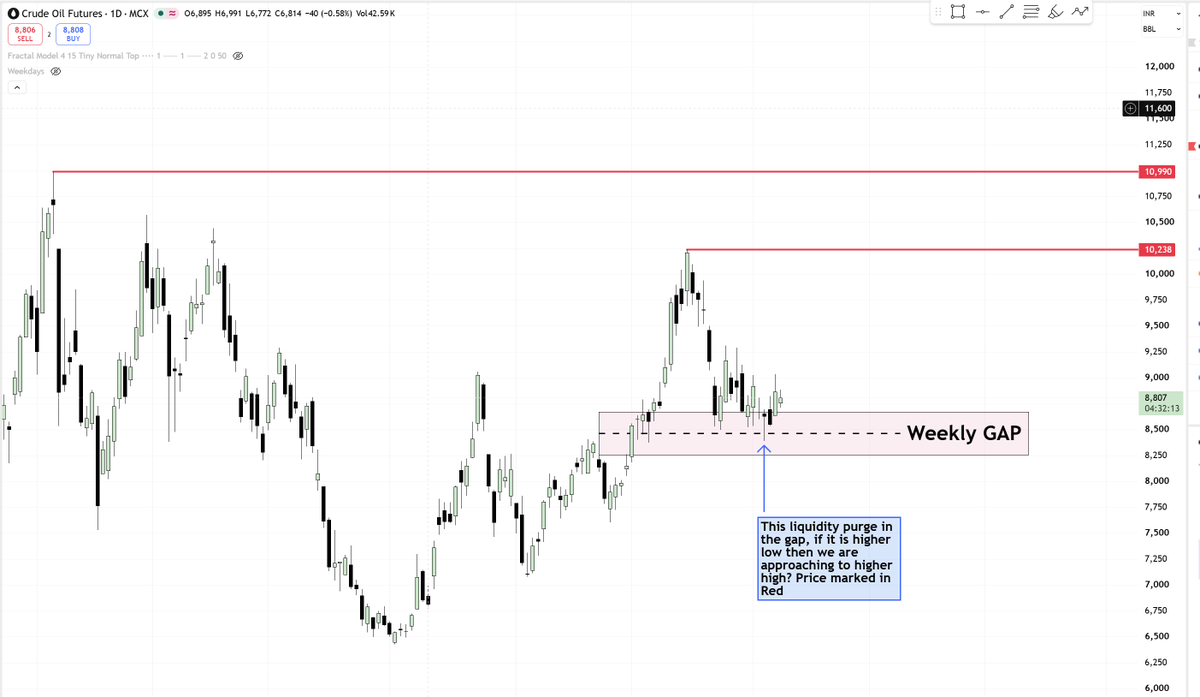
Crude Oil//Brent// Sharing two chart here of brent and Crude oil(MCX) and both are looking in up trend. If this liquidity purge is higher low then we might approach higher high towards 10238 INR/113 USD. Nifty has tough road ahead? I think so.
#crudeoil#brent#niftyfifty
(Not a financial adviser. Do your own research. Not SEBI registered. All posts and Charts are for Educational Purpose only. I am just chart enthusiastic)
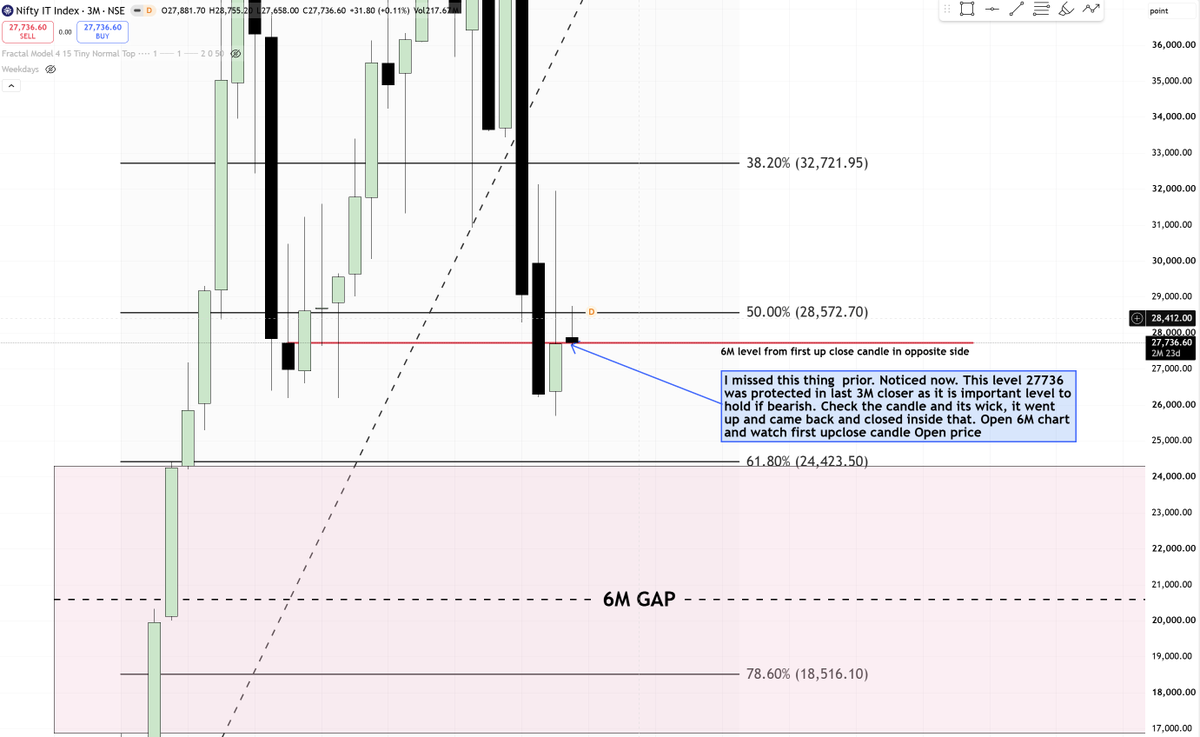
NiftyIT// Something sharing on HTF chart which I missed in previous sharing (My mistake as I need to check bearish side view equally). Bearish closer of previous 3M candle well below the first bullish candle on opposite side (check 6M chart for that). What does it mean:? Means it is holding the bearishness. Zoom in and watch. If it doesn't hold next station is 61 percent (6M gap) probably 24k. Let's see how does it reacts now.
#niftyIT #infosys
(Just study purpose sharing here, I am not an advisor)
US suspends Infosys, TCS, Wipro, HCL and others from green-card labour programme.
So this is why this liquidity was building at the bottom?
#niftyIT#infy#tcs
Infosys// Forming a equal low and opening candle of Monday is bearish. Can retrace into deeper 3M GAP? There is some imbalance present at 957 on other side of the chart. Interesting to see how does it work out.
#infy#infosys
(Not a financial adviser. Do your own research. Not SEBI registered. All posts and Charts are for Educational Purpose only. I am just chart enthusiastic)
TCS// Are we getting weekly closing above this green inverted Bullish Gap which is working as resistance now. ? or touching 2000 one more time?
#TCS
(Not a financial adviser. Do your own research. Not SEBI registered. All posts and Charts are for Educational Purpose only. I am just chart enthusiastic)
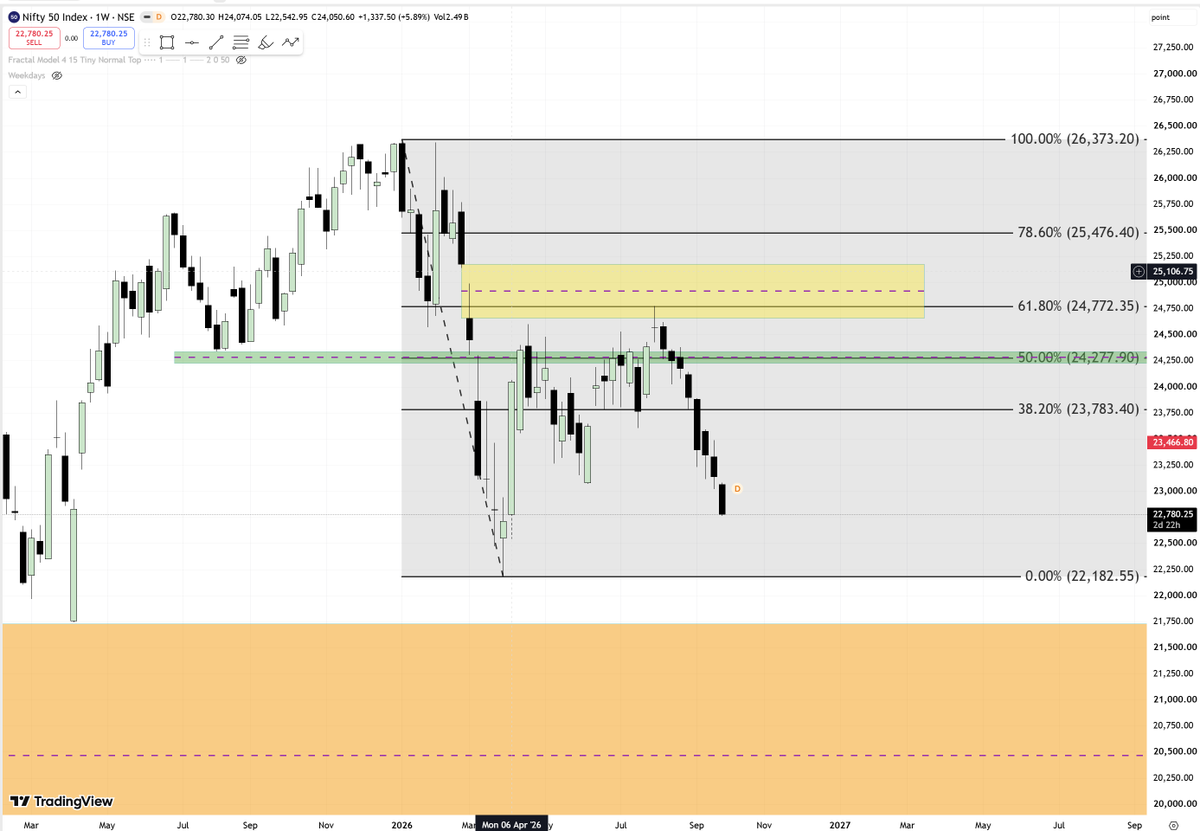
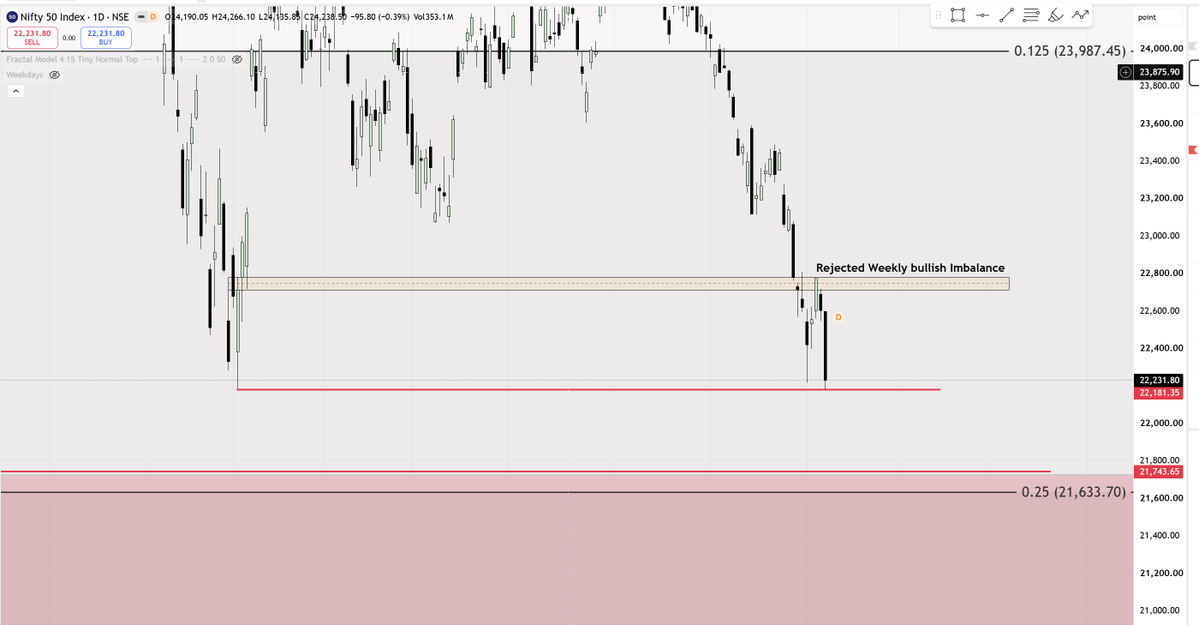
Nifty// Remember these levels 21743 and 21633. In HTF swing low is 21743 only. this 22230 was failure swing made for liquidity generation.
#nifty
(Not a financial adviser. Do your own research. Not SEBI registered. All posts and Charts are for Educational Purpose only. I am just chart enthusiastic)
Nifty// Prediction theory based on the past chart. There are three points I mentioned. Zoom in to read them and save the post.
Point 1: 2 years of consolidation before 2020 correction and just like that happened now in 2026
Point 2: 38 percent (monthly) retracement comes exactly at retracement closing (Swing low is 2008 correction and swing high is 2020 high)
Point 3: Similar swings and retracement prediction 38 percent correction comes near to 19200 but can wick below 18200 to 18600 range for quick reversal.
All these mentioned here is just based on past study if cycle repeats.
(Not a financial adviser. Do your own research. Not SEBI registered. All posts and Charts are for Educational Purpose only. I am just chart(Math) enthusiastic)
#nifty #sensex
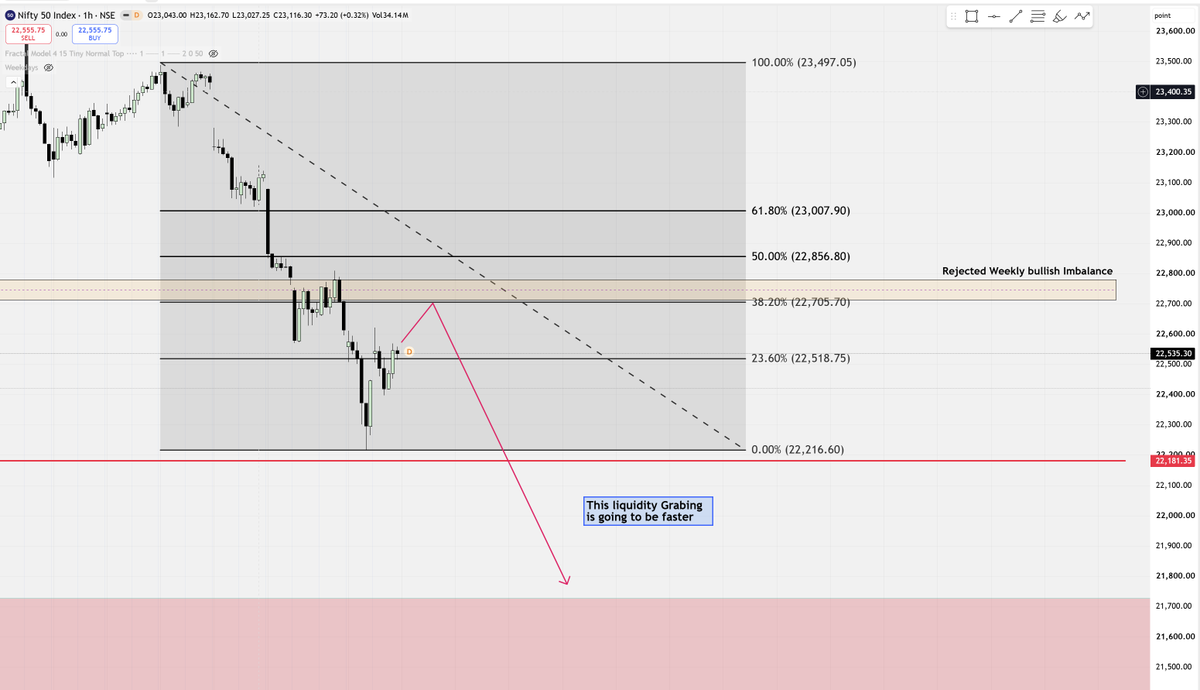
Nifty// This slight bounce before grabbing swing low at 22180 should not hold more and should not retrace beyond 50 percent as well. There is Weekly bullish imbalance area which was rejected and closed below, also aligning with 38 percent. Can retrace back to there before grabbing the swing low with speed? We will see in 2 days mostly. Currently it is at good fib level of 23 percent which could also end this temporary bullish retracement before grabbing liquidity.
#nifty #sensex
(Not a financial adviser. Do your own research. Not SEBI registered. All posts and Charts are for Educational Purpose only. I am just chart enthusiastic)
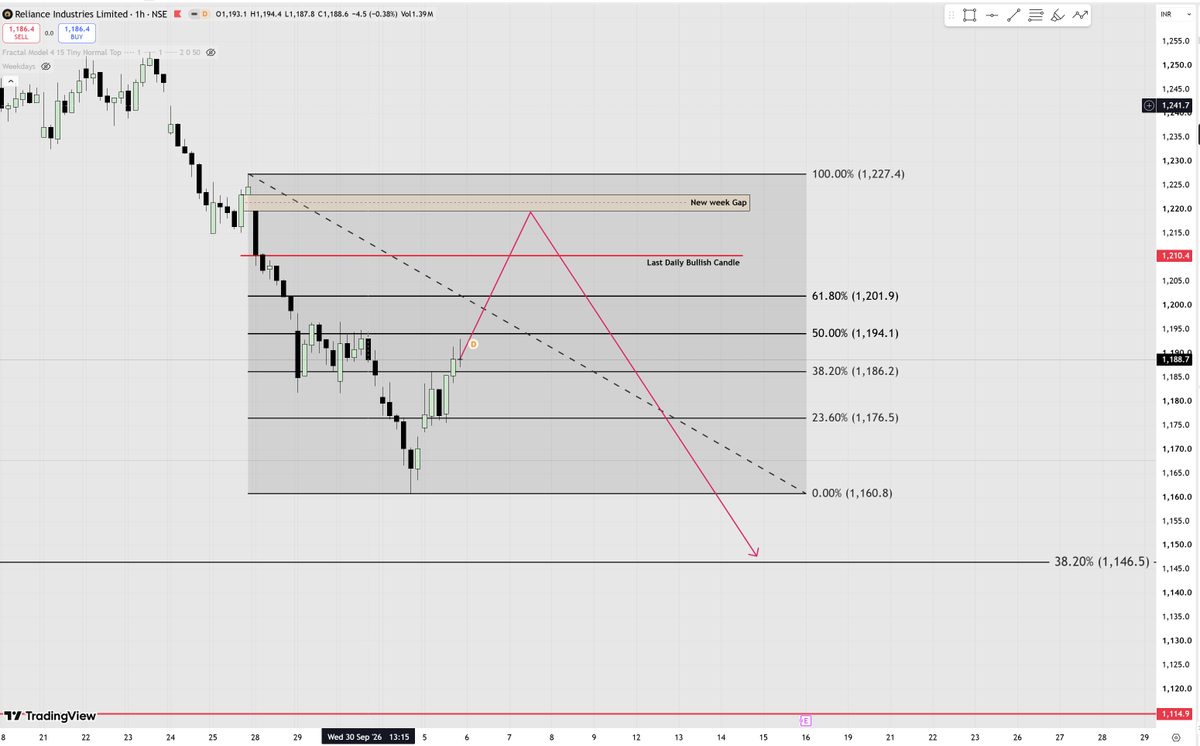
Reliance Industries// Expecting a reaction above 50 percent for further sell off. Key levels mentioned to keep a watch. If close above 1227 then this view is discarded. There is a new week opening gap as well which works as a magnet always. #reliance
(Not a financial adviser. Do your own research. Not SEBI registered. All posts and Charts are for Educational Purpose only. I am just chart enthusiastic)
Nifty// Prediction theory based on the past chart. There are three points I mentioned. Zoom in to read them and save the post.
Point 1: 2 years of consolidation before 2020 correction and just like that happened now in 2026
Point 2: 38 percent (monthly) retracement comes exactly at retracement closing (Swing low is 2008 correction and swing high is 2020 high)
Point 3: Similar swings and retracement prediction 38 percent correction comes near to 19200 but can wick below 18200 to 18600 range for quick reversal.
All these mentioned here is just based on past study if cycle repeats.
(Not a financial adviser. Do your own research. Not SEBI registered. All posts and Charts are for Educational Purpose only. I am just chart(Math) enthusiastic)
#nifty #sensex
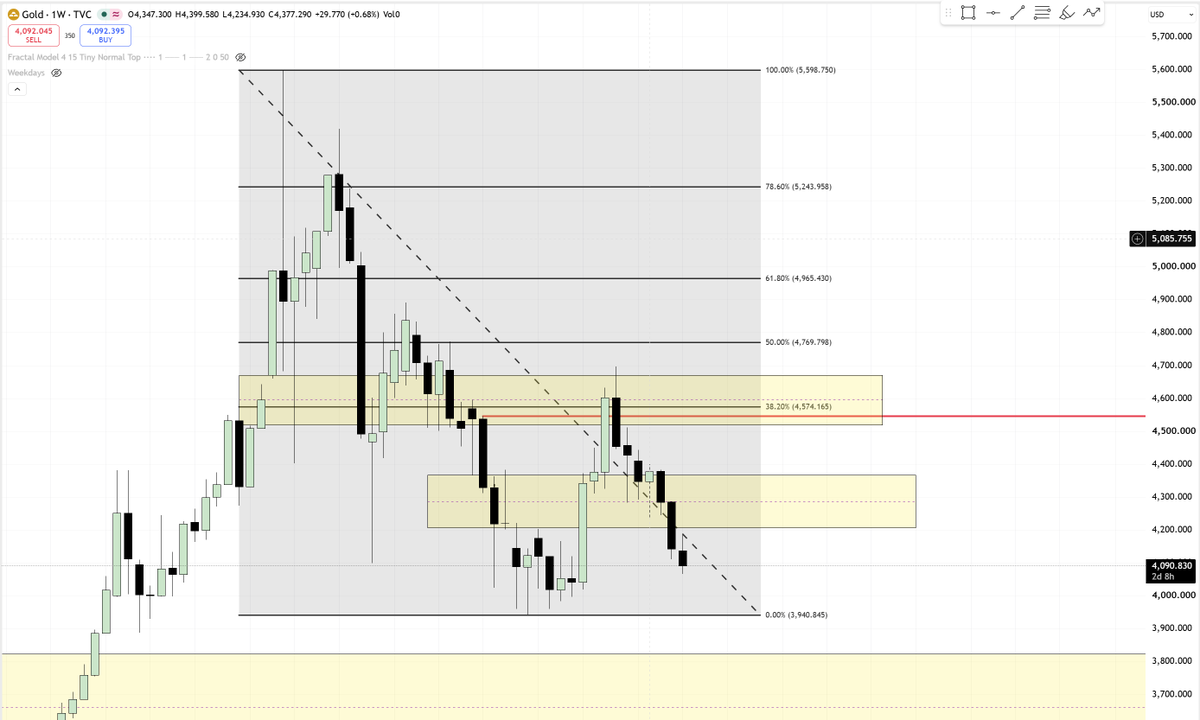
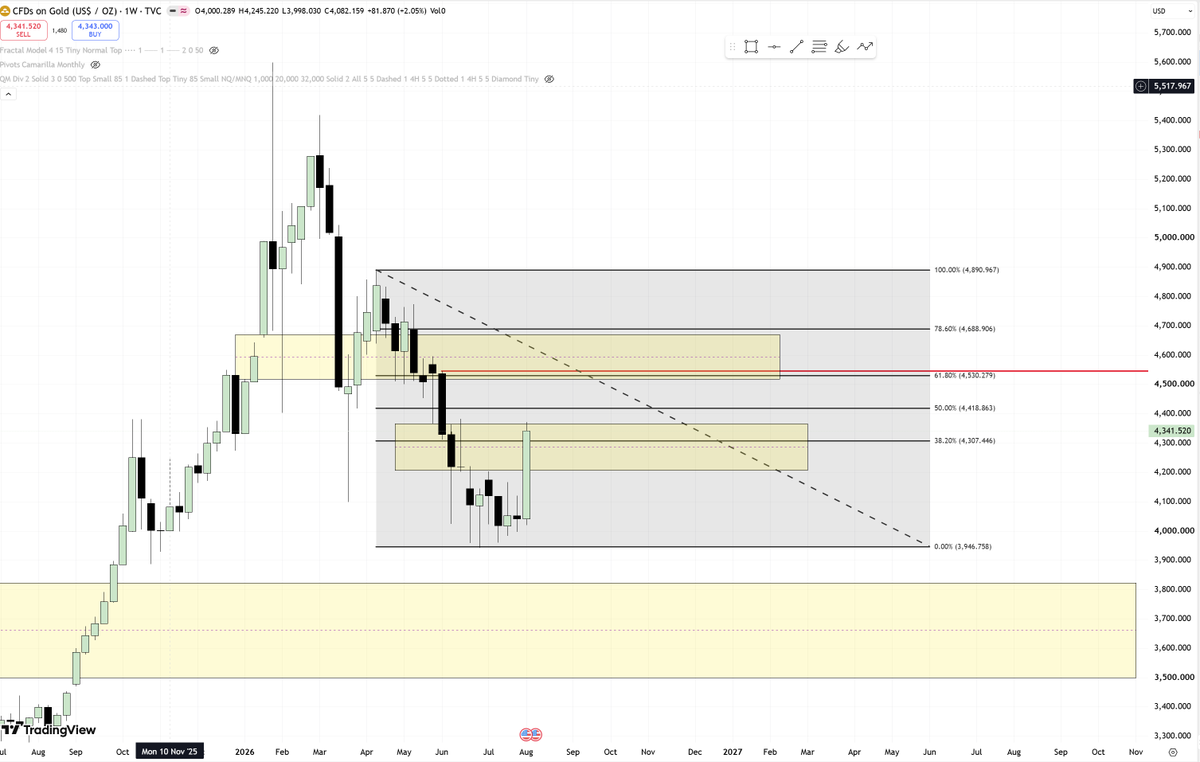
GOLD(USD)//The prediction of bearishness on 8th Aug and see the reaction.
(Not a financial adviser. Do your own research. Not SEBI registered. All posts and Charts are for Educational Purpose only. I am just chart enthusiastic)
#gold#goldusd
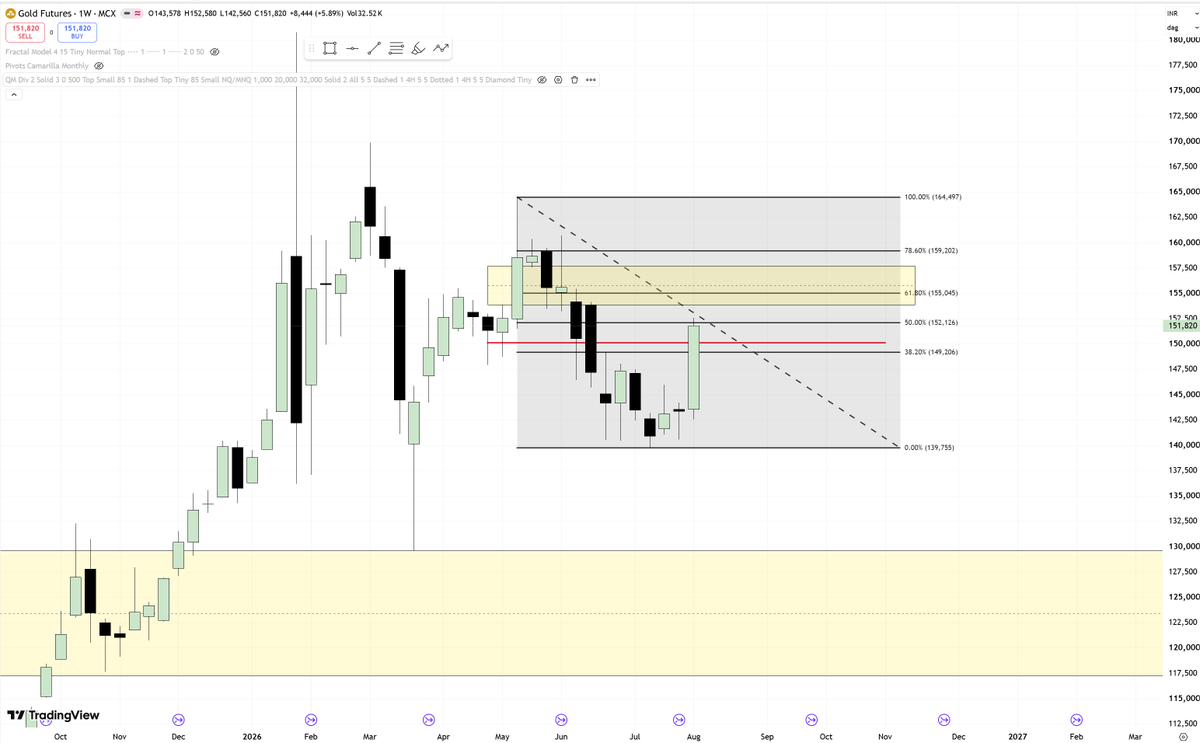
It seems to be bullish on gold it is important to close at the end of the month above 61 percent line which is 4537 USD or 1,55,118 INR. As per chart it seems bearish can come under 130k #gold#mcx#indiangold#goldchart (Just study purpose, no advices)
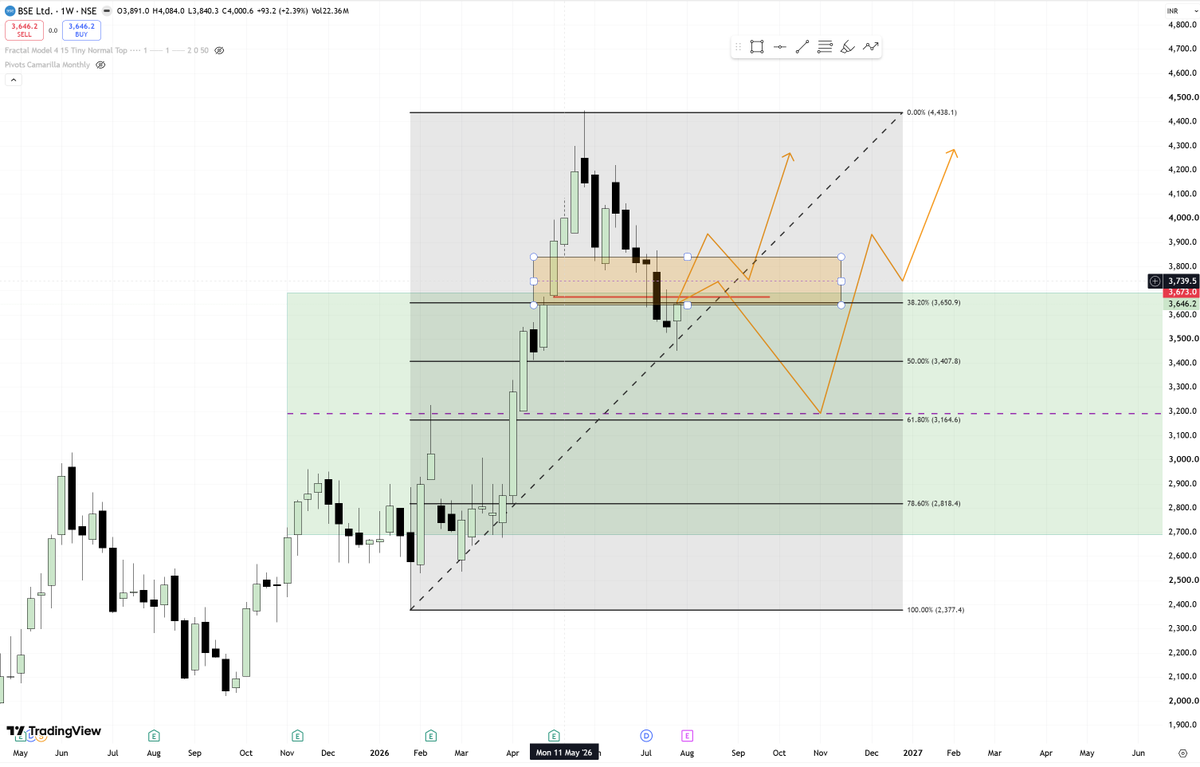
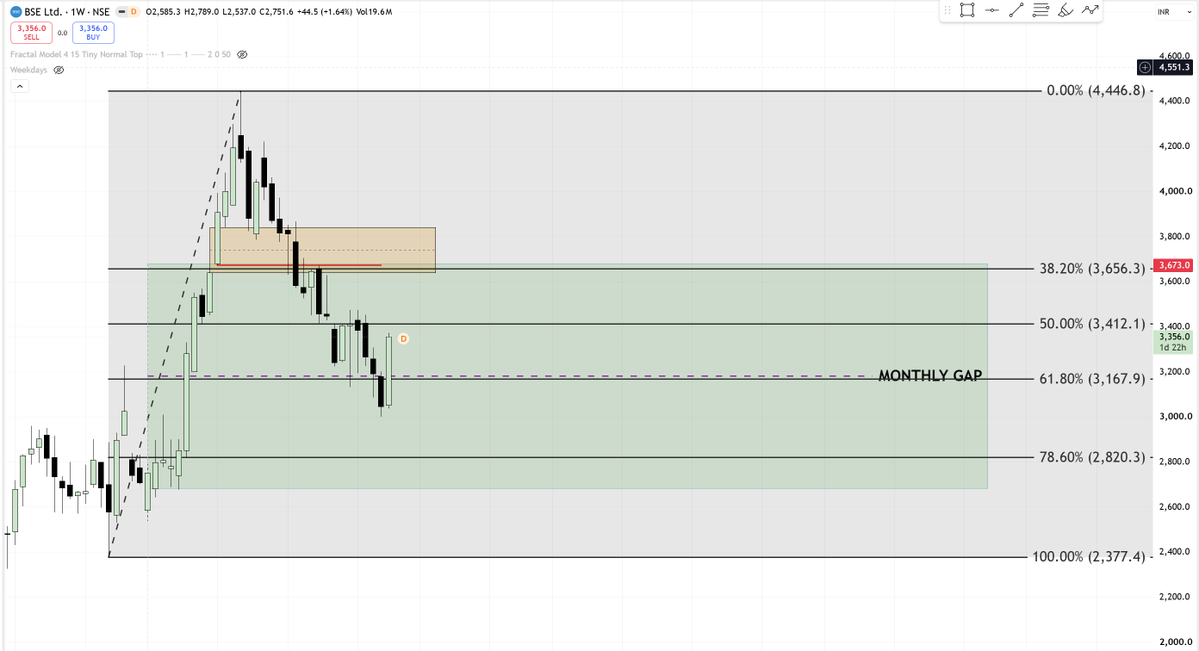
BSE// Prediction Vs Reaction. Let's see if it holds or not.
In bullish scenario,
Should make swing high above 38 percent. (Around 3700 in Orange area?) Also we want weekly body to close above 3474 (basically above 50 percent) first in order to confirm the weekly bullishness.
#BSE
(Not a financial adviser. Do your own research. Not SEBI registered. All posts and Charts are for Educational Purpose only. I am just chart enthusiastic)
Expectations of What BSE can do. A closer below weekly gap and previous monthly bullish candle but already retraced 38 percent. #BSE#nifty (Edu purpose only, no advices here)