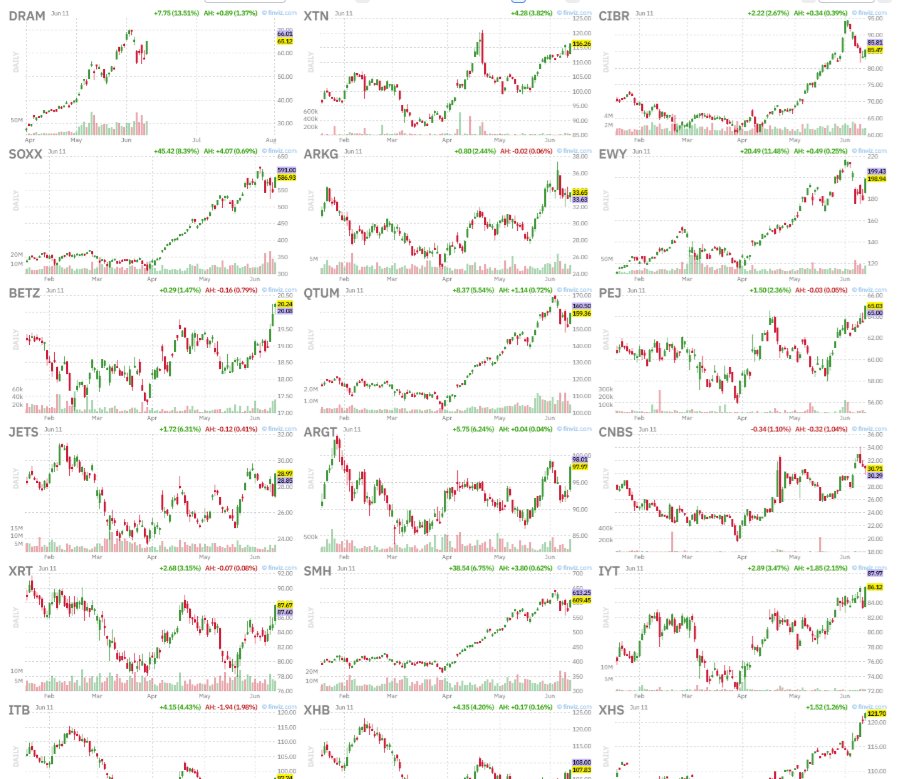
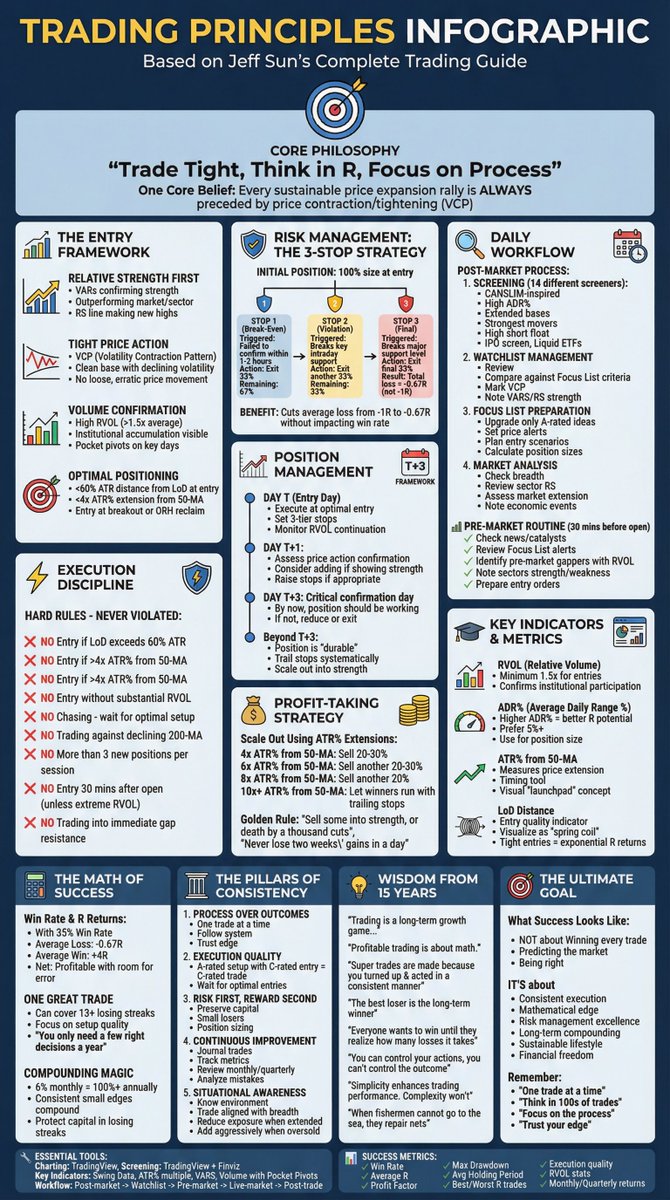
@ProfitsTaken Its verdict: "Definitely worth following, especially for tactical levels, sector rotation, and trade ideas."
Its only complaint? You brag about your wins a little too much 😂
Maybe AI is just jealous? LOL
@ProfitsTaken Hi PT.
I've been using AI to break down your briefings over the past few weeks and pull out the key trade ideas. It's worked incredibly well — my account is at all-time highs.
I even asked AI what it thinks of your work... 👇
@ProfitsTaken My account is going to the moon just by buying shares, following the analysis of @ProfitsTaken. I can't imagine how far it can go if I start using the Algo.
Learned this rule on the floor 45 years ago and it still holds true 90% of the time (or so it seems): "If a stock does not trade into its GAP area the next 4 days, it can continue in the direction of the gap for 2 weeks. can see how this worked perfecetly the past two months on big blue!
🚨EZPZ just made the Scientific Predictive CandleScope page available to the public. (Watch the video)
Page Link:
https://t.co/amRmFwdcLl
Our Predictive CandleScope forecasts the next 24-hour move using pattern recognition, Monte Carlo simulations, IV, and demand-based expected move.
It gives you a projected range, upside probability, and volatility projection so you can plan better trades instead of guessing.
This page is public and available to everyone.
Study it. Use it. Let the data do the talking.
Here is the video on how to use it.
Please like, retweet, and comment so this reaches more retail traders.
Turns out Ackman rolled $GOOG proceeds into $MSFT.
This is a great way to play this market:
- Buy a mega-cap below its mean P/E
- Exit when it goes above mean
- Buy another mega-cap below mean P/E
Their businesses are so strong that mean reversion is almost inevitable.
Hace tiempo que no hacía un vídeo…
Un fragmento de la mentoria de ayer… análisis desde cero… ¿cómo se hace?
Guárdatelo, te será de ayuda saber lo que miro para tomar decisiones
Si te aporta se agradece ❤️y 🔄
El NASDAQ es predecible, Si Sabes ICT + CRT - Análisis Completo
https://t.co/cmPpp7JB7D
Mañana es Sant Jordi! 🐉📚🌹
El 23 de abril en Cataluña , regalamos libros y rosas, ¡es un clásico!
Para celebrarlo, ¡sorteo una SUSCRIPCIÓN ANUAL a mi newsletter de pago! 🎉
Para participar:
1. Dale Like ❤️
2. Haz RT 🔄
¡Mucha suerte!
This is the kind of market where you simply buy what the president tells you to:
Rare Earths
$CRML Critical Metals
$TMC The Metals Company
$USAR USA Rare Earth
Defense
$SKYT SkyWater Technology
$KTOS Kratos
$KRMN Karman
$AMTM Amentum
AI Infrastructure
$GOOGL Google
$NUAI New Era
$NBIS Nebius
$IREN IREN
$HUT Hut 8
Critical Minerals
$TMQ Trilogy Metals
$UUUU Energy Fuels
$UAMY United States Antimony
Energy
$BE Bloom Energy
$GEV GE Vernova
$PWR Quanta Services
Chips
$TSM TSMC
$INTC Intel
$NVDA NVIDIA
$AMD AMD
Memory
$SNDK Sandisk
$MU Micron
$STX Seagate
$WDC Western Digital
Space
$RKLB Rocket Lab
$ASTS AST SpaceMobile
$PL Planet Labs
$FLY Firefly Aerospace
$RDW Redwire
Drones
$ONDS Ondas
$UMAC Unusual Machines
$RCAT Red Cat
Nuclear
$LEU Centrus Energy
$CCJ Cameco
$OKLO Oklo
$BWXT BWX Technologies
Autonomous Vehicles
$TSLA Tesla
$AEVA Aeva Technologies
Robotics
$SERV Serve Robotics
$AMZN Amazon
$ARBE Arbe Robotics
Batteries
$TE T1 Energy
$EOSE Eos Energy Enterprises
$ELVA Electrovaya
$FLNC Fluence Energy
$SPY: Pay attention to gamma exposure and the gamma-flip level. It can materially improve your trading. This Friday’s gamma flip is near $676. Below that level, volatility tends to increase; above it, the market often stabilizes, and you can favor standard-deviation bands, reversal trading, and range trading.
Here's a simple guide on how to read GEX:
Understanding Gamma and GEX:
Gamma measures the rate of change of delta with respect to the price of the underlying asset. It indicates how much the delta of an option changes as the stock price changes. Gamma Exposure (GEX) is the total gamma of all options on a particular stock or index, aggregated across all strikes. It reflects the potential hedging activity needed by market makers.
Positive vs. Negative GEX:
Positive GEX: When Gamma Exposure (GEX) is positive, market makers sell as the price goes up and buy as the price goes down. This behavior counteracts price movements and tends to stabilize the asset's price, reducing volatility.
Negative GEX: When GEX is negative, market makers will buy as the price goes up and sell as the price goes down. This action amplifies price movements, leading to increased volatility.
Interpreting GEX Values:
High Positive GEX: Suggests a more stable market environment as market makers' hedging activities counteract price movements, reducing volatility.
High Negative GEX: Indicates a potentially more volatile market as market makers' hedging activities could amplify price movements.
Using GEX in Trading:
Market Stability vs. Volatility: Use GEX to gauge whether the market is likely to experience higher volatility or remain stable. Positive GEX might suggest selling options to take advantage of low volatility, while negative GEX might suggest buying options to profit from potential increased volatility.
Hedging Strategy: If you’re trading options, understanding GEX can help you anticipate how market makers will hedge their positions, potentially offering clues about future price movements.
Practical Example:
If the S&P 500 has a high positive GEX, it suggests that any sharp move up or down may be met with counteracting trades by market makers, leading to a reversion to the mean. Conversely, if GEX is highly negative, sharp moves might lead to further exacerbated movements as market makers adjust their hedges.
This strategy makes me 6 figures a month
No secret indicator or tool just price action and volume
simple and repeatable
Below you can steal my exact swing trading strategy:🧵👇