$USDT D. + $USDC D. HTF:
There are 3 major important key levels I'm watching for the long term in correlation with Bitcoin.
- 9.43%/10% -> first "watershed" -> HTF EQ + HTF breakers + break & test of November-January re-accumulation range.
- 6%/7% -> cluster of very HTF demands in discount from where we saw the big corrective impulse
- 13%/15% -> cluster of very HTF supplies in premium where the probabilities for seeing a nice bullish swing on BTC are quite high in my opinion
We also have to take note that on October we have the major pivotal date for a potential BTC bottom based on time.
Will be important to check the price action before the pivotal date, ideally 2 months before.
⭕️FULL EDUCATIONAL ARCHIVE⭕️
This is the complete "archive" of all the most important educational post I created during these years.
Hours and hours of intense work condensed into 1 single post, so you'll be able to study this free material that I think will truly take you to the next level.
1. Liquidity related technical concepts:
https://t.co/awvo0Jij2Z
2. Way of charting from scratch:
https://t.co/rZjUQkHmyq
3. The importance of candle closures:
https://t.co/55nKllggiA
4. The importance of candle closures pt.2:
https://t.co/AuVRC2SZR1
5. The truth behind supply & demand levels:
https://t.co/4IvnCjXu8c
6. Fibonacci reverse sequence:
https://t.co/rc3V0SVWNx
7. Fibonacci extensions in play:
https://t.co/VV9SKGY4Rt
8. Setting targets based on data:
https://t.co/Qdv2qRXoSo
9. The truth behind fundamentals: (in crypto)
https://t.co/MHXq4E8b0r
10. How influencers scam you:
https://t.co/fKPvjg5MDY
11. How influencers scam you pt.2:
https://t.co/bxg1Oqj3TP
12. Reprogramming your mind for taking profits:
https://t.co/KPQYryk9uO
13. Order blocks guide:
https://t.co/UG2DW1CCb7
14. HTF distribution in play (no fundamentals):
https://t.co/imXMYSG81Q
15. Fair Value Gaps:
https://t.co/xByxZYQgLS
16. Distribution at Fair Value Gap:
https://t.co/64rUPPvkB9
17. Fibonacci insights:
https://t.co/D5DO1qiosi
18. Fibonacci settings:
https://t.co/74piO8akuX
19. Compound game:
https://t.co/aHc0xSl6fJ
20. Taking profits & strategies:
https://t.co/gQ4lL2oCNI
21. The game of inefficiency, liquidity and orders:
https://t.co/UjA2o3Wqyb
22. Backtesting a strategy:
https://t.co/jTZhPFsQ8t
23. The quintessential mental model of a real trader:
https://t.co/l95ZyGdT4E
24. Using volume areas to form a bias + repricing and migration of value + using defensive levels to place the stop + execution of a MTF long inside an HTF range:
https://t.co/Cqsl1AV5c7
25. Value migration theory + understanding market's behavior and placing trades + protection levels:
https://t.co/QplrrYYJIa
26. AMT full framework:
https://t.co/D9GLAYjotw
27. Understanding capital rotation:
https://t.co/vdVBGJRNFA
28. Intermarket analysis:
https://t.co/6V9m7XxvBK
29. Intermarket cheat sheet:
https://t.co/8i7troUv8O
30. How to form a bias with intermarket analysis + spotting opportunties + capital rotation + alpha & beta plays:
https://t.co/H3XYoyfufC
31. Continuation of the post above:
https://t.co/9SOKmXpV2f
32. Qualifying ranges + VP:
https://t.co/UiBAtEtG03
33. Scalp on NYO to understand liquidity dynamics:
https://t.co/p64f25cV1K
34. Scalp on NYO & explanation:
https://t.co/NN5nij99Ye
35. 9-steps psychological framework to not sabotage yourself:
https://t.co/al5I7prhLw
36. VSA analysis HTF example:
https://t.co/RPIXwszGcy
37. VSA pt. 2:
https://t.co/5Bv0ERtGk8
38. Qualifying supply & demand based on MA:
https://t.co/ssdBnWaXPZ
39. Orders absorption at levels:
https://t.co/l7FHMQNVxQ
40. The importance of trading less assets + TAO example:
https://t.co/uNGBSK11fc
41. Mini price action + volume live mastercalss:
https://t.co/ZLTA9UPAqI
42. Isolating price action with FRVP:
https://t.co/n7gG5YevV2
43. Price discovery methodology:
https://t.co/InsBQs705v
44. Failed Auction:
https://t.co/mXBBiCGzJ1
45. How to survive to an economic downturn:
https://t.co/5jBLYXnjyX
Liquidity First. 👁️
Orderflow Confirmed. ✅
DOM ( Depth of market ) Decides. ⚖️
~~ The Architect’s Edge ~~
Check out my recent educational notion that i have done for @ArchiSuite for FREE! 🎁 this one is on upcoming potential $ICP Short.
Link: https://t.co/QjEY8SCOj5
Most traders navigate the market using only price charts patterns, trend lines, support and resistance. But charts alone show the result of trading, not the cause.
Price does not move because of drawings on a screen. It moves because real orders market orders, limit orders, stop orders are being placed, absorbed, triggered, or removed in real time.
When you integrate Order Flow (who is hitting the market aggressively), #DOM (where liquidity is sitting or being pulled), and technical structure (where traders are emotionally committed), you begin to see the market with precision rather than guesswork. You stop reacting to price like everyone else and start anticipating the *intent* behind the move.
This synergy reveals the hidden dynamics most traders never notice:
- Where stop-loss pools are clustered
- When breakout traders are being trapped
- How large players absorb or defend key levels
- Whether aggressive buying or selling is real or simply bait
The result is a trading approach rooted in control, timing, and purpose not hope.
Instead of asking “what is price doing?”
you start understanding “why price is doing it, and what comes next.”
This is where traders shift from randomness to clarity.
From reacting to *moves* to anticipating *liquidity events.*
And this is where your edge is born.
- On losing money -
It hurts, way more than anyone says it does.
Not because of the numbers, because of what those numbers represent.
Every loss feels like a hit to your effort, your belief, your trust in yourself and in the meantime, you start to question everything: your plan, your skill, your purpose.
The money gone? Important, but it’s the confidence that went with it that truly hurts.
People say “it’s part of the game,” and yeah, maybe it is, but when it’s your account, your heart, your late nights staring at charts trying to get it right it doesn’t feel like a game.
It feels personal, heavy, you feel incredibly small.
There’s this silence after a bad trade that no one talks about, isn't it?
That moment when the position closes, and your screen just sits there, glowing back at you.
You don’t even want to move.
You just sit there, trying to understand how something that looked so clear five minutes ago could turn into this.
And then it starts.. the voices.
"Why didn’t I close earlier? Why didn’t I listen to my gut?"
It’s like your mind turns against you.
Losing money doesn’t just test your strategy, it tests your soul revealing everything about you that you try to hide: the fear, the greed, the need to be right.
You start realizing trading isn’t really about predicting price (with some time you'll be able to) but It’s about managing emotion and that’s the hardest thing, because emotion doesn’t care about logic.
You can know exactly what you should do, and still do the opposite when your heart’s pounding and the chart is moving against you.
There’s this moment, the one right after a loss, where you want to fix it.
You want to jump back in, make it back, erase the mistake but that’s the moment that decides who you become.
If you chase, you bleed🩸 more.
If you pause, you water💧the seed that leads to growth.
It sounds simple, but when you’re deep in it, it feels like war inside your head.
With time however, you start to see it differently.
You realize losing it’s a powerful feedback.
The market doesn’t care about your emotions, but it constantly teaches you through them.
Every loss is a message: slow down, stay patient, protect your peace.
You begin to trade differently not from a place of wanting to win, but from a place of wanting to last and that’s the most important part.
Can you keep showing up after pain?
Can you trust yourself again after doubt?
Can you stay calm when everything inside you wants to fight?
If you’re losing right now… breathe.
It’s okay to feel broken.
It’s okay to cry, to be angry, to question if it’s all worth it, that’s part of the process and I've been there too.
But don’t give up on yourself.
The pain you feel right now is shaping you into the trader and the person you’re supposed to become.
And here are my quick notes on this topic. As always, I am here to learn, if anything that I write is wrong, I celebrate being made aware of it!
Market Structure
• MS is the base for MT’s entire system.
• HTF trends dominate lower ones.
• PA always follows liquidity.
• Balance → Imbalance → New Balance.
• Breakout, rejection, retest, fake-out are your four outcomes.
Reflex
Always anchor to HTF structure, map liquidity, and expect PA to rebalance.
-------
Internal vs. External Structure
• External Structure = HTF trend context.
• Internal Structure = LTF moves inside HTF framework.
• Internal shifts can be early signals for external change.
Reflex
Let HTF set bias, use LTF for early signals — structure flows top down.
-------
Market Phases
• Four phases: Accumulation → Buy Program → Distribution → Sell Program.
• Market makers rotate phases to load or unload positions.
• Phases align with emotional cycles: disbelief to euphoria to panic.
• News and sentiment are manipulated to fit each phase.
Reflex
Identify phase, align with market maker motive.
-------
Market Structure Shifts
• BOS: Confirms new structure when price closes past significant SH or SL.
• CHoCH: First hint of reversal — breaks structure opposite trend.
• BOMS: Major shift — clear intent, often HTF, leaves FVGs.
Reflex
Spot BOS, CHoCH, BOMS to gauge trend shifts — act with structure.
-------
MT’s 1,2,3 System (Squiggles)
• Three parts: BOS → retrace → entry at liquidity.
• Wait for confirmed close above or below key level to validate.
• Bots leave “fuel” — enter with the bots.
• Squiggles show why breakouts fail — retail gets trapped, MT waits for fuel grab.
Reflex
Use squiggles: confirm BOS, wait for retrace, enter at liquidity.
-------
Using Liquidity as a Guide & Confirming BOS
• Bots leave fuel (untapped levels) that price revisits — these footprints guide probability.
• If a breakout leaves a key level behind, expect price to return before continuation.
• If no clear leftover liquidity, true breakout or breakdown is more likely.
• HTF structures need strong HTF closes — 12h+ is typical for MT.
Reflex
Liquidity is the roadmap — unfilled levels = magnets. Confirm BOS with relevant bodies before committing.
-------
Timeframes
• HTF (12h+): Holds most liquidity, strongest signals.
• MTF (2h–12h): First reliable BOS or CHoCH confirmations, used for refining.
• LTF (5m–2h): Micro structure, early hints, tight entries.
• mTF (<5m): Micro detail, watch mTF reactions until you can read them.
Reflex
Use HTF to guide, M/LTF to refine, mTF to execute.
- MARKET STRUCTURE -
- Basics
@Moneytaur_ does not reference market structure often, not because its not important, but because these basics should be learned elsewhere. For this writeup, here’s a brief refresher before moving to some MT-specific concepts.
-------
- Trends
Trends are always relative to the timeframe.
Higher timeframe trends dominate lower ones.
Bullish Trend
Consists of a series of higher highs and higher lows.
Bearish Trend
Consists of a series of lower highs and lower lows.
����A sideways trend is made up of smaller trends confined to a range.
-------
- Structure
Market structure is the foundation on which all key concepts in MT’s trading style are built. Liquidity, imbalances, and supply and demand are all rooted in structure.
Price action is the process that builds this foundation. PA follows liquidity, and this constant search for liquidity shapes structures.
Imbalances between buyers and sellers create directional moves (FVGs), while balance creates fair value zones (Ranges).
Balance → Imbalance → Balance → Imbalance
“If there’s no significant imbalances, there will be OBs and Supply/Demand fresh levels. If there’s no OBs and Supply/Demand fresh levels, there will be significant imbalances.
If there’s none at all it will ⚡️ into a ‘fresh’ level and build a new trading range.
Few…” https://t.co/UOSYiuqJrm
The higher the timeframe, the more robust the structure and the more reliable the signal. HTF > LTF.
Structure defines supply and demand, premium & discount, and creates liquidity zones. It also defines ranges. When price action moves beyond these range boundaries, there are four main possible outcomes:
• Break out/down: price breaks through the range and keeps moving.
• Rejection: price fails to break the range.
• Break out/down plus retest: price closes relevant candle bodies past the range and continues after retracing back into key liquidity.
• Fake-out: price breaks out/down, and then reverses.
Outcomes 3 and 4 differ clearly.
Fake-outs are usually sharp and aggressive, often leaving large wicks from stop hunts or liquidity grabs.
Retests tend to be slower and more deliberate, usually following higher timeframe candle closes past the prior range boundaries.
“Look for HTF body close above previous most significant swing highs. If not, it’s likely a false breakout. If it does, the highest probability play is waiting for a pullback into key level before continuation into the next HTF liquidity level, and if there’s none to take it will likely go to new ATH.”
https://t.co/0DG6h2dw79
- Internal vs. External Structure
External Structure
• The overall trend visible on a higher timeframe (relative to a lower timeframe).
• A weekly chart is made up of seven daily candles; compared to the daily, the weekly is external structure.
Internal Structure
• The smaller movements within the higher timeframe, seen on lower timeframes.
• Shows smaller trends inside the larger move.
Internal structure can shift short-term without changing the external trend. Always let the external (HTF) structure guide your HTF bias; internal structure offers early clues.
Example: (📈 in comments)
This 2W chart is external structure and clearly in an uptrend.
On this daily chart of the grey box, we are in a downtrend. This is internal structure.
The examples highlight the importance of always seeing structures in relation to each other.
M > W > D > H > M > S
Internal structure shifts can be the early clue that external structure may change. Let the higher timeframes define the macro structure and watch for early signs on lower timeframes.
-------
- Market Phases
The Four Market Phases
Accumulation
• Typically follows a downtrend but can appear anywhere market makers prepare for markup.
• The range lets market makers accumulate while pushing news to fit the narrative.
Buy Program (Bull Market/Markup)
• Follows accumulation or re-accumulation.
• The asset appreciates in value.
Distribution
• Typically follows an uptrend but can appear anywhere market makers prepare for markdown.
• The range lets market makers offload while pushing news to fit the narrative.
Sell Program (Bear Market/Markdown)
• Follows distribution or re-distribution, depending on context.
• The asset depreciates in value.
(📈 in comments)
- The Psychology of the Phases
Accumulation
Emotion: Skepticism, disbelief, apathy
Psychology: Most traders are fearful or disinterested. Market makers are quietly buying.
Behaviour: Retail avoids the market; volume is low; sentiment is bearish or indifferent.
Media manipulation: The most bearish news marks the bottom. “Markets are dead.”
Bull Market (Markup/Buy Program)
Emotion: Optimism, excitement, euphoria
Psychology: Confidence builds as prices rise. Retail starts buying in; FOMO.
Behaviour: Volume increases; media turns positive; public participation grows.
Media manipulation: Coverage increases and sentiment turns bullish in line with price.
🔺Intensifies with trend
Distribution
Emotion: Greed, overconfidence, denial
Psychology: Retail believes the trend will continue; smart money is offloading.
Behaviour: Volatility increases; price chops; bullish sentiment remains high.
Media manipulation: News remains bullish; influencers push FOMO narratives.
Bear Market (Markdown/Sell Program)
Emotion: Anxiety, fear, panic, capitulation, despair
Psychology: Retail sells in panic. Smart money prepares to accumulate again.
Behaviour: Heavy selling; negative news cycle; retail sells at loss.
Media manipulation: After the initial selloff, fear-driven headlines dominate.
🔺Intensifies with trend
🔺Understand that the system runs on predictable human behaviour. Stay hyper-aware of your own emotions and learn to flip them into signals instead of traps.
“When you feel you will make a lot of money by holding, it is close to the top. When you feel you will lose all your money by holding, it is close to the bottom.
Your own fear and greed emotions are two of the most powerful indicators you will ever find.” https://t.co/oHAxhgJtCy
-------
- Market Structure Shifts
Changes in structure are vital for gauging the probabilities of the next move. Understanding these shifts and the patterns that reveal them is essential for becoming consistently profitable.
BOS – Break of Structure
A BOS occurs when price closes relevant candle bodies past a significant high or low. It confirms a change in structure.
CHoCH – Change of Character
A CHoCH happens when price breaks structure in the opposite direction of the current trend. It’s the first signal of a possible trend reversal.
BOMS – Break of Market Structure
A BOMS is a clear break of market structure, usually on higher timeframes and significant levels. It confirms a shift in intent when validated and often shows higher volume and leaves FVGs behind.
- Trend Changes
Using trends, BOS, CHoCH, and BOMS helps identify key structural shifts in the market. Knowing when the market transitions from a buy to a sell program is crucial for being profitable.
“Buy program: Bullish BBs work wonders.
Buy program: Bearish BBs can often fail, unless optimal.
Sell program: Bearish BBs work wonders.
Sell program: Bullish BBs can often fail, unless optimal.” https://t.co/CWKVFBwZSe
Putting all learned concepts together helps us spot potential tops forming. Using the ideas above gives us further confirmation.
(📈 in comments)
-------
- MT’s 1,2,3 System (Squiggles)
For MT, structural shifts are an essential part of his setups. The system has three parts:
• A valid break of a key level (BOS)
• A retrace into liquidity
• Entry at the refined level to ride the reversal
This approach ensures we get the optimal entry after fuel is taken, letting us ride the trade longer with clearer invalidation and better RR.
“There’s no MTF or HTF candles closing above key PSH, so you don’t long here. For the highest probability long it’s the squiggle on the chart, with MTF (at least) close above key PSH plus pullback (the entry) before bullish continuation.” https://t.co/DwsTmv5NUI
“All “squiggles” mean the strategy is to wait for close above or below HTF key levels as stage 1 of 3, pullback or retracement into key levels if you can find them, and most of the time you can because bots always leave such levels with fuel behind, to come back later and reverse price again as stage 2 of 3 and this is your entry, and then continuation into the direction of the first move, stage 3. This is how these liquidity games work.”
https://t.co/20IM2XZU8d
Breakout trading is popular, but charts like the one below, and the effectiveness of squiggles, show its weakness clearly.
“You can always choose to long the breakout, but this isn’t going for high probability as it’s what all retail traders do, and the game’s designed to stop or liquidate them all, collecting fuel, and then proceed in the direction retail traders expected, which will then make them start revenge trading as they were ‘right but wrong’.”
-------
- Using Liquidity as a Guide
Market makers leave footprints that help us assign probabilities to the next move. Liquidity is key. When key levels are left behind and price action approaches a level without taking the liquidity first, chances are high, it will revisit to grab that fuel before continuing.
“A helpful hint to determine if a breakout will reverse into a key level before trend continuation is to check if there’s a key level left behind in the previous range that price is attempting to break out from. If the key level is present, especially on HTF and you can refine it into lower timeframes, the probability of a pullback into that level before continuation becomes significant, as price tends to gravitate toward such levels. Additionally, if there’s a key level above the swing high that can be taken, it could act as fuel for a drop into the lower level, setting up for a subsequent pump.” https://t.co/dLb32EUytJ
Alternatively, when no such levels exist, the probability is higher that the breakout/down is real and price action will continue in the direction.
“If you cannot find such, the probability for breakout into price discovery, without looking back for a while, is higher.” https://t.co/uxu7gczPIQ
-------
- Confirming a BOS
In general, higher timeframe structures need higher timeframe confirmations. Use timeframes relevant to the trade. For higher timeframe levels MT often looks for closures 12h or higher. Further HTF closures add confluence and reinforce the likelihood the break is real.
Always watch for body closes above or below the swing high or swing low.
(📈 in comments)
Without a confirmed BOS, we risk falling for fake moves. A confirmed BOS marks clearer intent. Wait for the signal, place orders where the fuel sits, and ride the continuation.
🔺Lately, more HTF closes have resulted in reversals. Market makers are aware that retail is looking at daily closes.
“Don’t fall for false moves. Learn to identify confirmed BOS on HTF and you will level up instantly.”
(📈 in comments)
There’s no single timeframe that automatically invalidates every setup. The last five minutes of a HTF candle can close below a level without any real prior price action in that area. Zoom in on lower timeframes and check what’s happening. Look for signs of strength or weakness to support your decision. Stay flexible and weigh all factors.
Things to consider:
• How optimal is the level?
• Where is the level located?
• Is the asset high volume?
• What are majors doing?
• How does price behave around the level?
• Are newly formed LTF structures being respected?
• Is there spoofing?
• What is order flow showing?
MT has posts calling for 12H+ closes to confirm or reject a level; others rely on 2H. This is closer to an art than a rule, an edge that only comes through screen time and real experience.
“Take notes on this PA, because it will change your game. You can go through timeframes up until 2H and you will notice there’s no candle bodies closing below the level where the 2D BB is at. The hint is there. From here I’ll wait for key SH or SL to be taken and find an entry on pullback or retracement. 0 candle bodies closed below 2D BB. Body, not whisker. At least a 2H full body, specifically for SOL as it’s a high TV coin.” https://t.co/NWU3jY4LnM
-------
- Timeframes
Moneytaur has his own definitions of timeframes. You can either adopt his schematics or come up with definitions that are a better fit for you.
“micro TF: 5min and lower
LTF: 15min > 2H
MTF: 2H > 12H
HTF: 12H > M+” https://t.co/ddmUmlaFK9
HTF (12h+)
• Hold the most liquidity and are the most reliable.
• The higher the TF, the clearer the signal of the predominant trend.
• 1W+ are macro timeframes.
• HTF plays = up to 3% of trading account, max 5% if optimal.
MTF (2h–12h)
• First reliable validations of BOS, CHoCH, BOMS.
• Key for refining levels.
• MTF plays = up to 2% of trading account.
LTF (5m–2h)
• Super-refined entries, exits, and stops.
• First possible signs of BOS, CHoCH, BOMS.
• Less reliable as they hold less liquidity.
• LTF plays = up to 1% of trading account.
mTF (<5m)
• Ultra-refined entries, exits, and stops.
• Entries or exits based on micro structure reactions to key levels.
“In micro timeframes, you can better see when a price reversal is likely, since the ⚡️ at key levels is a powerful sign of that. If you spend time in those timeframes when the price is reaching key levels where you expect a reaction, you’ll start to notice a pattern and better understand whether a reversal can actually occur or if the reaction is too weak. As for the ‘ping-pong’ at key levels, it’s the same, but weaker than in lower timeframes and harder to read, since you don’t see proper candle bodies, so you just have to get used to it.”
📝Note on Timeframes and TradingView
• TradingView anchors all intraday timeframes to the daily close.
• Timeframes that do not evenly divide into 24h will produce one partial candle at the end of each daily session.
• This shorter candle is always the last candle before the session reset at 00:00 UTC.
• So a 23h candle is 1 x 23h + 1 x 1h candle. When trading a 23h level, the chance is high that you are in reality taking a trade based off a 1h hOB.
- 🎁Educational content: mini-price action + volumes masterclass -
This is a post that can truly improve your abilities and help a lot in understanding the price action, so pay close attention.
When you find a solid demand or breaker area where to enter there are many sets of rules you can integrate like waiting for the price to close within the level (above/below depending on the setup), looking for a liquidity sweep of a swing or looking at multi-timeframe confluence.
However, another way is to look into LTF in order to see what is actually happening in real-time.
I'm gonna share with you an extract from a live session that I made privately using PYTH, as I believe it's highly valuable.
Read carefully each step.
--------------------------------------------------------
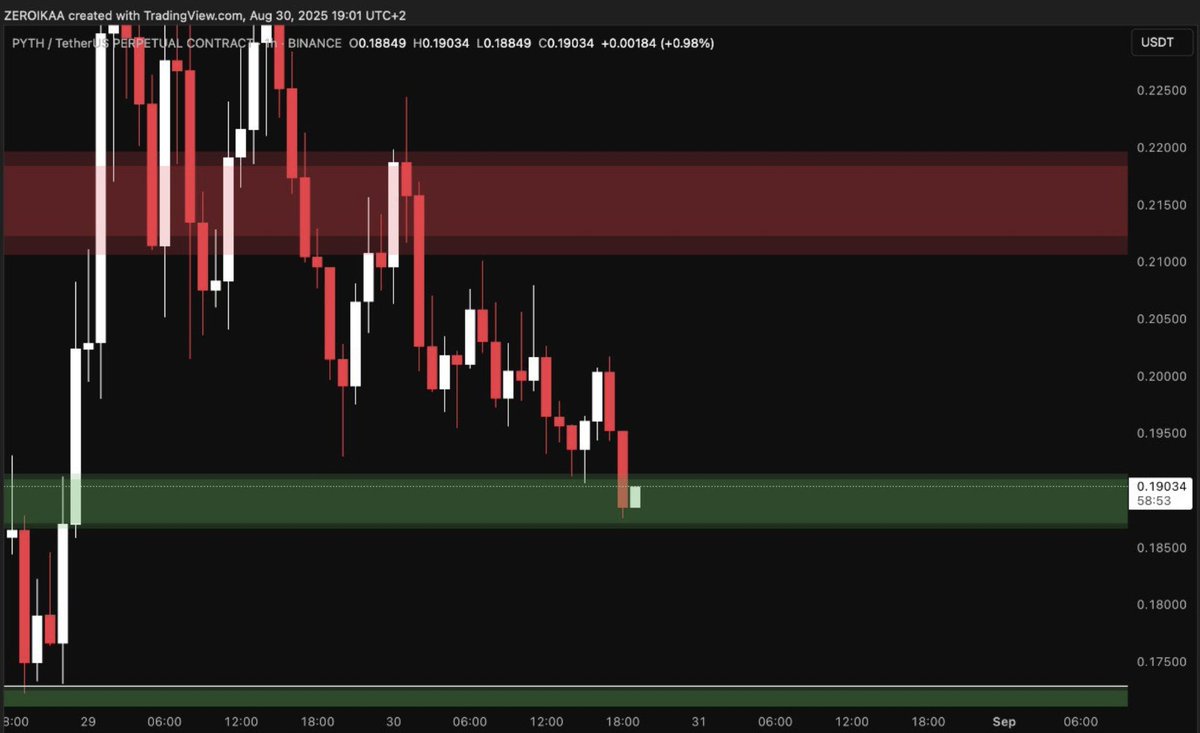
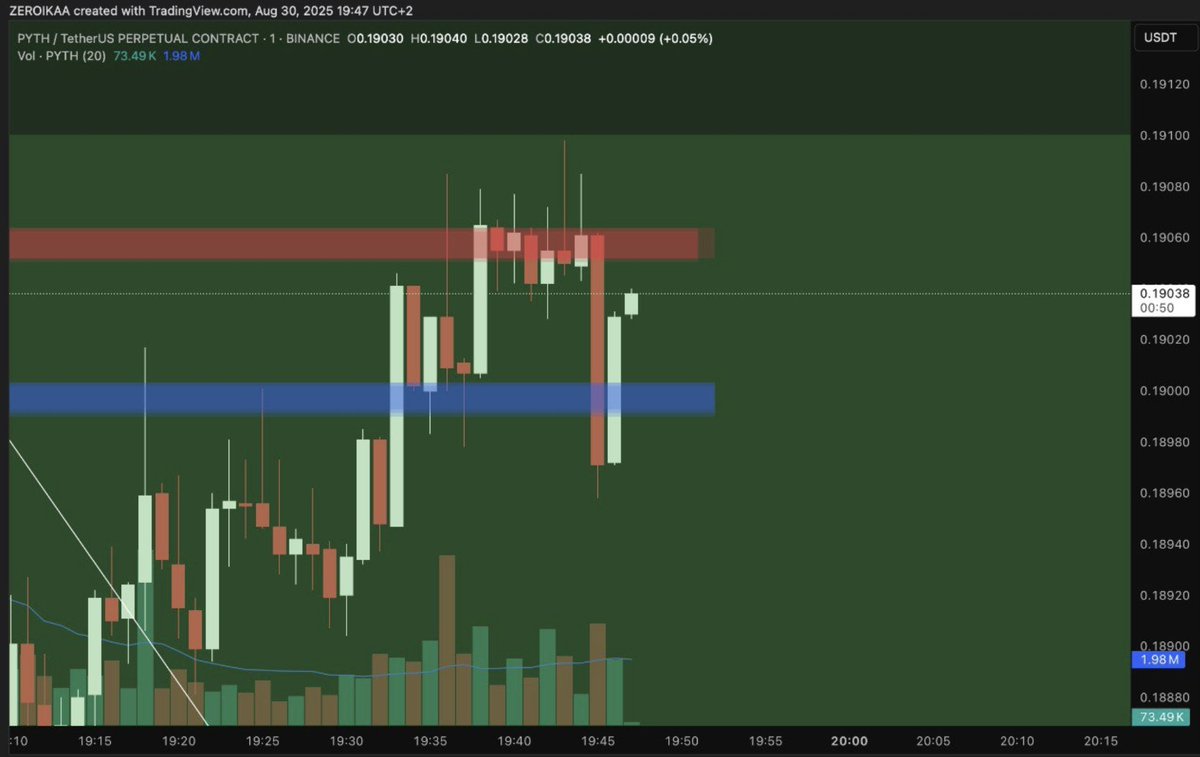
1⃣Gentle reminder to give a look at PYTH
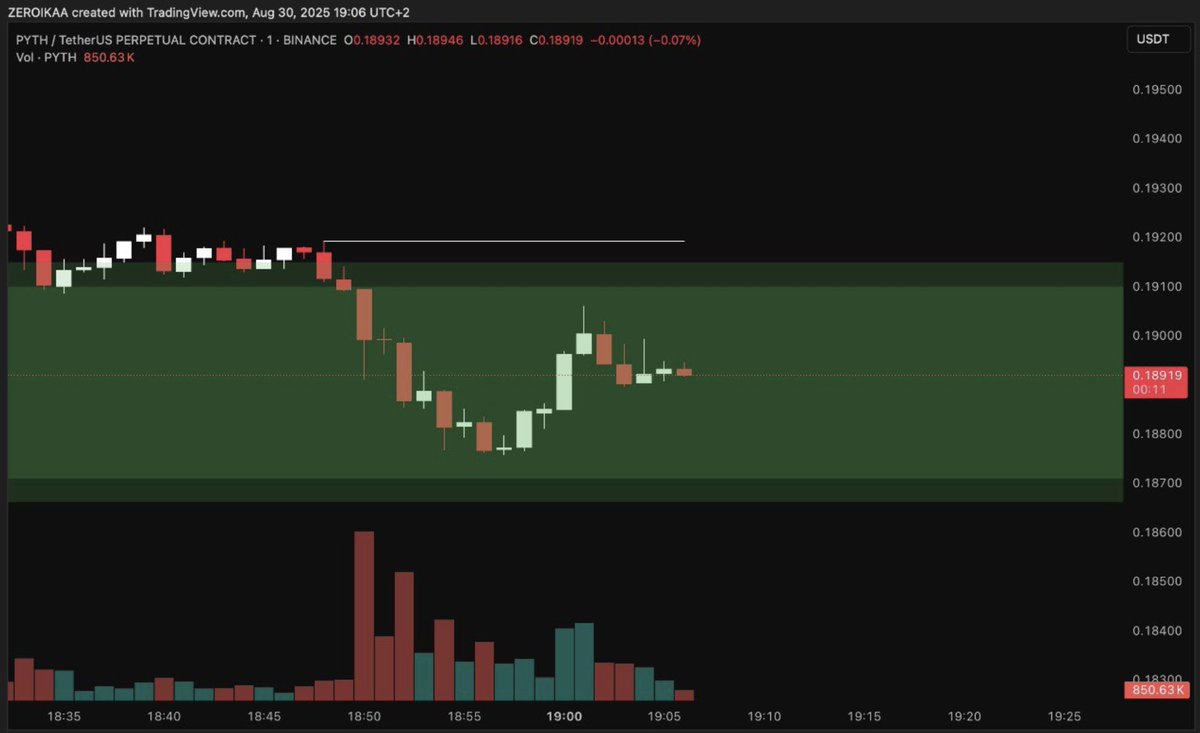
2⃣ Decent response at the level (1m) with 1H closing within + volumes absorbing.
Need a push above local swing, but at the moment looks decent.
Early to determine since you need a decent BO + volumes but when the price closes decently (1H) within the area + big volume spike on drop could be selling climax.
Missing? Confirmation.
EQ of the BB in insolation post closures (1H within, 4H better) or on LTF CHoCH + retest if provided.
It's an HTF level so you need a decent closure within it in order to assess that it's holding, so yes. Want to enter post 1H? Ok, but it carries higher risk.
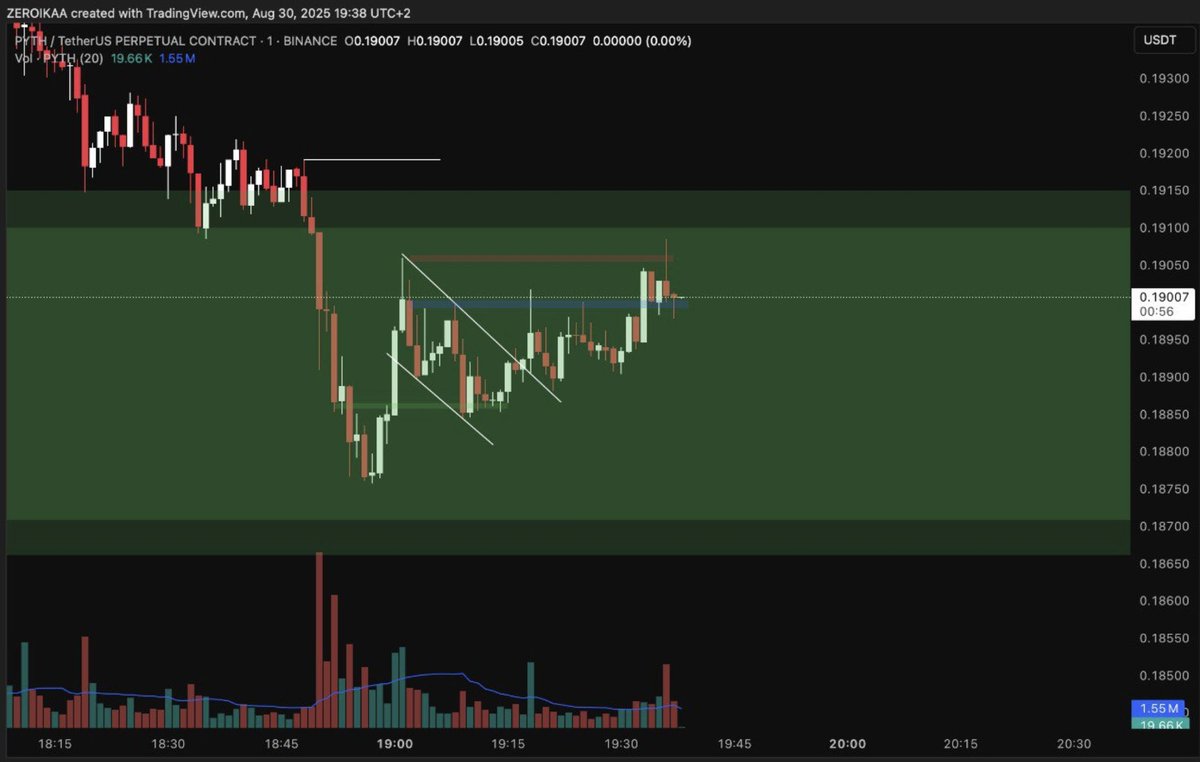
3⃣ Local absorption playing out, but observe volumes on the last try above SH: bears tried to defend the dominance, so if bulls want to step in, price should consolidate between blue and red area before the attempt.
Resistance flipped into support.
Notice the attempt toward blue, 3 times before breaking.
4⃣ See? Bulls attacked well the red area but bears defended it rejecting.
However, after the push and attempt below support (blue) bulls stepped in. Battle ongoing.
More attempts weaken the zone, remember that.
Hop across 10 chains and swap between 50,000 tokens straight from your non-custodial xPortal wallet.
Fast, easy, secure. Just how crypto should be.
Download now: https://t.co/KDy99BKLDg
Understanding BGUSD: A Yield-Generating Token by Bitget
BGUSD is a yield-generating token introduced by Bitget, designed to offer users stable and consistent returns across different market conditions. Unlike traditional cryptocurrencies that operate on public blockchains, BGUSD is an exchange-based token. It is not minted on any blockchain, and thus, deposits and withdrawals outside the Bitget platform are not supported.
The value of BGUSD is backed by tokenized U.S. Treasury funds, which serve as a foundation for its yield-generating capabilities. Bitget strategically allocates its own funds into yield-bearing products offered by partner institutions. The interest generated from these investments is converted into BGUSD and distributed to holders as daily profits. This mechanism allows users to benefit from a low-risk, yield-generating asset while retaining the stability typically associated with fiat-pegged tokens.
BGUSD offers several functional advantages within the Bitget ecosystem. It can be used as trading margin for USDT-margined futures, and it also serves as acceptable collateral for borrowing other tokens. Furthermore, holders receive daily profits based on an annual percentage yield (APY), with additional perks such as access to Launchpool and PoolX – features that enhance user participation in the Bitget ecosystem.
A key point of differentiation between APY and APR (annual percentage rate) lies in the compounding of interest. APR represents simple interest without considering reinvestment, while APY accounts for compound interest, providing a more accurate measure of total returns if profits are left unredeemed and continue to accrue.
To ensure fairness and transparency, Bitget calculates users’ daily profits using the minimum BGUSD balance recorded throughout the day. The system automatically takes hourly snapshots of user balances, and the lowest balance observed during the 24-hour cycle determines the daily profit calculation. For instance, if a user maintains a stable balance of 1,000 BGUSD across all snapshots, that entire amount is used for the day’s interest calculation. However, if the balance drops to zero at any point, no profit will be distributed for that day.
Profits are credited directly in BGUSD to users’ spot accounts. Importantly, BGUSD itself does not increase in value over time; rather, it maintains a stable valuation, and earnings come from the daily yield. Users who acquire BGUSD through the spot market or receive it via internal transfer are equally eligible for yield distributions, as long as their hourly balance snapshots meet the minimum requirements.
Subscriptions to BGUSD can be made using either USDT or USDC. The exchange rate for USDC is fixed at 1:1, while conversions involving USDT depend on the real-time spot market price of the USDT/USDC trading pair. A 0.1% fee applies to both subscriptions and redemptions. Bitget reserves the right to adjust these fees, with any changes reflected during transaction confirmation.
BGUSD’s centralized structure introduces certain limitations. One such restriction is the inability to withdraw or deposit the token externally, as it only exists within the Bitget ecosystem. Moreover, users may face purchase limitations if they reach their maximum allowable BGUSD balance. Redemptions are also subject to liquidity constraints, with daily limits determined by real-time availability from Bitget’s partner institutions. Express redemptions are typically processed instantly when liquidity allows, while standard redemptions are credited on a T+1 basis during business days, and T+3 during weekends.
The redemption process currently supports USDC only. Redemption quotas reset daily at 12:00 AM (UTC+8), and users are encouraged to act soon after the reset for higher chances of successful redemption. Partial redemptions are supported, though they are still governed by the same liquidity constraints.
Several risks are associated with holding BGUSD. Fee structures may change over time, and yields may fluctuate based on the performance of underlying investment assets and broader macroeconomic conditions. Since liquidity is tied to traditional financial systems, real-time access may be limited outside of standard banking hours. In addition, global regulatory developments, especially those targeting digital assets and tokenized securities, could affect the availability, usage, or legality of BGUSD in certain jurisdictions.
In conclusion, BGUSD offers a convenient and stable yield-generation solution within the Bitget ecosystem. It provides users with multiple utilities, including trading, borrowing, and ecosystem participation, all while delivering passive income through daily interest. However, its centralized nature, operational limits, and reliance on partner liquidity underscore the importance of understanding the underlying structure before investing. For users seeking passive returns in a regulated and controlled environment, BGUSD presents a compelling option with predictable, transparent mechanics and institutional-grade backing.
#Bitget #BitgetBuilders
Who's the #BitgetBuilders rep attending #TOKEN2049? It's @DCle76.
His remarkable contributions have not only earned him this prestigious recognition but also the title of "Best Builders 2024". 🏆
Curious about how DC rose to the top? Check out: https://t.co/nkpa2WSHIZ
🚀 The Ultimate Decentralised Experience Starts Now — With Bitget Onchain
Here’s 10 reasons why Bitget Onchain is your new edge in Web3 👇
🧵
1 🔍 Token Discovery, Reimagined
No more hunting through block explorers. Bitget Onchain brings you trending tokens, real-time data, & smart filters — all in one place.
2 ⚡ Alpha, Delivered Fast
New tokens pump fast. Bitget Onchain scans the chain every 60 seconds, surfacing what's hot before the crowd sees it.
3 🧠 AI-Powered Precision
Find hidden gems, dodge rugs. Our AI filters cut the noise, showing you only the highest-potential plays.
4 🛠️ No Wallets. No DApps. No Stress.
Trade instantly from the Bitget App with USDT/USDC — no bridges, no browser tabs, no setup headaches.
5 📱 On-Chain Trading, App-Simple
Tap, trade, moon. Buy/sell tokens with CEX-level convenience. Built-in gas estimates. Full trade tracking. All mobile.
6 🔐 CEX-Grade Security, On-Chain Freedom
Decentralised power meets proven protection. Bitget Onchain wraps every trade in battle-tested security.
7 🔥 Hot Picks & Whale Watch
Real-time rankings show tokens with spiking volume, rising wallet counts, and early hype. Alpha at your fingertips.
8 🌐 Multi-Chain Ready
Now supporting Solana, Base, & BNB Chain — with more to come.
9 🧰 Built for Degens & Newcomers Alike
Whether you’re chasing 100x or dipping a toe, Bitget Onchain gives you speed, clarity, and an edge.
10 🌟 Trade Ahead, Not Behind
Don’t wait for listings. Discover and act before narratives go mainstream. That’s Bitget Onchain alpha.
#BitgetOnchain #Bitget
@MatiBNB @MikeSavvaCy@ChMarinos@cpanayiotou_@christos_1926@thanos_jamal@_toumbas@cryptobusiness1@effiekav@Isobitis76@katerinaramm1@MarinoSt196524 @Paidemundo @ToneDeafStudio
This is a very interesting question that I will try to elaborate.
In a multi-week altcoin uptrend, the smartest trades aren’t made by buying strength or fading weakness, they’re made by following the trail of inefficiencies left behind as price tears through levels, rebalancing selectively while hunting liquidity.
The market’s movement is rarely clean, and that chaos leaves clues.
If you know how to read imbalances, understand displacement, and track what wasn’t traded, you can build a system that positions you inside continuation, not after it.
When price expands violently, it rarely leaves a clean footprint.
We're talking about FVGs, mainly.
These are areas where price moved too fast to efficiently transact, meaning there was more aggressive buying than willing sellers.
These inefficiencies act like magnets on the way back down: in an uptrend, they become your primary zones to look for long entries.
Logically, you have to start with context: price has broken structure to the upside, likely through a prior SH that held significance (multiple touches, clean horizontal level, or liquidity pocket).
That displacement confirms aggressive demand.
What matters now is where price pauses, and where it left inefficiencies behind.
Use multi TFs to spot the candle bodies that left voids between them as price ran up.
These gaps are rarely random..they’re where you want to bid.
As price retraces, maybe on a small pullback, or after running a local high, you’re watching for it to come into the upper part of the FVG.
Not necessarily to fill it entirely, but to show that buyers are still active inside it.
You want to see a slowdown in bearish momentum: wicks rejecting lower prices, bullish engulfing on MTFs or closures within the level, ideally within the top 50% of that imbalance.
That’s your trigger.
The invalidation is below the imbalance.
Is like saying: “if this gap doesn’t hold, the move wasn’t strong enough.”
Now here’s the "juiciest" part: your take-profits aren’t blind highs or fibs, they’re set at the next imbalance above.
Because just like inefficiencies below get filled on pullbacks, the market is constantly seeking to rebalance inefficiencies on the way up.
The next major target is often the midpoint or origin of the next unfilled FVG above and once that gets filled, you look for reaction.
If price blasts through, you keep a runner. If it stalls, you scale out and wait for the next entry.
Add another layer: if price returns to an old imbalance zone that also lines up with a prior range high or a BB from the last leg down, that’s double confluence.
You’re now dealing with a zone where price has memory, and the inefficiency is your edge within that structure.
You’re not chasing green candles.
You’re trading what the market left behind, clean inefficiencies that act as footprints of intent.
The market tells you what it wants, not in words, but in voids.
If you let it come back to fill what it missed, and you’re patient enough to wait for that reaction, you enter at precision and exit at imbalance completion. (partial or full)
Clean, mechanical, and rooted in how price actually behaves, not how people want it to.
This is how you stay composed in a trend.
You don’t need to predict tops or chase breakouts.
You just track the imbalance, let price come back, and trade from value to value.
Liquidity leaves clues, imbalances define the path.
The rest is just execution.
"And if I'm not good at trading?"
If you get nice entries at discount in the next couple of weeks, you "just" need to identify the levels where the prices will be attracted, marking them down as HTF TP and respecting them.
That's a fool-proof strategy for those who want to hear.
💎 Don't miss two new Bitget Earn Products started today.
👉 Choose your Favourite or Join both
#Bitget $BGB
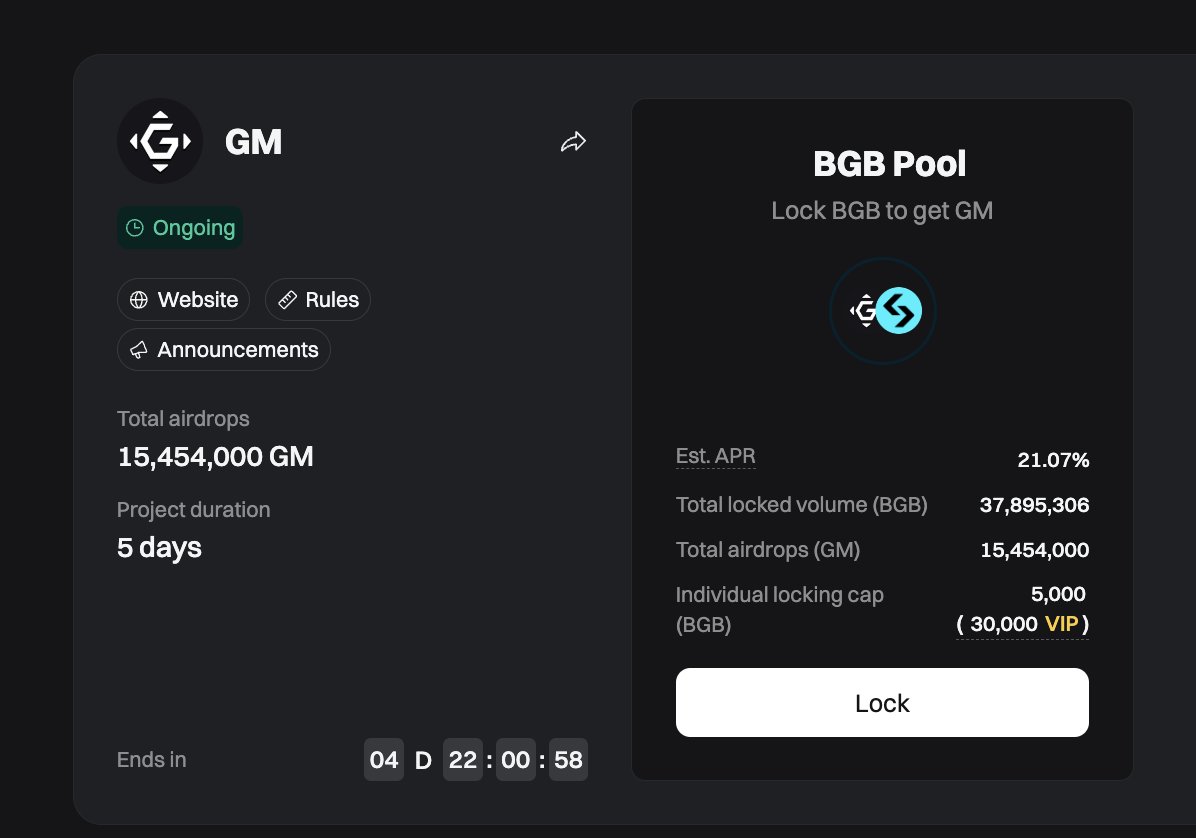
✅ Launchpool: GM token
Lock BGB to grab a share of 15,454,000 GM!
✅ PoolX: AB token
Lock AB or BGB to grab a share of 135,173,000 AB!
💎 Babylon (BABY): Unlocking Bitcoin's Potential in the Proof-of-Stake Ecosystem 💎
👉 What is Babylon (BABY)?
- Babylon (BABY) is a decentralized protocol designed to enable native Bitcoin staking directly on the Bitcoin blockchain without intermediaries. It does this through a unique architecture that uses Bitcoin scripts, custom-built modules, and a connection to a secondary blockchain called Babylon Genesis.
- It introduces a novel shared-security architecture that extends Bitcoin's robust security model to the broader decentralized ecosystem. By allowing BTC holders to participate in staking operations while maintaining their assets on the Bitcoin network, Babylon provides verifiable security guarantees to other networks that are parts of the Bitcoin Secured Networks (BSNs).
With Babylon, users don’t have to give up control of their Bitcoin. They keep it in their own wallets, and the protocol ensures their BTC is being used in a secure and trustless manner.
👉For more info:
https://t.co/CfPLfZcDQY
#Bitget #BitgetSpot
🔥The Bitget Onchain product is now live, offering a simple and secure way to trade on-chain assets. Here are the key points: 🔥
✅ Easy On-chain Trading: Users can trade directly from a spot account without the need for complex web3 wallet knowledge.
✅ High Security: The system protects assets at the exchange level, eliminating the need to manage private keys or authorization processes.
✅ Wider Asset Selection: Bitget Onchain offers a broader range of on-chain assets compared to traditional exchanges, with continuous updates to provide access to early-stage projects and new opportunities.
✅ AI Smart Filtering: AI algorithms automatically filter suitable assets, enhancing decision-making by saving time and reducing risks.
Discover, purchase, and manage your Onchain assets in the Bitget App with just a few simple steps:
👉 - Open the Bitget App, go to "Market," and select the "On-chain Zone" to view rankings.
👉 - Click on a token to view details, including market cap and liquidity, and enter the trading panel.
👉 - Enter the purchase amount or select a quick proportion on the trading page, confirm transaction details and fees, and you're all set to buy!
Useful Links:
🔗 More details: https://t.co/t5tyEkQ8Om 🔗 Official Twitter: https://t.co/p1MQteUim7
#Bitget #BitgetOnchain
If you actually took the time to sit down and list:
🔹 Every aggressive reversal on Bitcoin and ETH.
🔹 The “news” that magically appeared to explain each one after the fact.
🔹 What major charts were signaling before it happened.
🔹 What the biggest whales were saying publicly around that time.
🔹 What i was saying before the ⚡️ moves hit.
🔹 And the overly bullish news that always seems to drop right at the top [LTC, TEL, and others come to mind]
You’d start noticing something most never do: This game is rigged.
Sure, a lot of people say it’s rigged. They repeat the phrase like it makes them sound sharp or "woke" or ahead of the curve.
But ask them how it’s rigged?
Ask them to break it down?
They go silent, or they start guessing. They can’t point to the timing of narratives, the structure of price action, the coordinated influence of whales, or the mechanics of how fear and greed are weaponized, because they don’t actually understand the game. They just know they’re losing and need a reason.
The markets you’re participating in, whether you realize it or not, are one of the most beautifully engineered scams ever created.
News doesn’t move the market.
The market moves the news.
Narratives are built.
Reversals are planned, and retail emotions are manipulated on schedule.
Whales accumulate when everyone’s scared.
Whales distribute when everyone’s euphoric.
The headlines are timed.
The influencers are bait.
And the majority are just exit liquidity.
The illusion is precise. Elegant, even.
It's designed so that by the time you think you understand what’s going on, you’re already on the wrong side of the trade.
If you ever feel like it was "obvious in hindsight" that’s the point. It was obvious. Just not to you.
However, it was visible. The charts told the story. The setups were there. The same game played out, over and over again. You just didn’t know how to read the script, yet.
Once you do see it, you can’t unsee it. And that’s when everything starts to shift, because you’re no longer walking blind. You’re no longer falling into carefully set traps. You stop reacting like the herd and start thinking like the architect.
From that point on, your life starts changing not by luck, but by clarity.