BUY BITCOIN AT $48,300
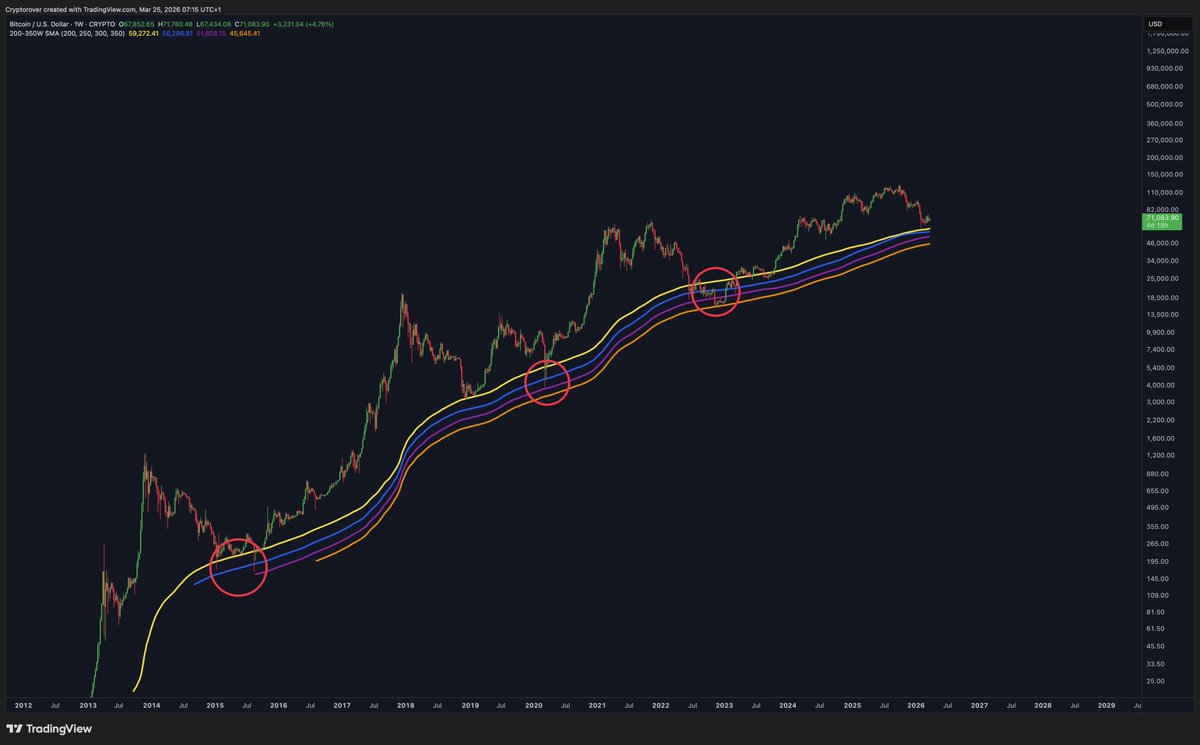
This level is defined by the Bitcoin Investor Price, one of the most accurate models for tracking the market's true cost basis.
The Investor Price tracks the average acquisition price of all economically circulating Bitcoin. By dividing the Investor Cap by the Adjusted Supply, this metric refines traditional realized price models by completely removing permanently lost or burned coins. The result is a clean, realistic look at the market’s true bottom line.
For more than a decade, the Investor Price has served as the definitive cyclical boundary for Bitcoin. Indeed, every major bear market bottom over the past 15 years has capitulated right around this baseline.
When Bitcoin tests this specific metric, it marks the exact point where seller exhaustion peaks and long-term accumulation delivers the highest-conviction returns.
If the current market correction deepens and pushes $BTC toward the $48,300 territory, it should be treated as the primary signal that the macro bottom is locked in and the risk-to-reward ratio for a long-term position is heavily optimized.
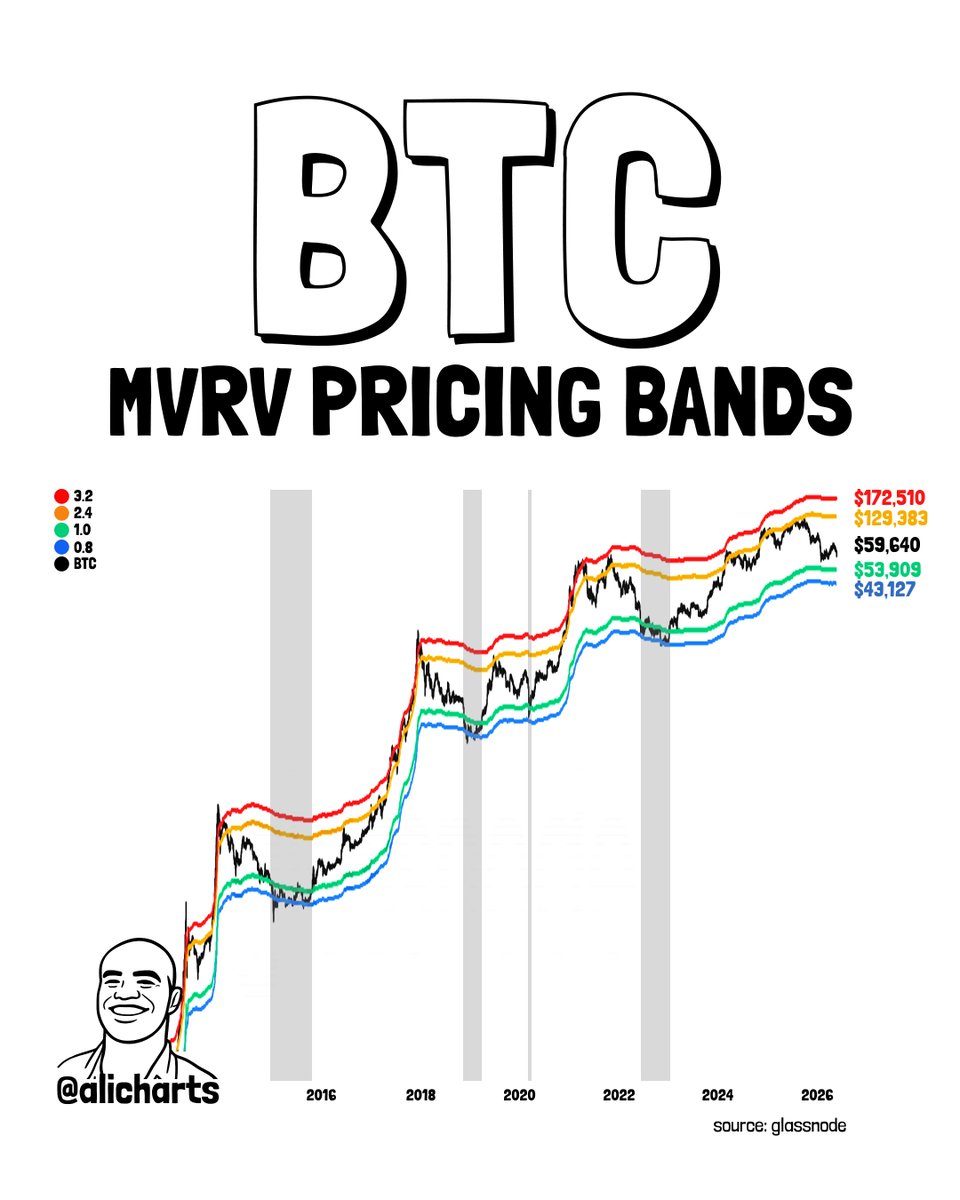
I believe the best risk-reward opportunities typically emerge when Bitcoin $BTC drops into the 1.0 and 0.8 MVRV Pricing Bands.
Those levels currently sit at $53,900 and $43,130, respectively.
Plausible path:
Bitcoin forms a low in June (like it did in June 2018 and June 2022).
BTC rallies in July
SPX correction later in year which allows Bitcoin to finally bottom (most likely October)
Four year cycle wins again
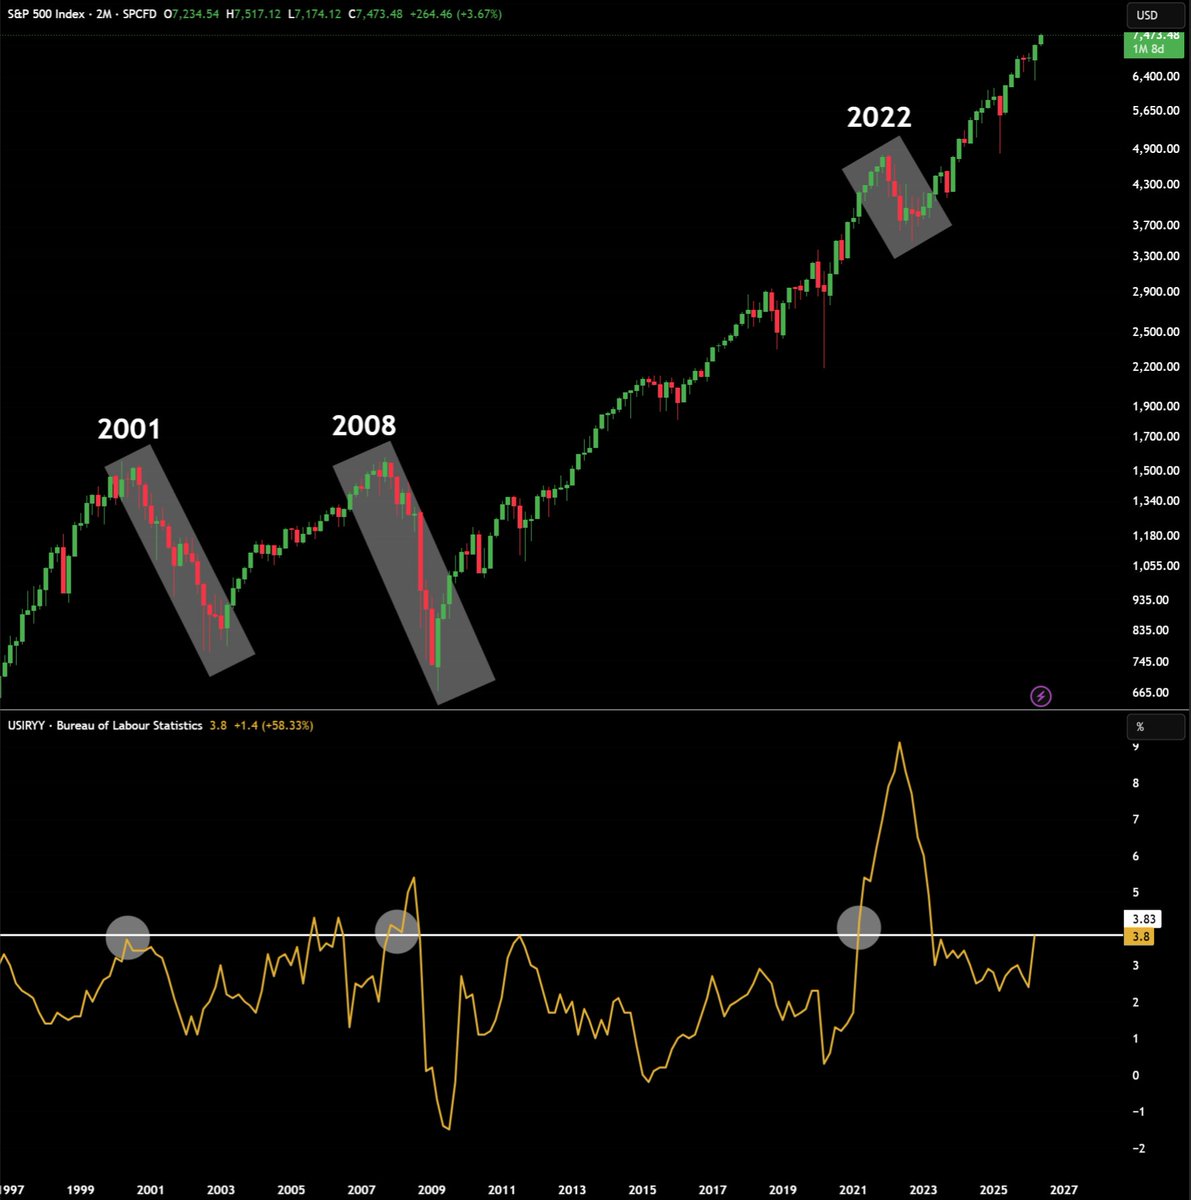
This number has predicted every major stock market crash since 1970.
And America's top economists just warned it is about to cross the danger zone again.
US inflation is at 3.8% right now. Three months ago America's top economists forecast it would be at 2.7% by now. They just revised that forecast to 6% for this quarter.
That is the single largest upward revision in the history of the Survey of Professional Forecasters.
Every single time inflation has crossed 4% in the last 55 years, the stock market crashed:
- 1970: CPI hit 6%, S&P crashed 36%
- 1974: CPI hit 12.3%, S&P crashed 48%
- 1987: CPI hit 4.5%, S&P crashed 33%
- 2001: CPI hit 3.5%, S&P crashed 36%
- 2008: CPI hit 5.5%, S&P crashed 52%
- 2022: CPI hit 9.1%, S&P crashed 25%
Every single time the same chain reaction. Inflation crosses 4%, the Fed keeps rates high, borrowing gets expensive, earnings fall, stocks crash.
Where things stand today:
- CPI: 3.8% in April, highest since May 2023
- Energy: +17.9% year over year
- Gasoline: +28.4% year over year
- Fuel oil: +54.3% year over year
- Real wages: down 0.3% annually
- Gas at the pump: $4.50 today vs $3.14 a year ago
Before the Iran war started on February 28, inflation was at 2.4%.
It jumped to 3.3% in March. Then 3.8% in April. EY is already forecasting it crosses 4% in May.
Oil is only 5% of the CPI basket. But it is 6 times more volatile than almost every other category. And it is embedded in everything, transportation, food production, plastics, electricity.
When oil stays elevated, everything else follows.
We saw this exact sequence in early 2021. Oil rose first while every other inflation component was flat.
Then one by one they all followed. That move sent CPI from 2% to 9.1% by 2022.
Food prices are already up 3.2% year over year. The USDA is forecasting food prices rise another 2.9% in 2026.
That number was set before oil crossed $100. It will be revised higher.
The 1970s had three waves of inflation.
Wave 1 peaked at 6%. Wave 2 hit 12%. Wave 3 hit 15%.
Each time the Fed eased too early thinking inflation was over. Each time it came back stronger than before.
CPI fell from 9.1% in 2022 all the way to 2.4% in January 2026. Everyone assumed inflation was dead. It is now back at 3.8% and the country's top economists are forecasting 6% this quarter.
The Fed cannot cut rates. Inflation is at the exact same level it was before every major bear market in the last 55 years.
History has a very consistent answer for what comes next.
MVRV Pricing Bands remain one of the most reliable tools for identifying cycle extremes. Historically, Bitcoin $BTC has found its definitive bottom between the 1.0 and 0.8 pricing bands—the zones where the market is trading at or below its aggregate cost basis.
Since 2010, every major capitulation has found its floor within this narrow corridor. This is where the last sellers are exhausted, and the long-term accumulation phase begins.
In the current cycle, Bitcoin has yet to test these ultimate value zones. As of late April 2026, the bands are positioned as follows:
1.0 MVRV Band: $54,145
0.8 MVRV Band: $43,316
While the local momentum is positive, these levels represent the ultimate floor if the macro trend undergoes a deeper correction.
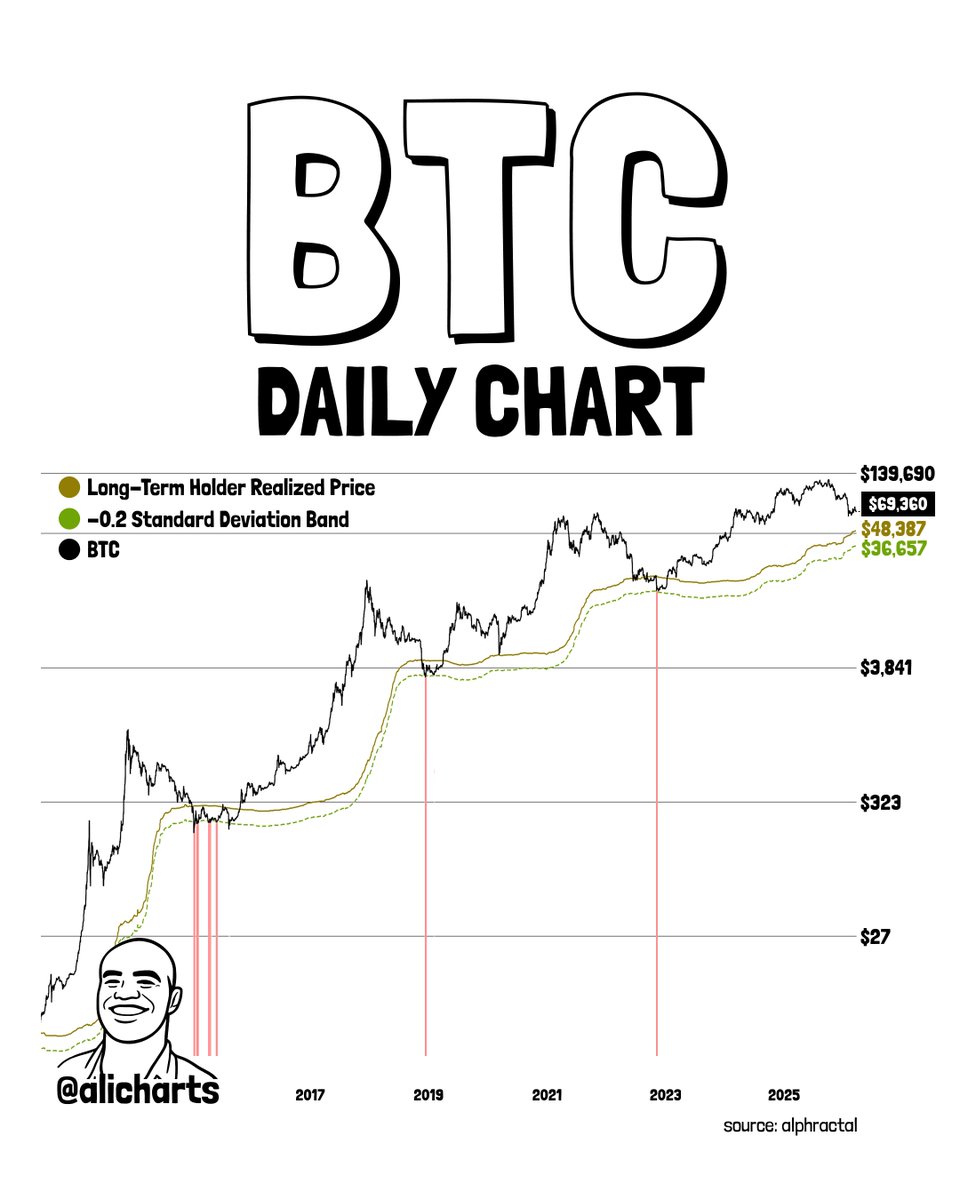
For over a decade, Bitcoin $BTC has kicked off new bull runs after dropping below:
• Long-term holder realized price: $48,387
• −0.2 standard deviation band: $36,657
I’ll be watching these zones for dip-buying opportunities ahead of the next bull cycle.
This has been the secret to every major Bitcoin $BTC bull run since 2011.
If history repeats itself, Bitcoin is approaching the "final discount" window before the next bull market. If the fractal holds, we are looking at a golden entry window between October 6 and October 16, 2026.
Buy Zone: $41,500 – $45,000.
This could be the launchpad to start a new 4-year cycle. The countdown to the next Bitcoin vertical move has begun!