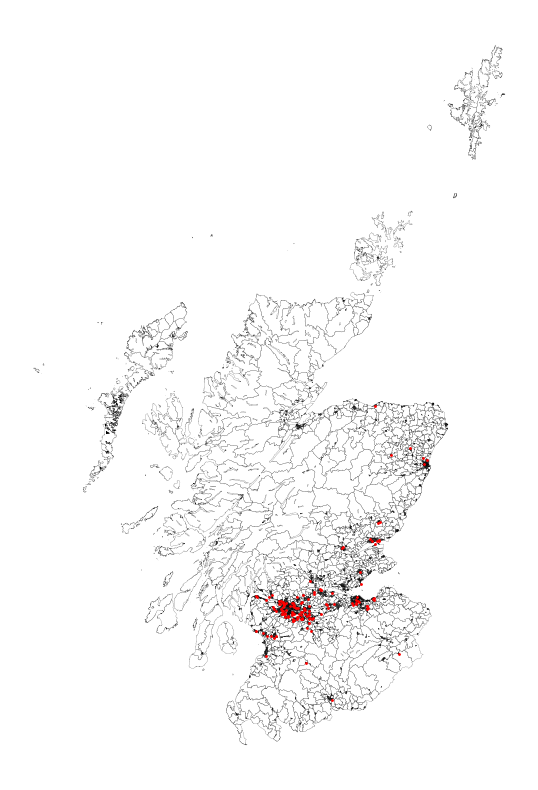
AI data centres run on the same power and water you need for your home. At @GSDSglasgow we wanted to know how significant these demands are, because of the risks to the environment, and to utility bills. But based on open data alone, there's only so much we can know.
If it's isn't obvious already, it is the end of papers as a measure of productivity, expertise or accomplishment. The odds of publishing in "glam" conferences & journals also very quickly approaches random & the time for gate keeping review increasing exponentially. 1/
Why do voters feel unrepresented even when there are multiple parties to choose from?
Our new paper studies ideological misalignment: the way ordinary voters combine attitudes differently to political elites.
https://t.co/G260A9dy3b
With thanks to @leedewit and @BESResearch
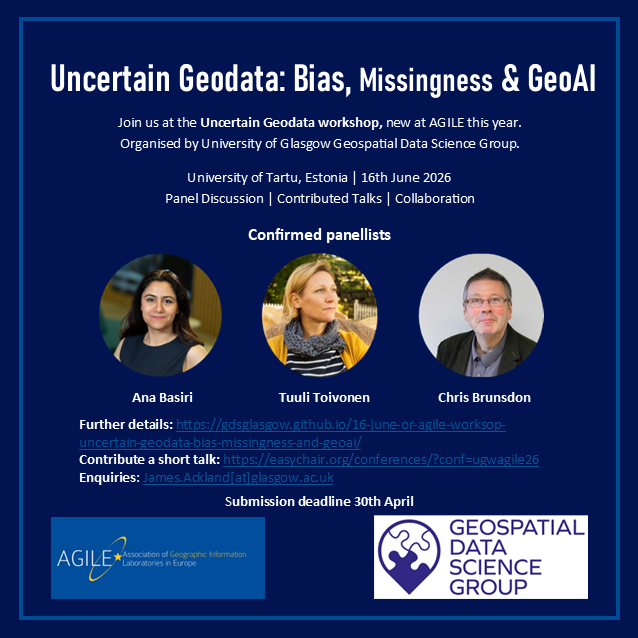
There's still time to submit an 800-1500 word abstract for a short talk at the @GSDSglasgow workshop at AGILE 2026. Submissions welcome at https://t.co/1Ah7aI829J until the extended deadline of 8th May.
Further details:
https://t.co/25Qz95zo3Z
I'm organising a workshop at AGILE! Come join our brilliant panel in Tartu for a discussion of data quality issues in GIScience and GeoAI.
Registration at https://t.co/hfNgrXNp6l
Short talk submissions at https://t.co/1Ah7aI829J
Call for abstracts: Uncertain Geodata workshop at AGILE 2026!
Bias, missing data and uncertainty are common in geospatial analysis. Join us to share experiences and discuss data quality in GIScience.
Deadline: 30 April 2026
🔗https://t.co/hLcjd1Jhdg
https://t.co/rC3DKHXtXN
Call for abstracts: Uncertain Geodata workshop at AGILE 2026!
Bias, missing data and uncertainty are common in geospatial analysis. Join us to share experiences and discuss data quality in GIScience.
Deadline: 30 April 2026
🔗https://t.co/hLcjd1Jhdg
https://t.co/rC3DKHXtXN
Reading a 400-word text can make British attitudes towards EU immigration more positive by 20 percentage points. New paper out today in @SciReports. Many thanks to my co-authors @leedewit, @James__ackland, @alanjrenwick and @David_JYoung. https://t.co/gpO02yCroa
From one conference to another, I'll be presenting at EPOP today in the session on polling at 11:30. Come by if you want to find out whether I can beat the commercial pollsters with a laptop and a map of all the pubs! @RoyalStatSoc@PolStudiesAssoc
🎉Big congrats to James Ackland for passing his viva! His research uses data-driven modelling to explore how political ideologies simplify complex issues into one-dimensional choices. We're excited to welcome his sharp, systems-level thinking to the team! 💡🧠
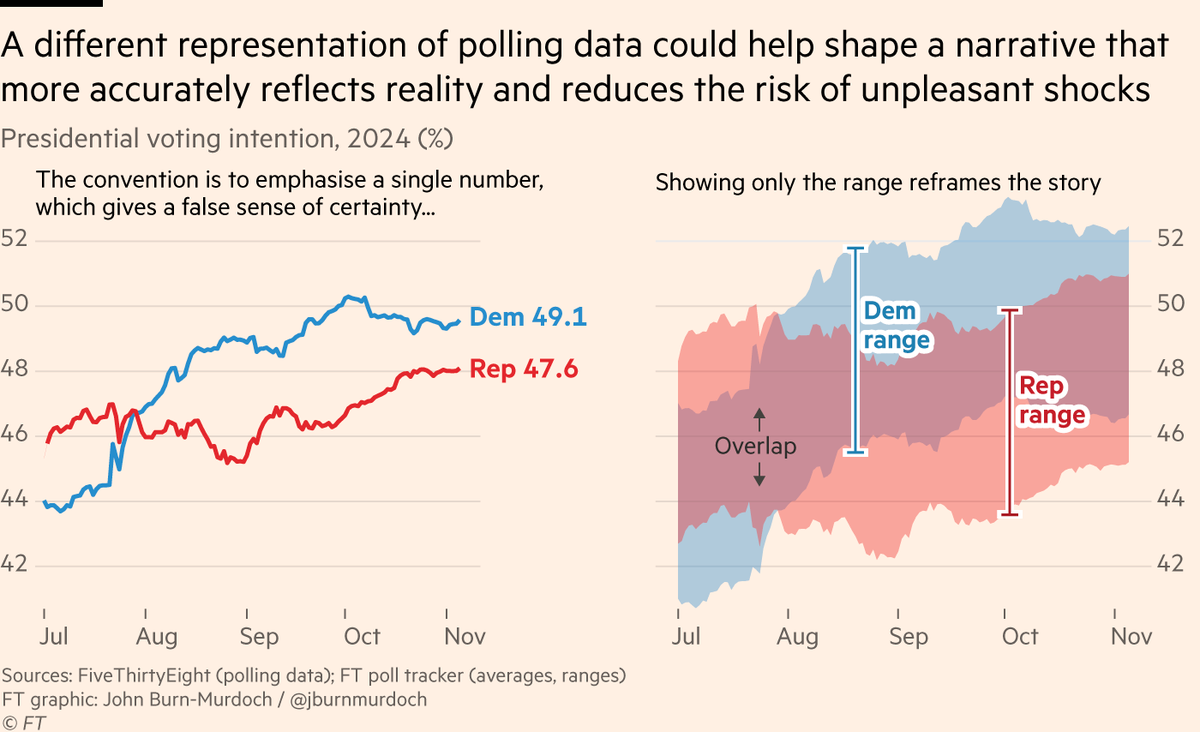
My wish for the next election is that poll trackers look like the one on the right 👉 not the left
This was yet another election where the polling showed it could easily go either way, but most of the charts just showed two nice clean lines, one leading and one trailing. Bad!
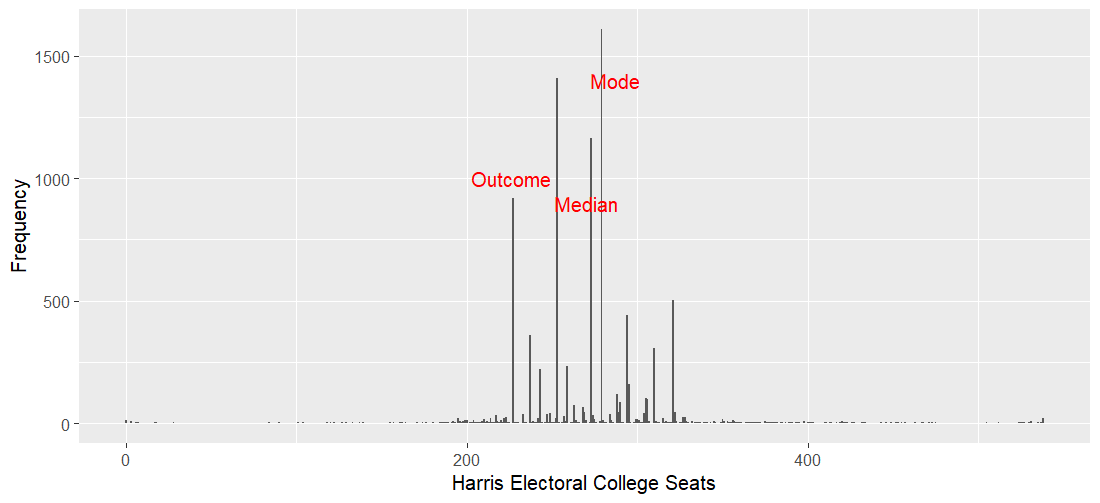
Of course, what I should have added, but didn't, was the distribution of possible outcomes. While Harris 270 was modal, the probable outcome (Harris 226) was the 4th most common outcome, at a 9% probability.
Outcome: 226, 9%
Prediction: 270, 12%
Mode: 287, 16%
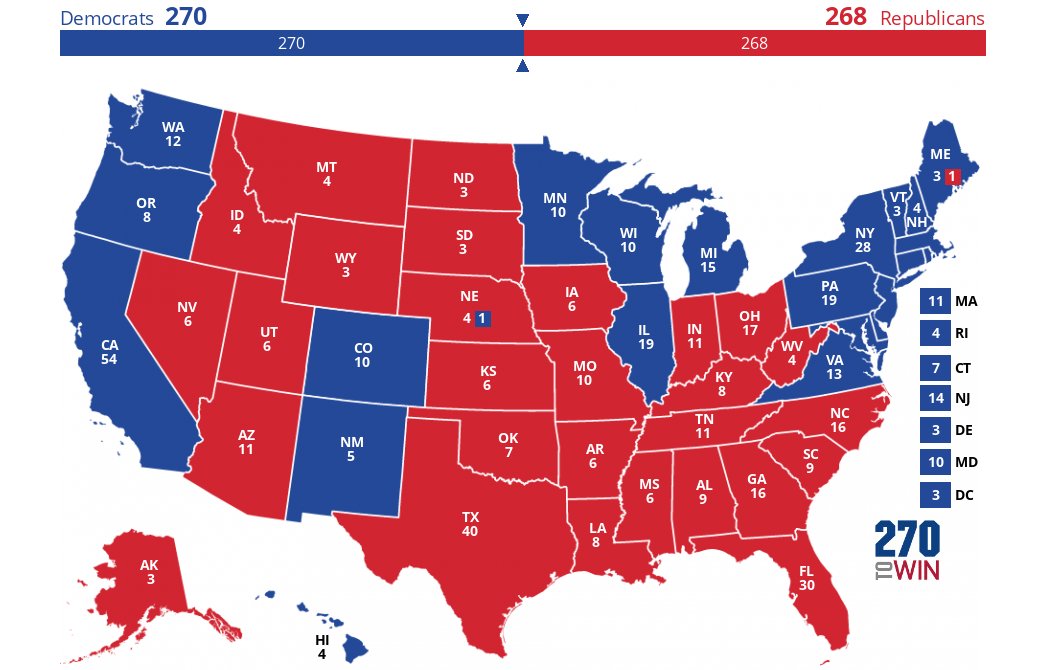
After the roaring success of my UK Election prediction, it's time to commit to Twitter my home-grown US election forecast...
Computer says...
Harris: 270 (59% chance to win)
Trump: 268 (41% chance to win)
Some states are very close
Trump wins Pennsylvania in 41% of simulations, Michigan in 22%, and Wisconsin in 20%
Harris wins Nevada in 48% in simulations, N Carolina 26%, Georgia in 21%, and Arizona in 17%