A risk officer and a marker maker open the identical terminal and read it completely differently. One watches L3 for book exposure, the other watches L2 for spread decisions. That is by design, not a limitation. #CascadeRisk#MarketStructure#RiskTech
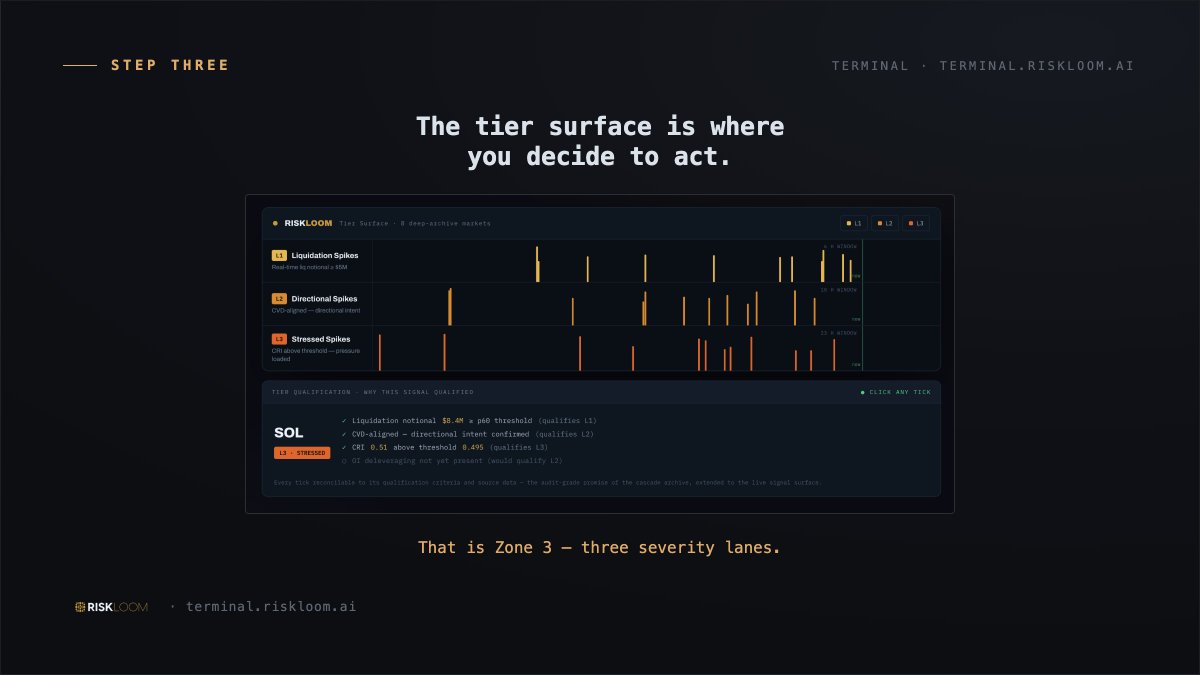
The tier surface is where you decide to act. That is Zone 3 - three severity lanes.
Zone 3 is the last stop in a normal session: onset, directional confirmation, proven cascade. Whatever qualified in Zone 2 lands in one of these three lanes.
#TradingDesk#MarketMaker
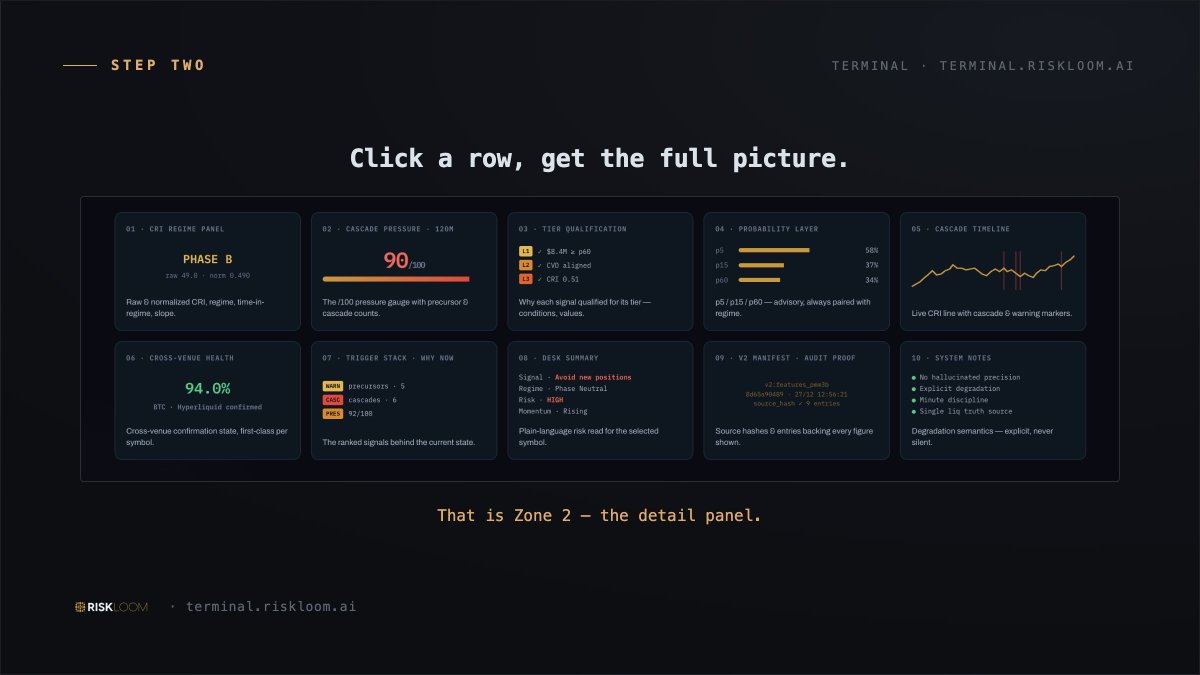
People ask what is actually in Zone 2. These five are the ones a desk reaches for daily: what regime the market is in, how much cascade pressure is building, whether a second venue confirms it, which tier is qualifies for, and the record behind that qualification. #RiskManagement
Click a row, get the full picture. That is zone 2 - the detail panel.
Selecting a symbol on the watchlist loads its details panel: twelve institutional capabilities for that one market. Nothing summarized, nothing hidden a click deeper.
#QuantFinance#CascasdeRisk#RiskTech
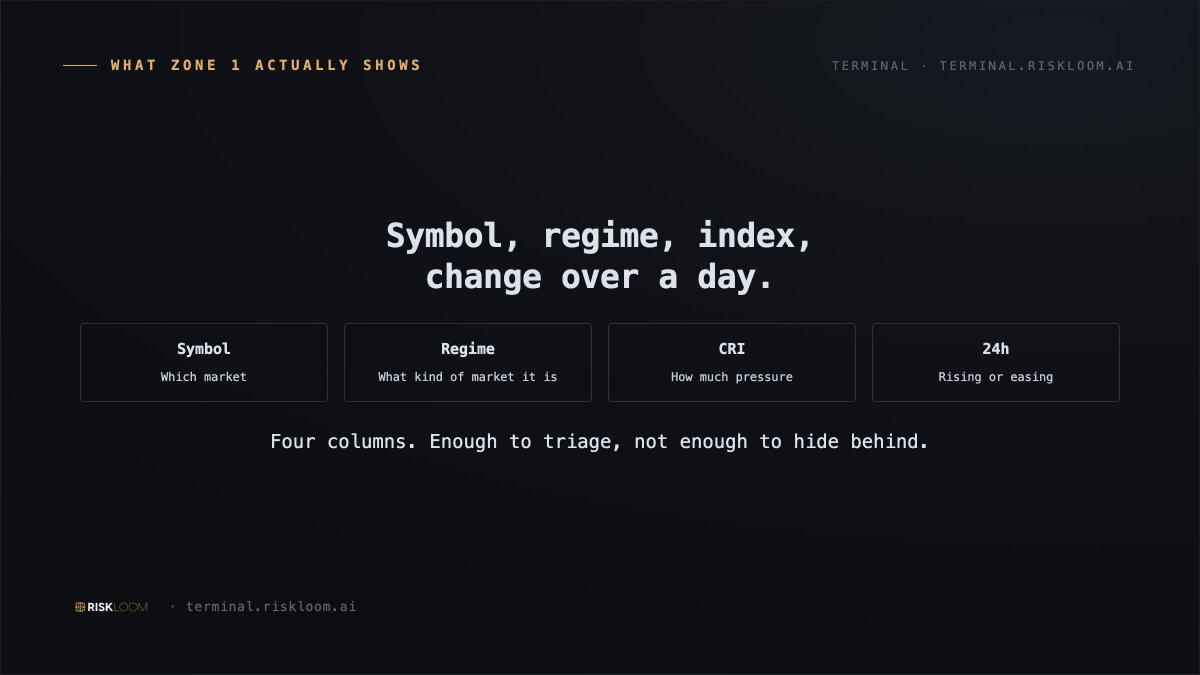
Symbol, regime, index, change over a day. Four columns. Enough to triage, not enough to hide behind.
Four columns is a deliberate choice. Enough to decide what to open next, not so much that the watchlist becomes another dashboard to interpret.
#TradingDesk#RiskManagement
@CryptoKaleo Institutional demand could become a major catalyst if $BTC reclaims $100K. The key is whether spot demand and market structure confirm the move—not just FOMO. RiskLoom helps monitor the liquidation pressure as momentum builds.
@AshCrypto $SOL’s structure is improving, but the key is whether the breakout holds and leverage stays healthy. Technical strength is one piece; liquidation pressure adds another layer of context.
@MartiniGuyYT $BTC is approaching a key ~$89.6K test. The important part now is whether price can reclaim and hold the 100W MA, or gets rejected.???
RiskLoom can help monitor the liquidation pressure around that level.
@coingecko Memecoin momentum is lifting solana:2zMMhcVQEXDtdE6vsFS7S7D5oUodfJHE8vd1gnBouauv back into the top 100. A 16.8% move is notable, but the key is whether liquidity and leverage support the momentum??? watch it live here: https://t.co/9s4wSLGFea
@DaanCrypto Weekly structure has broken, but the ~$83K area is now key. Holding it keeps the breakout intact; losing it could turn the move into a liquidity grab. RiskLoom helps monitor the pressure behind that move.
The terminal opens on zone 1, the ranked watchlist. You are not hunting for what to look at - the ranking already sorted 70 markets by pressure.
#CascadeRisk#Liquidations#RiskTech
One workspace, three steps. Scan, Open, Confirm - that is the whole workflow.
When i walk someone to the terminal for the first time, i show them three zones, in order. That order is the whole workflow.
https://t.co/IzfQeyOdG0
#RiskManagement#MarketStructure#TradingDesk
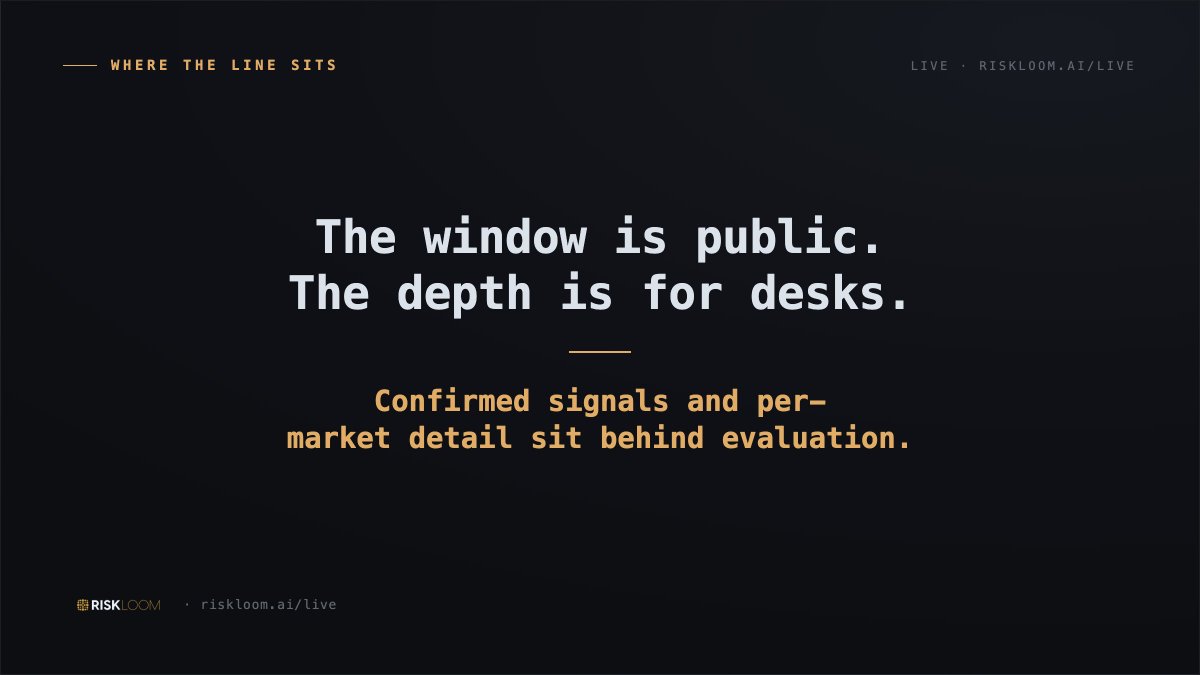
Anyone can watch the state. Confirmed signals, per-market detail, and programmatic access are for qualified risk and trading desks.
https://t.co/yJobkM6141
#TradingDesk#RiskManagement#CryptoRisk
Scroll past the live gauge and you’ll see the actual episodes the ledger captured—timestamped when they happened and never edited. Each row shows the peak reached, not an average or smoothed figure.
https://t.co/yJobkM6141
#CryptoRisk#MarketStructure#RiskTech
Click a flag ticker on the Markets grid and it opens straight into this: 353 documented cascades across those same 47 markets, reconciled back to April 2026. One page, one connected trail from live state to historical proof.
#TradingDesk#RiskManagement#MarketData
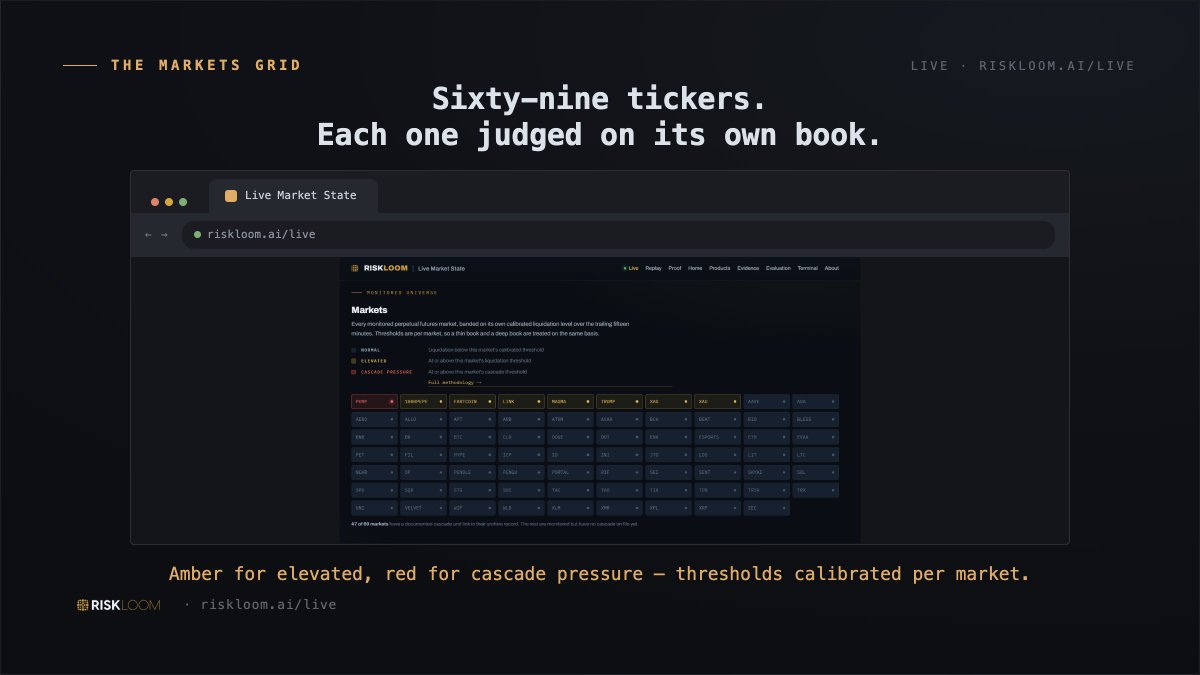
Every monitored perp is calibrated to its own liquidation level—not one universal threshold.
Thin or deep books, same basis. 47 of 69 have documented cascades linked to archive records; the rest are watched, not flagged, until one occurs.
#DataIntegrity#RiskManagement
BTC moving from elevated toward cascade pressure. Visible in the same window, without a login.
The per-market view is what turns a headline band into something you can act on: which market is actually carrying the pressure right now.
#MarketStructure#TradingDesk#CryptoRisk
Most days sit quiet or building. This is what the band looks like on the days it matters most - and it is the same public page, the same 5 minutes cadence.
#CascadeRisk#RiskManagement#Liquidations
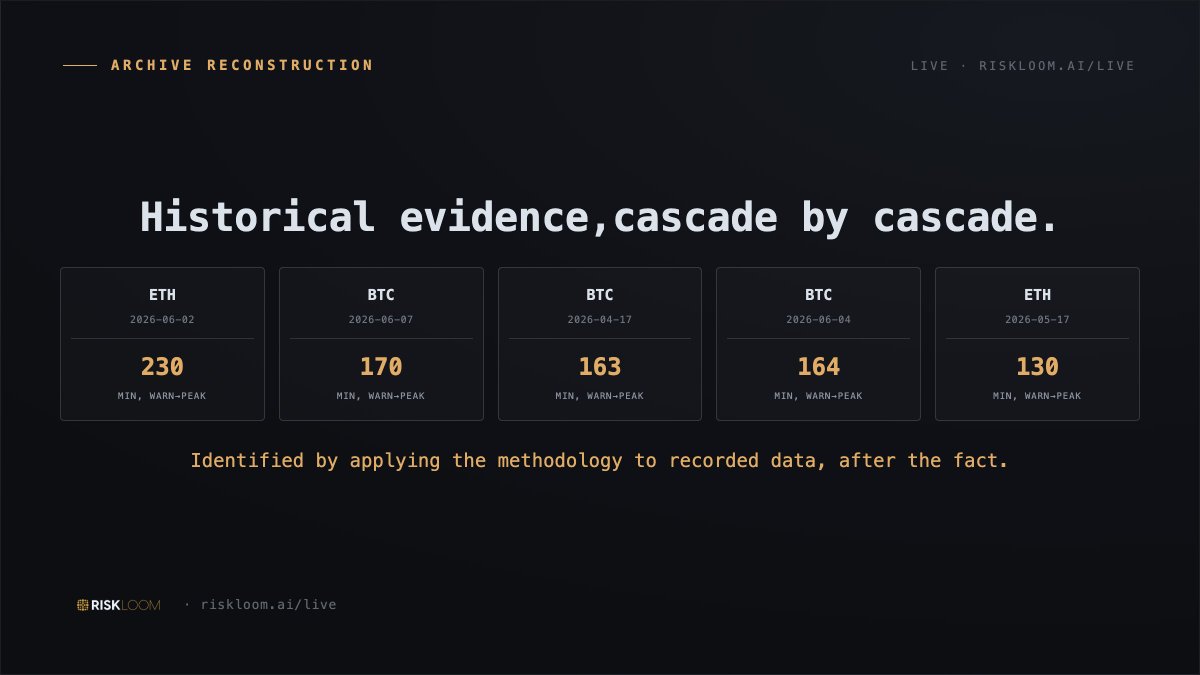
Five documented cascades from the archive, each identified after the fact. That demonstrates the methodology finds real events. It cannot demonstrate a warning existed beforehand - that is what the live page's prospective record is for.
#TradingDesk#CryptoRisk#MarkerStructure
The band is a count of markets in concurrent liquidation above their own calibrated thresholds, refreshed every 5 minutes. A state not an opinion.
#DataIntegrity#MarketData#RiskManagement