Semiconductor stocks are experiencing historic upside volatility:
The semiconductor index, $SOX, has recorded 9 single-day gains of at least +5% over the last 60 trading days, matching levels last seen in January 2009.
This reading has only been exceeded during the 2000 Dot-Com Bubble burst.
During that period, this metric peaked at 17 sessions in January 2003, while the 2nd-highest level was recorded in early 2001, at 15 days.
In other words, this level of extreme volatility has historically only occurred during major bear markets.
Meanwhile, $SOX has surged +175% over the last 12 months and is trading at all-time highs.
The scale of the semiconductor rally is unlike anything seen before.
If you invested $10,000 on Trump's inauguration day, January 20, 2025, and didn't cash out at the peak in October 2025, you would be left with:
• $BTC: $6,126 (-38.7%)
• $ETH: $5,380 (-46.2%)
• $XRP: $4,267 (-57.3%)
• $SOL: $2,560 (-74.4%)
• $DOGE: $2,131 (-78.7%)
• $AVAX: $1,800 (-82.0%)
• $ADA: $1,703 (-83.0%)
• $SUI: $1,393 (-86.1%)
• $DOT: $1,400 (-86.0%)
• $ENA: $800 (-92.0%)
• $APT: $700 (-93.0%)
• $TRUMP: $230 (-97.7%)
• $MELANIA: $50 (-99.5%)
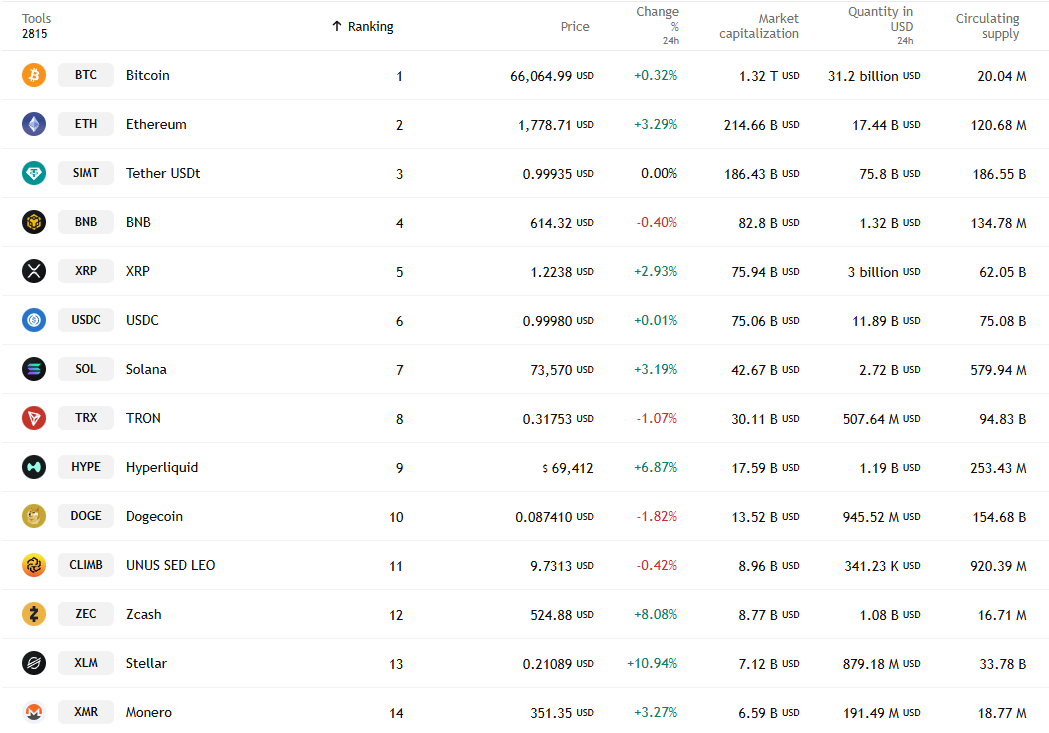
There are only a few exceptions, such as $ZEC, which was in the $40-$50 range in 2025 and has now multiplied tenfold. Or $HYPE, which was around $20 then and has now tripled to around $70.
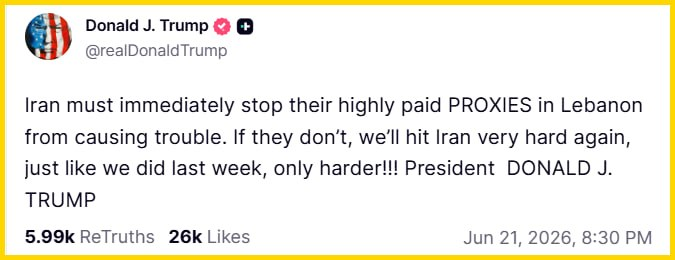
🇮🇷 Iran temporarily leaves the negotiating table after being threatened by Trump
Trump's exact words were:
"Iran must immediately tell its proxies backed by Lebanon to stop causing trouble. Otherwise, we will hit Iran hard again, like last week, even harder!!!"
Late last night, Iran announced it was temporarily leaving the negotiating venue because these words violated the clause prohibiting the use of threats or force in the Memorandum of Understanding.
Brent oil edged slightly up to $77, while BTC fell back to the $63K region.
BREAKING: The US Economic Surprise Index is up to 63.2 points, the highest since August 2023.
This index measures economic data relative to consensus estimates, turning positive when data beats estimates and negative when data misses.
This metric has risen +57.6 points since late April, posting the largest 7-week increase since Q1 2022.
The move comes amid stronger-than-expected jobs data, ISM Services PMI, factory orders, ADP employment, job openings, and ISM Manufacturing PMI.
The US Economic Surprise Index is now approaching the 79.6 peak recorded in July 2023, which would mark the highest level since the early 2021 pandemic recovery.
US economic data is crushing expectations.
China's housing crisis is still getting worse:
New home prices in 70 Chinese cities fell -0.2% MoM in May, deteriorating from a -0.1% decline in April.
YoY, prices dropped -3.5% for the 2nd consecutive month.
Existing home prices fell -0.3% MoM, marking the largest monthly decline in 3 months.
China's property downturn has now weighed on the economy for nearly 5 years.
At its peak, the property sector accounted for ~25% of China's economy and it remains a major drag on growth.
China's 2008 moment is now for the housing sector.
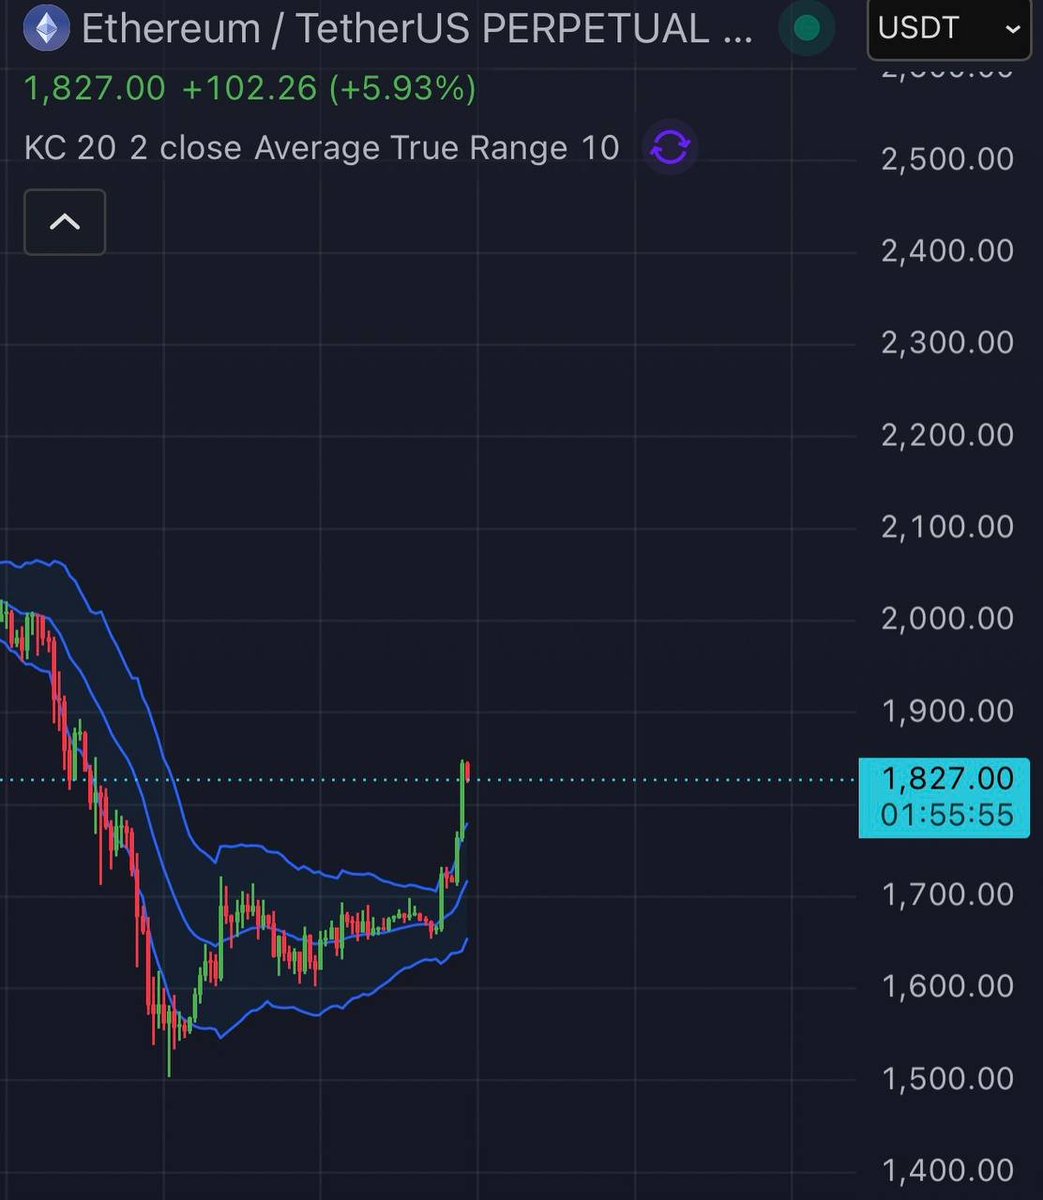
Whales are accumulating $ETH!
K3 Capital withdrew 10,000 $ETH($16.92M) from #Binance 2 hours ago.
The wallet linked to Chun Wang (@satofishi) withdrew another 7,650 $ETH($12.93M) from #Binance over the past 2 hours.
https://t.co/sOzHI6ghde
https://t.co/e05TpNPskc
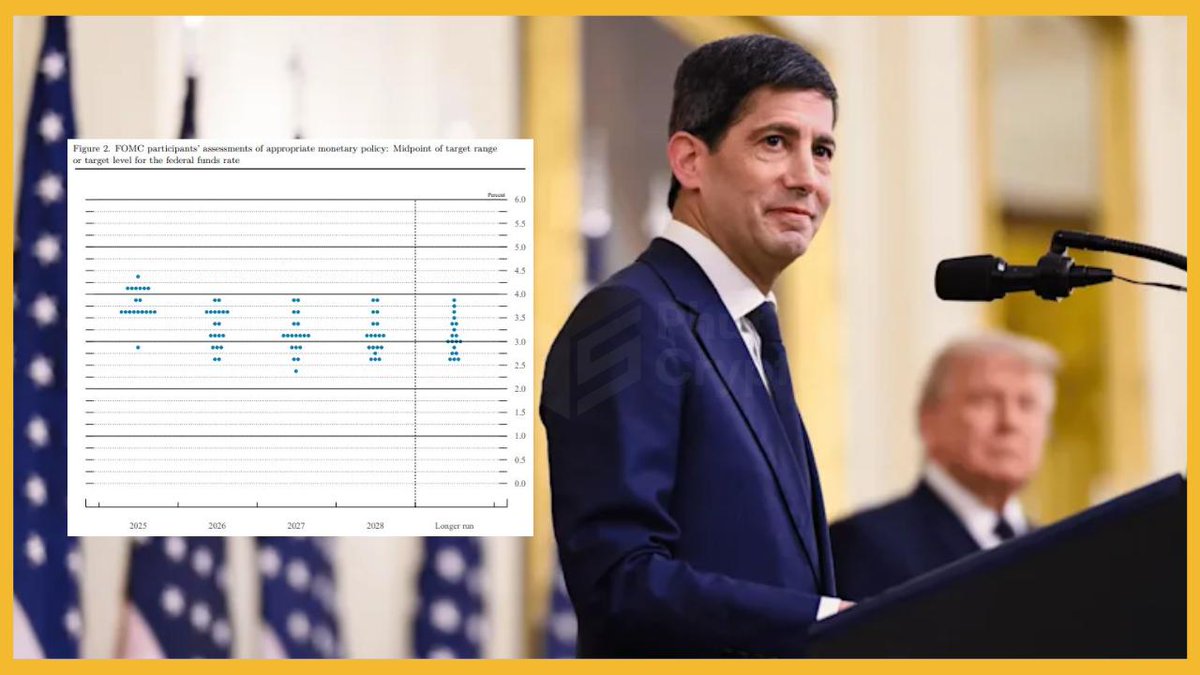
The new Fed Chairman might skip the "dot plot" after 14 years; has the unpredictable phase arrived?
Since 2012, the Fed has published a dot plot in its quarterly economic forecasts. This is a collection of interest rate forecasts from each FOMC member, considered a crucial clue to the Fed's future interest rate trajectory.
However, according to many analyses, Kevin Warsh is very likely NOT to submit his personal dot plot because:
1️⃣ Warsh dislikes this tool. He has spent 15 years opposing the Fed's excessive guidance of the market. It ties the Fed down and pressures members to defend outdated forecasts instead of reacting flexibly to new data.
2️⃣ He doesn't want to reveal his views too early. Previously, Stephen Miran, when he was Governor, often predicted the lowest interest rates, but Miran has now left, giving way to Warsh. If this dot plot doesn't have a similar low "dot," it could reveal that Warsh isn't as dovish as Trump hopes.
Another scenario is that Warsh still sends signals, but will review how the Fed communicates policy afterward. In short, unlike Powell, Warsh wants to move the Fed from a forecast-based operating model back to a more discreet one.
> Investors are currently concerned that if the Fed suddenly drastically reduces the frequency of its signals, volatility in global financial markets could increase significantly in the short term.
The Fed's June policy meeting is underway, and the interest rate decision will be announced at 1 AM tonight, followed 30 minutes later by a press conference by the new Chairman, Warsh.
Altcoin saw the strongest net sale in 5 years
This index measures the volume difference between spot buying and selling of all altcoins (except BTC, ETH) on CEX, calculated over the most recent 12 months.
Looking at the chart, in the past year selling force has exceeded buying force by more than $250B. This difference is also clearly reflected in TOTAL3's capitalization, which has almost been divided in half since the peak in October 2025.
Will a portion of the $8-9 trillion soon flow into risky assets?
Rick Rieder, head of bond trading at Blackrock, suggests that approximately $8-9 trillion is currently held in money market funds for safe-haven investments. Following the Iran peace agreement, this money is beginning to flow back into stocks and risky assets.
He cites yesterday's example: when US stocks and bonds were booming, BTC also rebounded, signaling a market recovery.
However, 5PC needs to clarify that the $8-9 trillion represents the total accumulated AUM from 2022-2023, when the Fed continuously raised interest rates, not just recently. History shows that money leaving money market funds is usually very slow. But if Rieder is even partially correct, BTC ETFs will be one of the first to catch this wave.
GM criptor
Is the thesis finally starting to play out?
SpaceX gets listed, attention starts rotating back toward risk assets, crypto sentiment improves, and suddenly we're seeing double-digit candles again.
And this may only be the beginning.
There are still major IPOs ahead, each with the potential to pull even more attention and liquidity back into speculative markets.
One of the biggest mistakes investors make is believing they'll have plenty of time to position.
Markets rarely move that way.
They spend weeks doing nothing, then deliver a 15-20% move overnight while everyone is waiting for a better entry.
That's why conviction matters.
That's why DCA matters.
The bear market is where positions are built, not where narratives are confirmed.
Our focus hasn't changed:
• $TAO / $NEAR — AI
• $HYPE / $ASTER — Perps
• $XMR — Privacy
• $PENGU — Licensed IP memes
• $SOL / $ETH — Core onchain infrastructure
The cycle typically starts with quality large caps leading the way.
The real onchain season comes after.
And when it does, we'll be hunting every runner that emerges.
Imagine watching it all from the sidelines.
Is gold setting up for a short squeeze amid easing geopolitical tensions?
Gold funds recorded $2.3 billion in outflows last week, extending the streak to four consecutive weeks of withdrawals.
The 4-week average now sits at -$2.0 billion, the second-largest outflow period on record, trailing only the -$3.5 billion peak seen in February.
At the same time, $GLD, the largest U.S. gold-backed ETF, has already seen $2.2 billion in outflows this month and is on pace for its fourth straight month of redemptions.
Year-to-date, $GLD has lost $8.1 billion in assets, putting it on track for its first annual net outflow since 2023.
Investor positioning is becoming increasingly one-sided.
If sentiment shifts or macro risks re-emerge, gold could be vulnerable to a sharp upside squeeze.
US-Iran Officially Reach Peace Agreement
🇺🇸 President Trump declared the agreement with Iran complete, confirming the reopening of the Strait of Hormuz. He expressed anger at Netanyahu for unilaterally launching airstrikes in Beirut that nearly derailed the deal.
🇮🇷 Iran had planned retaliation against Israel after the airstrike in Lebanon this morning. However, after last-minute concessions from Trump, Iran decided to halt the attack.
The agreement was announced by Pakistan and confirmed by US leaders and Iranian media.
Brent crude oil continues to fall to $83, US stock futures are soaring, and BTC jumps to nearly $66,000.
Inflationary pressures are beginning to build again in Japan.
Producer prices rose 0.9% in May, marking one of the strongest monthly increases since late 2022. Meanwhile, April's data was revised sharply higher, pushing annual PPI growth to 6.3%, the fastest pace in over two years.
The recent surge has been fueled by rising energy and commodity costs, particularly across petroleum, coal, electricity, gas, and chemical products.
As input costs continue climbing, Japanese businesses may increasingly pass those expenses on to consumers, raising the risk of broader inflation across the economy.
With inflation showing renewed momentum, pressure is mounting on the Bank of Japan to continue tightening policy, especially if energy prices remain elevated in the months ahead.
Japan's inflation trend is moving higher, not lower.
AI is driving US inflation higher:
Consumer prices for computer software and accessories surged +14.5% YoY in May, the biggest annual increase on record in data going back to 2000.
Producer prices for electronic components soared +27% YoY, also the biggest increase on record.
To put this into perspective, before 2026, prices for software and electronic components fell in almost every year since 2000.
Memory prices alone have more than doubled, with DDR5 and DDR4 RAM prices up +290% YoY, as AI data centers absorb the vast majority of global chip supply.
RAM price shocks are will likely keep inflation elevated well into 2027, adding to existing pressures from the Iran War.
The AI boom is fueling technology inflation.
🔸 Garrett Jin has just increased his long position in $ZEC (2x leverage) to 46,013 ZEC, equivalent to approximately $19.3 million. However, this position is currently showing a temporary loss of over $950,000 as the price of ZEC corrects from its recent peak.
🔸 In addition, Garrett still maintains a long position of 1,268 $BTC with 5x leverage, worth over $81 million. This large bet is currently incurring an unrealized loss of over $14.86 million. Continuing to hold both BTC and ZEC despite the pressure of losses shows that this whale has not given up hope for a strong market recovery in the near future.
What do you think of Garrett Jin's strategy? Is this smart money patiently waiting for a major market reversal, or will the high leverage increase pressure if the downtrend continues?
This article is for news updates only and is not investment advice.