What if 2.5% inflation is no longer the target… but the floor?
The latest inflation data may be signaling something more significant than a temporary surge in energy prices. After years of extraordinary monetary stimulus, inflation could be settling into a structurally higher range.
Understanding long-term trends - not just short-term headlines - is essential for investors navigating today’s markets. https://t.co/YbtzFYnCta
🚨 Bullish sentiment hits a 29-year extreme.
Previous spikes at similar levels have preceded stock market corrections.
We're tracking the critical price levels that matter most right now.
See 18 charts sending warning signals: https://t.co/2VWYMuL6RC
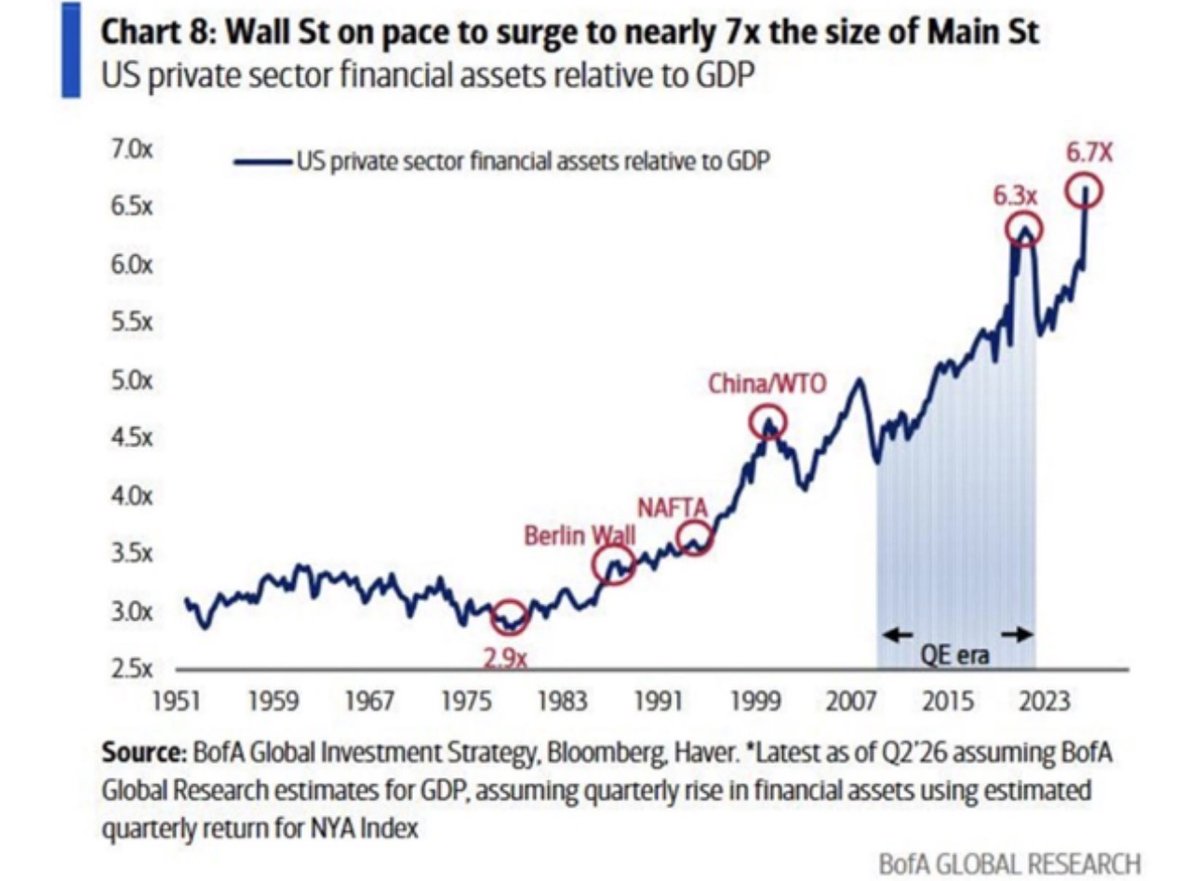
A record divergence:
U.S. private sector financial assets = 6.7x GDP.
Above 2021 highs, radically higher than the 2000 top, and more than double the 1970s low.
When financial markets outgrow the real economy, imbalances follow — and so do consequences.
Is this the most dangerous market in history? Read this free report: https://t.co/3e3tZGrM2m
Follow Elliott waves - not headlines!
Here's another example of how Elliott waves can keep you ahead of major market moves.
On April 7 at 11:44 AM, our Energy Pro Service alerted subscribers to a wave setup in oil saying, "A period of downward consolidation still seems likely..." - just ahead of the 20% drop in crude oil.
Learn how to put Elliott waves to work for you with this free resource: https://t.co/iiOZnbmsNz
Rule nothing out - the U.S. can default on its debt.
The chart shows that, having already been on a rising trend perhaps in anticipation of events, the cost of insuring against a U.S. sovereign default over the next five years has risen by 20% since the war started, with the 5-year CDS rising from 31-basis points to 37.
We have been forecasting higher bond yields for some time and that trend now seems to be getting going.
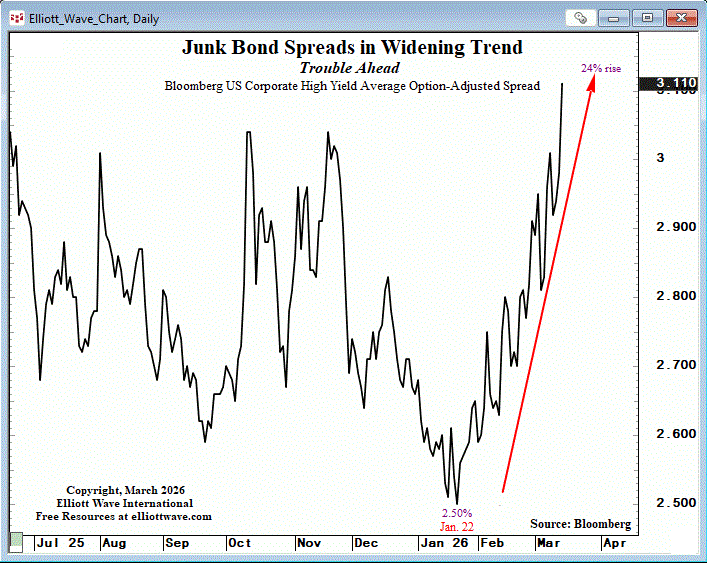
Another warning sign is emerging in credit markets.
Junk bond spreads have surged from 2.50% in January to above 3.00% in just weeks — a 24% jump.
They’re now at their widest level in nearly a year.
See 18 Flashing Red Signals - FREE. https://t.co/3RDreJObGP
We just updated one of our most popular reports. Every investor should take a look at these 18 flashing red signals. Get it free for a limited time: https://t.co/5OVkoZdopL
😲 Think about this...
March 2026 is the largest monthly trading range (with the possible exception of April 2020) since crude futures began trading in 1983.
That kind of volatility can make your year — or destroy it.
Right now, you can test-drive our Energy Pro Service for a full week for $27. Go! https://t.co/2Gh8AhXRq1
You get real-time Elliott wave analysis for crude oil and nat gas throughout the open session.
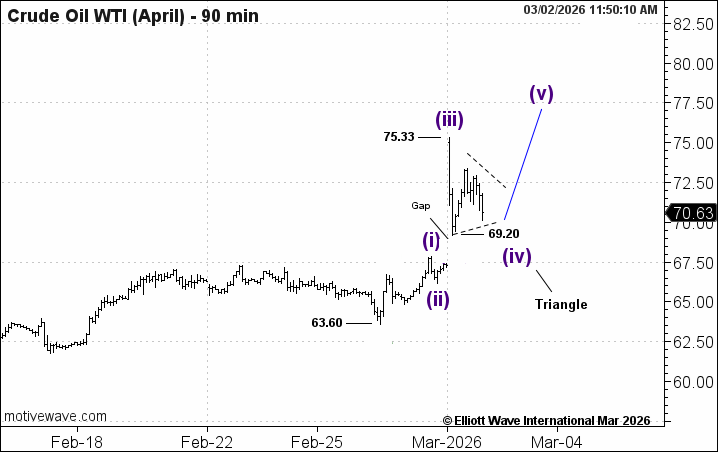
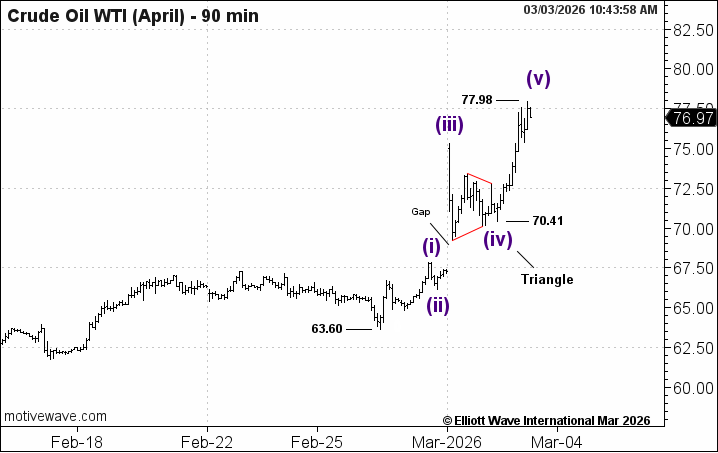
Crude moved again - and Elliott waves caught the setup ahead of the news.
March 2:
“The pullback should prove corrective and set the stage for further advance.”
Result? +9%.
March 3:
“The strong tone persists... but an interim top may be drawing near.”
Result? -6%.
Get free Elliott wave insights and trading tips: https://t.co/ck3mLNivpE
What if your biggest trading problem isn’t your analysis…
but your approach?
This Tuesday, we’re breaking down how two Elliott Wave analysts apply the same principles in completely different ways — based on personality, risk tolerance, and time horizon.
Join us live (free)
https://t.co/vGNEsqZIYE
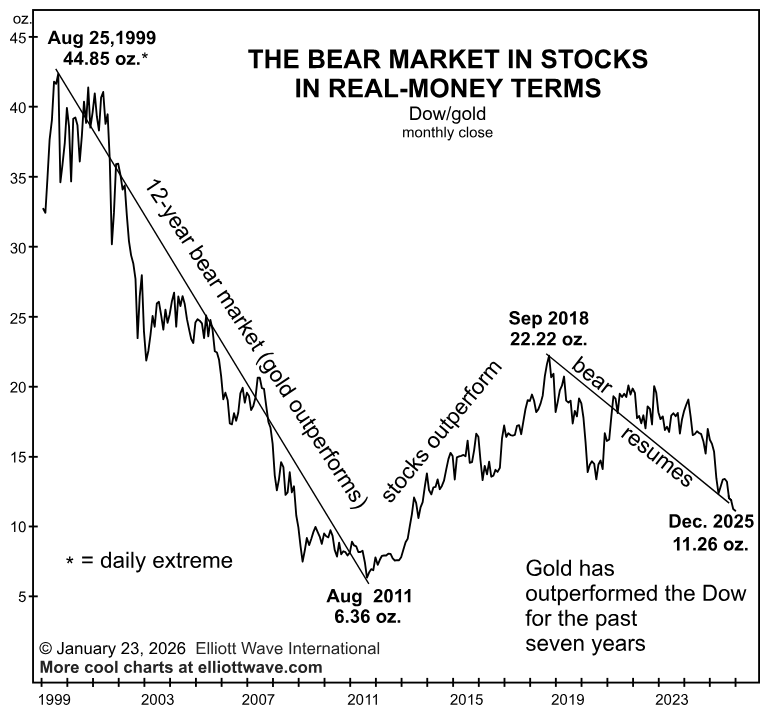
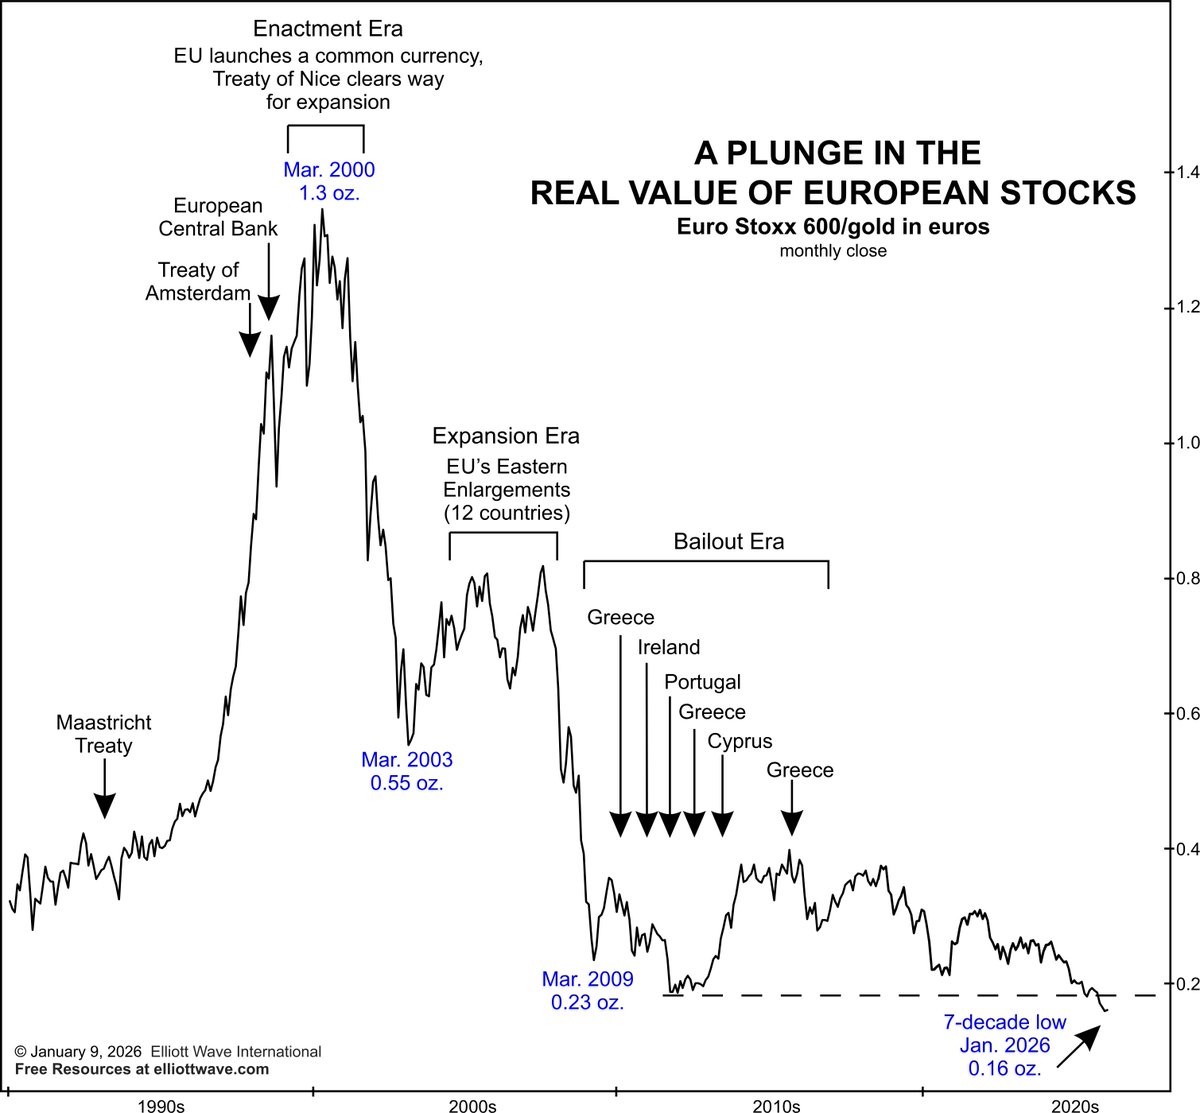
When you measure stocks in real money, the picture is brutal:
• U.S. stocks: ~75% decline since 1999
• European stocks: nearly 88% down since 2000
Want to see what's next for stocks? Read Robert Prechter's January Theorist - Free: https://t.co/XbFd6Pj9zg
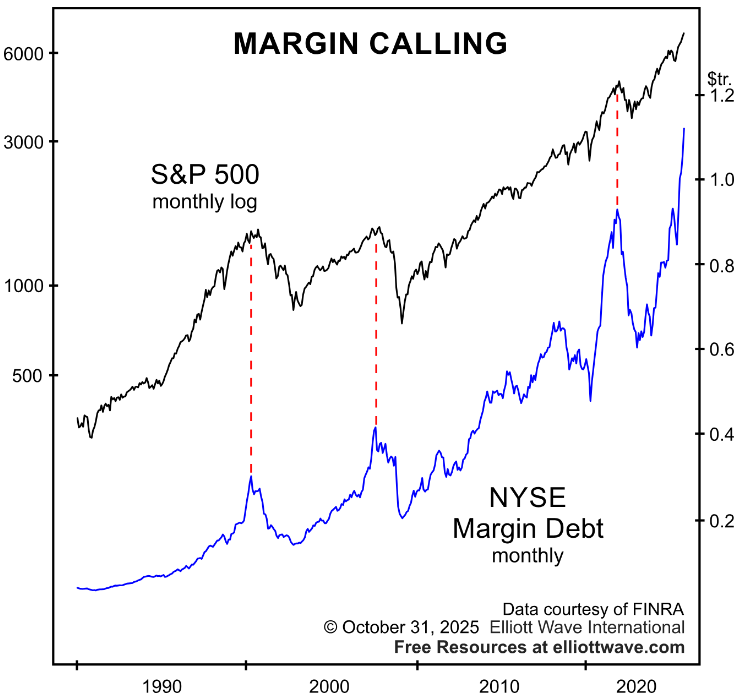
🚨 Margin debt just hit another record.
After pushing past $1 trillion, it climbed to $1.13 trillion in September - up 20.8% from its 2021 peak. This conventional measure of margin debt is at scary heights, but it pales in comparison to new forms of debt that financial engineers continue to conjure up.
Get free insights inside our Wave Break newsletter. https://t.co/W9981283F2
Dow waving the white flag?
Last week, the Dow broke above three resistance trendlines - but Wednesday’s "outside-down" day and three straight closes beneath them could be hinting that something's shifting beneath the surface.
Our analysts are tracking the waves in real time. See what they're watching right now - https://t.co/SOuecbKGc3
🚨Headlines are hyping up the housing market: “Positive Signs for Summer 2025!” But here’s a question that doesn’t get asked enough…
Do home sales lead the economy?
Short answer: Yes.
And history backs it up.
In 4 of the last 5 recessions, home sales dropped before the economy did.
One key example? From Sept. 2005 to Dec. 2007, sales fell 39% — right before the 2008 crash.
Now look at this: From Jan. 2021 to March 2025, we’ve seen the same exact percentage drop.
#HousingMarket #RealEstate #Recession #HomeSales #MarketTrends #ElliottWave
Get FREE access to one of our most-popular online trading courses, "Robert Kelley's 3 Favorite Trade Setups."
👉Watch now! https://t.co/49sKwPbTcU
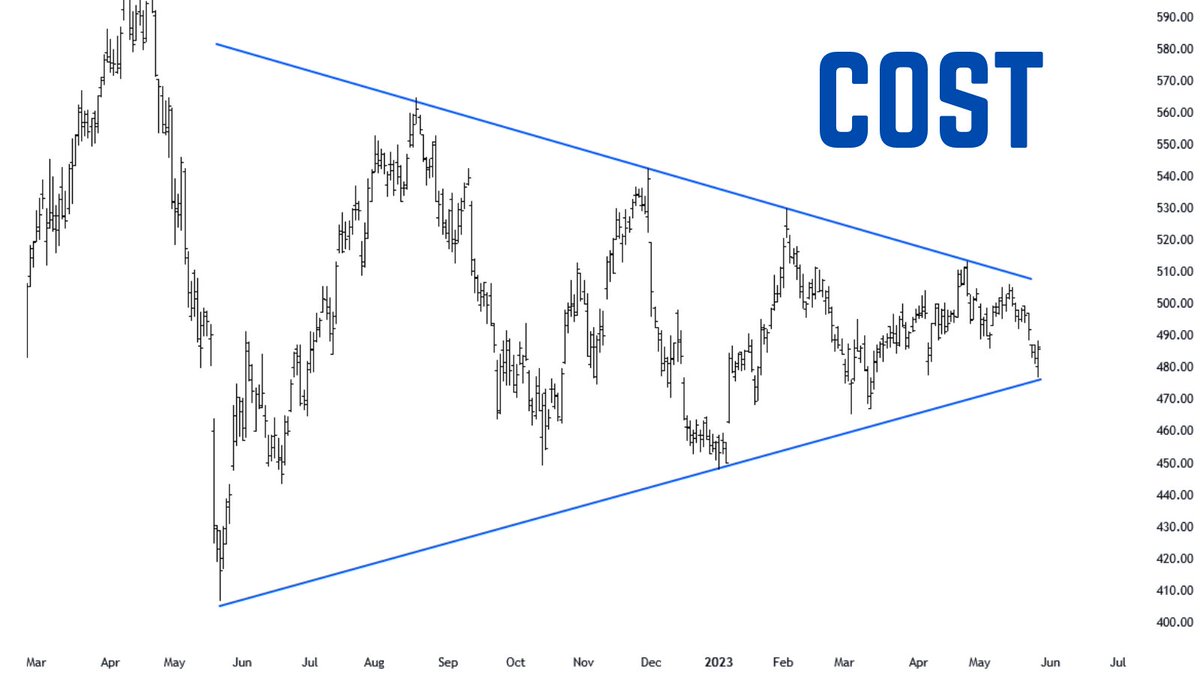
You'll discover the wave setups Robert trusts most — including this real-world Elliott wave triangle setup he called in #COST:
"Costco looks like a nice triangle on the bigger picture. Overall, I think it should bottom soon and go up to new highs."
#Costco price more than doubled following the triangle pattern, hitting a high near 1080!
#trading #tradingtips #tradesetup #tradingstrategy #tradingplan #elliottwave #technicalanalysis #daytrader #daytrading
The default for 90%+ of all financial punditry is to attribute market moves to the latest news. It’s lazy – and it’s usually wrong. @RobertPrechter addresses the fallacy of exogenous cause and rational reaction in his book, The Socionomic Theory of Finance. Here’s an excerpt:
"This chart reveals that had economists expressed relief whenever the trade deficit began to expand and concern whenever it began to shrink, they would have quite accurately negotiated the ups and downs of the stock market and the economy over the past 40 years. The relationship, if there is one, is precisely the opposite of the one they believe is there. Over the span of these data, there has been a consistently positive—not negative—correlation among the stock market, the economy and the trade deficit."
So, the trade deficit’s widely presumed effect is 100% wrong.
Want more insights from Bob Prechter? Check out his monthly newsletter, The Elliott Wave Theorist, to help you stay ahead of the mainstream misses! https://t.co/F0NMrCMdYl
#tradewar #tariff #tradedeficit #economy #stockmarket #Elliottwave
#Bitcoin climbs back above $90k and surpasses Google to become the 5th largest asset in the world by market cap!
Get #crypto forecasts and 70+ market outlooks inside the Pro Services Test Drive: https://t.co/s4Q5bFBbdf
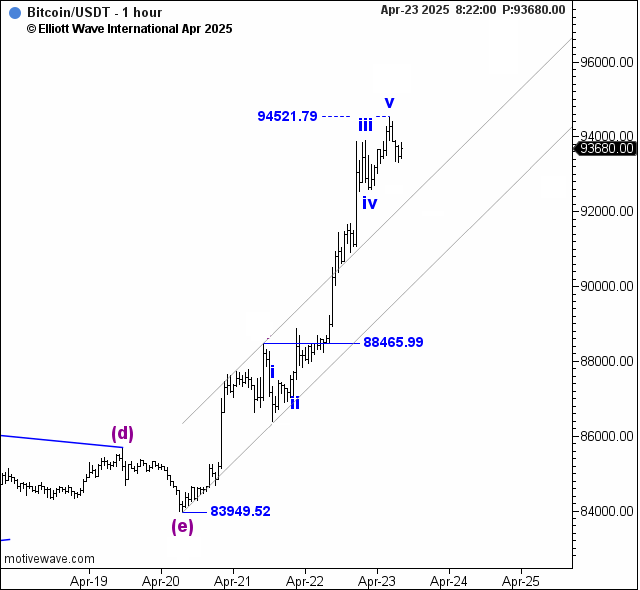
Our Crypto Pro Service recently spotted a favorite wave pattern among traders in #BTC - the triangle:
4/20 -- 11:35 PM
"Bottom Line: Post-triangle thrust is underway against 83949.52."
#cryptotrading #cryptotrader #tradingtips #Google #GOOG
🚨The U.S. dollar just hit a 3-year low!
We warned subscribers about a potential drop back in January. Commentary below from the 4/16 Short Term Update:
"The bottom graph on the chart shows Large Speculators bets for and against the U.S. Dollar. This is the combined Large Spec position for the Japanese yen, the Euro, the Aussie dollar, the Swiss franc, the Canadian dollar, the British pound, the New Zealand dollar and the Mexican peso. Back in mid-January, these pages pointed out that bets for the U.S. dollar to rise had reached a 9-year extreme, which was compatible with the [completed Elliott wave pattern]. Since then, the chart shows how swiftly Large Specs have covered their wrong-way bets."
Gold breaks $3,400 for the first time!
Get forecasts for #gold#silver#stocks#cryptos#oil#forex and 70 global markets during the Pro Services Test Drive: https://t.co/ZOUtE3x4wn
4/17 6:35 AM
"Bottom Line: Gold should continue rising in a fifth wave. The outlook is bullish to new highs while price holds above the 0.382 retracement level."


![elliottwaveintl's tweet photo. 🚨The U.S. dollar just hit a 3-year low!
We warned subscribers about a potential drop back in January. Commentary below from the 4/16 Short Term Update:
"The bottom graph on the chart shows Large Speculators bets for and against the U.S. Dollar. This is the combined Large Spec position for the Japanese yen, the Euro, the Aussie dollar, the Swiss franc, the Canadian dollar, the British pound, the New Zealand dollar and the Mexican peso. Back in mid-January, these pages pointed out that bets for the U.S. dollar to rise had reached a 9-year extreme, which was compatible with the [completed Elliott wave pattern]. Since then, the chart shows how swiftly Large Specs have covered their wrong-way bets."](https://pbs.twimg.com/media/GpFElZrWEAA-lA9.jpg)


