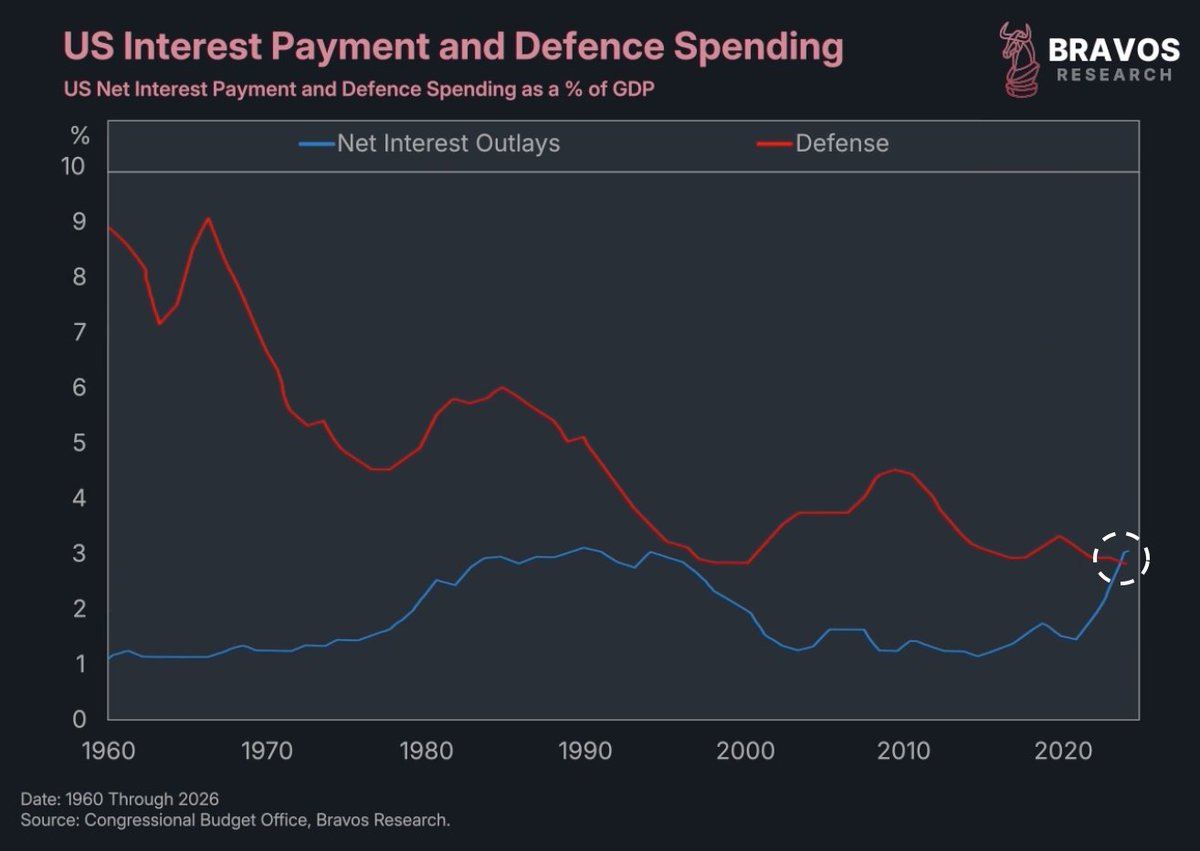
The US now spends more money on interest payments than defense.
And this could get worse with 50% of government debt maturing by 2028.
This leaves the US government with only 1 option…
A thread 🧵
1) Gold vs. S&P 500 Breakout
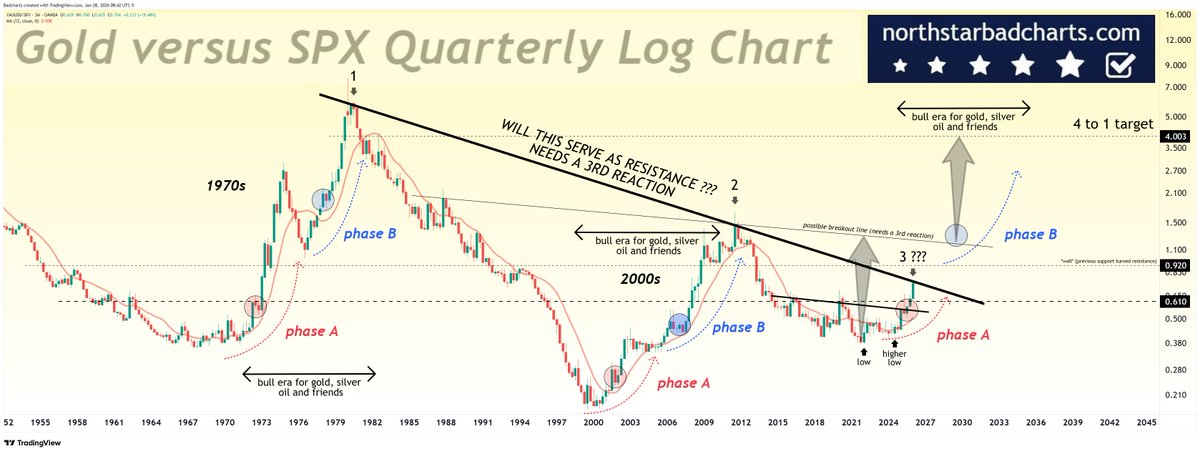
As you will see shortly, one indicator of cyclical and secular peaks is Gold making a vertical move against the stock market.
Gold has just broken out from a 12-year-long base against the stock market. It has not gone vertical yet.
This breakout signals potential for an acceleration in the shift away from conventional stocks and into Gold.
It marks the beginning of a move, not the end phase.
Gold pulled back sharply after hitting $5,600, marking its biggest daily drop in months.
Price now rebounds from the trend line, which is the first support of this drop.
As the market fixates on silver’s volatility:
The silver miners-to-silver ratio is currently at one of its lowest levels in history.
Not long ago, investors were dreaming of silver trading above $50/oz.
Today, with prices well above that level, some producers are operating at sub-$15/oz costs.
These are the mining industry’s equivalent of tech- or software-like margins.
What a moment to deploy capital, even as the market remains distracted by volatility.
Game on.
For those who are new, we’ve seen this movie before.
A falling DXY perpetuates the system and a rising DXY breaks the system. There is a time to plant and time to harvest. It’s been going on for a long time. And it’s not over yet. ✌️
Gold is heading towards being worth 4X the price of the stock market (spx).
Would not surprise me to see a $28,000 price tag on gold before it is all said and done.
After this rally in gold, the market value of US official gold as a % of foreign-held USTs is up to 14%.
Assuming no further rise in foreign held USTs, gold would have to rise:
50% to get to 1989 levels
3x to get to LT average levels
9x to hit 1980 levels
Silver eating up years of Bitcoins gains. If we can confirm this breakout at the end of the month, it points to a LONG TERM trend change, with silver outperforming Bitcoin for many more years ahead.
I showed you what gold & silver were going to do before they did it. Now I'm telling you to watch oil VERY CAREFULLY this year and next. $250+ is very likely in the next 5 years.
It might look like gold & silver are going up, but it's YOUR purchasing power which is being DESTROYED. The government doesn't want you to know this. Let the plausible deniability & distraction continue...
My big winners today. Early winners should be the big winners. Check out Hecla up 9% today. You want to own quality. They will participate.
If gold holds $4500 and silver holds $80 for the rest of the year, most of these stocks will double. It takes time for them to catch up to the metal price.
And if gold and silver go higher? That would imply these stocks will become 🚀.
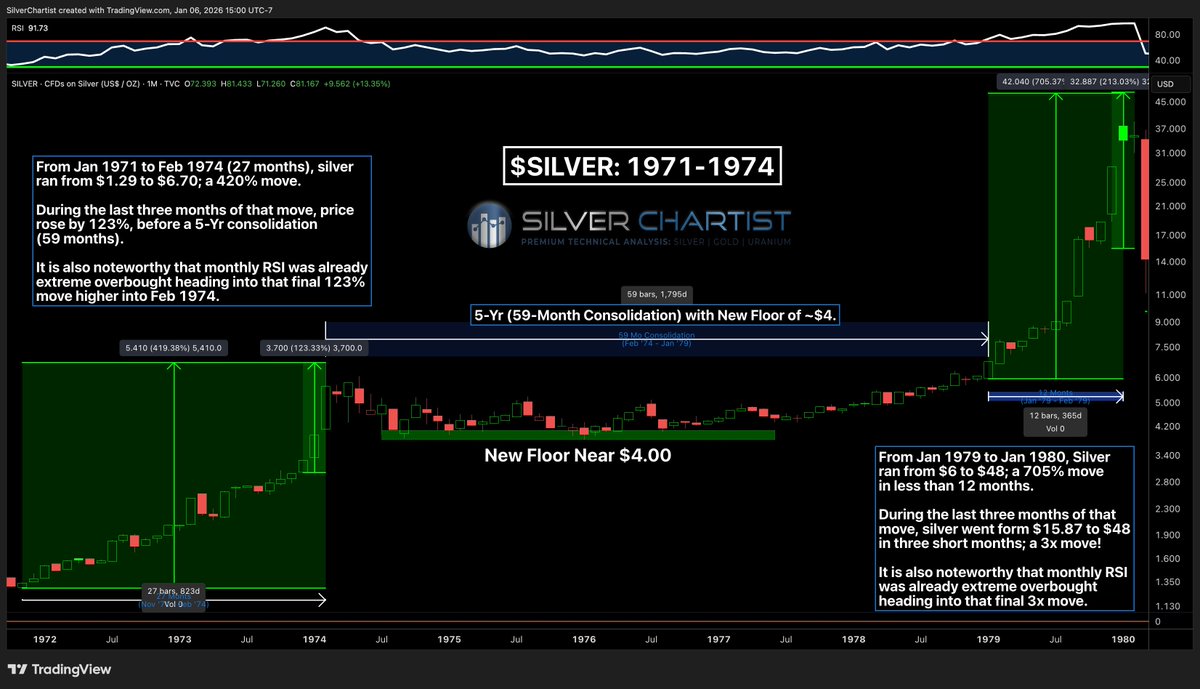
🎯#SILVER: 1971-1980
I believe the 1970's bull market, that culminated with a sharp 200% move in the last three months, is the best analogue for the current precious metals bull. (See Chart Below 👇)
I suspect that the fundamental forces at play now are more powerful than they were back then, so it is reasonable to expect an amplified replay of that historic bull market.
Also, with a national debt closing in on $40T the prospects of a Paul Volcker allowing real interest rates to rise into positive territory are practically zero.
Here are several noteworthy observations from the 1970s bull that are helpful to consider when crafting a personalized strategy to handle this type of wild bull market:
-25+% pullbacks were rare
-Silver consolidated in a sideways range for 5-yrs (59 consecutive months) from 1974-1979.
-The biggest gains came in short 3-month spurts.
-The explosive bursts higher began with a monthly RSI that was already overbought.
-From Jan 1971 to Feb 1974 (27 months), silver ran from $1.29 to $6.70; a 420% move.
-During the last three months of that move, price rose by 123%, before a 5-Yr sideways consolidation (59 months).
-Monthly RSI was already extreme overbought heading into that final 123% move higher into Feb 1974.
-From Jan 1979 to Jan 1980, Silver ran from $6 to $48; a 705% move (!) in less than 12 months.
-During the last three months of that move, silver went form $15.87 to $48 in three short months; a 3x move!
-It is also noteworthy that monthly RSI was already extreme overbought heading into that final 3x move.
My baseline assumption is that we are in a "1974 moment" right now in precious metals, with intermediate peaks being close at hand.
Of course,
💎Strategy > Predictions
The measured move target on this breakout is $88 to $96, and this near vertical move could easily extend towards those targets before the next big consolidation/pullback.
BREAKING: The US Dollar now represents ~40% of global currency reserves, the lowest in at least 20 years.
This percentage has declined -18 percentage points over the last 10 years.
Over the same period, gold’s percentage has increased +12 points, to 28%, the highest since the early 1990s.
Gold now accounts for more global FX reserves than Euro, Yen and Pound combined.
This comes as central banks continue diversifying away from the US Dollar while rapidly stockpiling gold in their vaults.
As a result, gold prices rallied +65% in 2025, the largest annual gain since 1979, while the US Dollar Index declined -9.4%, its worst annual performance in 8 years.
Gold is changing the world.
#Silver is surging toward the top of its long-term ascending channel.
After years of compression, the price is now approaching the upper boundary with a move above $100 in sight.