Presented at #ESCCongress from @JAMA_current:
After #TranscatheterAorticValveImplant, factor Xa inhibitor non–vitamin K antagonist oral anticoagulant monotherapy reduced hypoattenuated leaflet thickening vs acetylsalicylic acid monotherapy.
https://t.co/aLY3mdBmL8
NOBLE 10-year just dropped in @TheLancet. HR 0.93 (0.74–1.18) for all-cause mortality, PCI vs CABG in unprotected LM disease.
Headline: "PCI is equally as safe as CABG."
The statistical design tells a more complicated story. Long post — let's go deep.
NOBLE enrolled 1,201 patients at 36 sites in N. Europe + UK. Heart-team consensus on dual eligibility. Open-label RCT. Predominantly 2nd-gen DES. ITT analysis. The original design was a non-inferiority test on a MACCE composite at 5 years. The 10-year "primary" is all-cause mortality. That switch matters.
The numbers: PCI 23% (136/592) vs CABG 25% (145/592). HR 0.93 (95% CI 0.74–1.18); p=0.56. 98% follow-up at 10y — that part is excellent. Landmark 0–5y: HR 1.06 (0.73–1.55). Landmark 5–10y: HR 0.86 (0.64–1.16). No late catch-up — that's a real finding.
First problem, and the authors are upfront about it: "The statistical analysis plan for the 10-year endpoint was not prespecified in the protocol." They reused the 5y SAP "for consistency." So the 10y analysis is essentially a post-hoc primary endpoint. That changes how you read p=0.56.
Second: the trial was never powered for all-cause mortality. The original power calc was for MACCE. With 281 total events, the Schoenfeld formula gives ~80% power to detect HR ≈ 0.72 — i.e., a 28% relative risk reduction. For a smaller effect like HR 0.74, NOBLE has only ~71% power. To hit 80% at HR 0.74 you'd need ~346 events; they have 281.
Authors say it themselves: "a type 2 error cannot be excluded."
Now to the deepest issue with the conclusion.
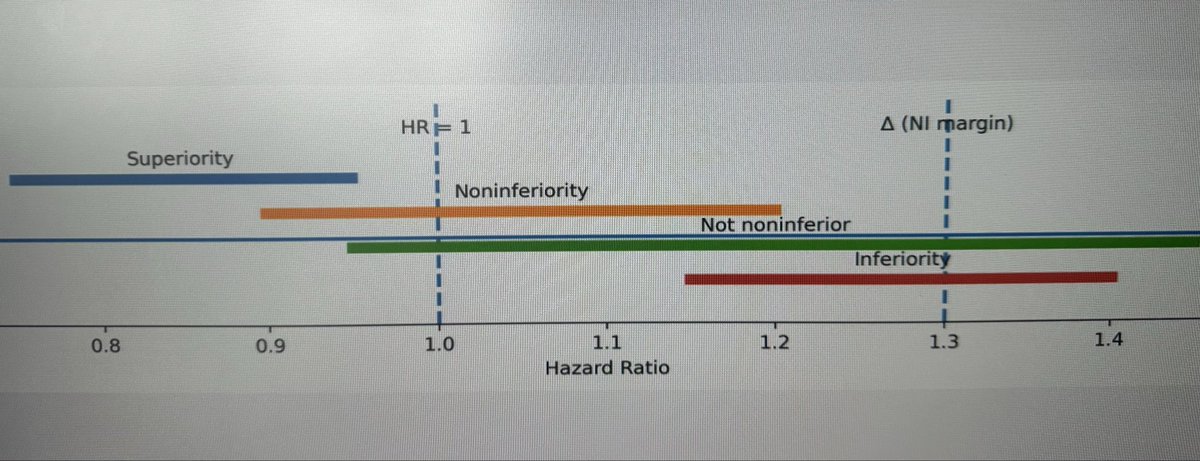
Three statistical frameworks exist for comparing two treatments, and they ask genuinely different questions.
Superiority asks: is A different from B? A positive result (p < 0.05) means you've shown A and B differ. A negative result (p ≥ 0.05) means you have NOT shown they differ. Now, that's not the same as showing they're the same. You've simply failed to find a difference, which can happen either because there isn't one or because your trial wasn't large enough to detect one.
Non-inferiority asks: is A no worse than B by more than some clinically tolerable margin δ? You define δ in advance (say, HR 1.15 — "we'd accept up to a 15% relative increase as not meaningfully worse"). A positive result means you've shown A doesn't fall below that margin on the worse side. A negative result means you have NOT shown non-inferiority — A might be acceptably close to B, or it might be meaningfully worse; this trial just can't tell. Non-inferiority says nothing about whether A is better than B.
Equivalence asks: are A and B clinically interchangeable? You define a margin δ in both directions (e.g., a band of HR 0.87–1.15). A positive result means the entire CI fits inside that band — you've shown the two are close enough in both directions to call them equivalent. A negative result means you have NOT shown equivalence — the CI extends past the margin on at least one side, meaning a clinically meaningful difference (in either direction) remains possible.
The common trap across all three: a negative result never proves the absence of an effect. It only means the trial couldn't demonstrate the effect it was testing for. The framework you choose determines what that "demonstrated effect" actually is — and you can't borrow the conclusion from one framework when you ran the test for another.
NOBLE 10y ran a superiority test. p=0.56 means we cannot conclude PCI and CABG differ in mortality. That's it. It does NOT mean we've shown they're the same. Failing to detect a difference is not the same as detecting equivalence — a small or underpowered trial will fail to find a difference even when a real one exists. Exactly the type 2 error the authors flag.
But the published conclusion — "PCI is equally as safe as CABG" — is an equivalence claim. To support it, you'd need a prespecified margin (say HR 1.15), a power calculation built around it, and a CI that fits entirely between 0.87 and 1.15. NOBLE has none of these.
And the CI is the giveaway. The 95% CI of 0.74–1.18 spans a 26% relative mortality reduction with PCI to an 18% increase. If equivalence had been prespecified at HR 1.15, NOBLE would have FAILED to demonstrate it — the upper bound (1.18) extends past the margin. So even on a reasonable equivalence framework, the trial doesn't prove what its abstract claims.
The honest framing: mortality was numerically similar at 10 years; the trial was not designed to demonstrate equivalence; the CI is consistent with mortality differences up to 18% in either direction. That's defensible. "Equally as safe" is not.
Now the strengths, because the trial does have them.
The 0–5 vs 5–10 landmark directly tested the "late mortality catch-up" hypothesis raised after EXCEL. Both windows neutral (HR 1.06 and 0.86, both CIs cross 1). That hypothesis is now harder to defend. Clean, prespecified piece of work.
The Bayesian-Weibull sensitivity is also smart. Informative prior HR 1.10 (from SYNTAX + PRECOMBAT, 1st-gen DES). Posterior median 0.95 (95% CrI 0.74–1.18). Conservative prior, neutral posterior, robust to modeling assumptions. Caveat: the prior is drawn from 1st-gen DES trials applied to a mostly 2nd-gen comparison.
Now the trickiest piece — the ACS subgroup. PCI vs CABG in ACS: HR 0.57 (0.32–0.99), p_interaction = 0.049. PCI mortality reduction of 43% relative to CABG — if true, a major shift in how we think about LM revascularization in ACS.
But two things make this fragile.
First, the interaction p-value sits exactly at the conventional 0.05 threshold. A single reclassified event, a slightly different model, one more patient lost to follow-up, and it flips. The universe doesn't change between 0.049 and 0.051 — but our willingness to believe the result probably should.
Second, multiplicity. NOBLE tested nine subgroups (age, sex, BMI, diabetes, lesion count, ACS, distal LM, SYNTAX, overall). With α = 0.05 per test and no correction, the probability of at least one false positive across nine independent tests is 1 − 0.95⁹ ≈ 37%. Even if PCI and CABG were truly equivalent in every subgroup, you'd see a "significant" interaction roughly one trial in three by random noise alone. A Bonferroni-corrected α would be 0.05/9 ≈ 0.0056 — and the ACS interaction at 0.049 is ~9× that threshold.
The authors acknowledge this: "the risk of a type 1 error cannot be excluded." A structural anomaly inside the ACS interaction reinforces the caution: CABG mortality in ACS = 31% in NOBLE vs ~22% in pooled SYNTAX/PRECOMBAT ACS. Plausible mechanism (median CABG delay 6d vs PCI 1d in ACS), but this is post-hoc reasoning on a borderline interaction. Hypothesis-generating, not practice-changing.
One more methodological note: the PH assumption was tested with log-log plots only — no Schoenfeld residuals, no formal test reported. The ACS subgroup KM curves diverge late (clear non-proportionality). For that subgroup specifically, RMST would have been more appropriate than HR.
Now the IVUS substudy — and an important update. NOBLE reported a striking post-hoc signal: final IVUS after PCI: HR 0.79 (0.61–1.04) vs CABG; no final IVUS: HR 1.31 (0.94–1.83) vs CABG.
Let's take a moment here. OPTIMAL (Testa et al., NEJM 2026) was recently published with 806 patients, a dedicated RCT of IVUS-guided vs angio-guided PCI in unprotected LM disease, mean SYNTAX 29.7. Primary patient-oriented composite: HR 1.11 (0.87–1.42), p=0.40. Death: HR 1.06 (0.74–1.50). The signal NOBLE's substudy hinted at didn't replicate when tested under randomization.
The most likely explanation: the NOBLE IVUS substudy was confounded by era, operator, and center selection — patients receiving IVUS in 2008–15 were treated by different operators at different centers under different protocols than those who weren't. Randomization in OPTIMAL stripped that out. A secondary explanation: OPTIMAL's angio arm was operationally executing IVUS-derived best practice (97% post-dilation, 89.6% POT, high-volume operators using IVUS in 50–100% of routine LM cases), shrinking the marginal benefit of the imaging itself. The LM-specific imaging benefit looks much smaller than NOBLE's substudy suggested.
One structural shortcoming worth flagging: adverse events (MI, stroke, repeat revasc) weren't collected after year 5 in NOBLE. So the 5–10y window has only mortality — the least sensitive endpoint for PCI vs CABG. The MACE gap from year 5 could have widened. We don't know.
Bottom line.
What NOBLE 10y proves: in selected LM patients (no complex lesions), 10-year mortality is similar with PCI vs CABG. No late mortality catch-up after year 5.
What it doesn't prove: equivalence (never formally tested). MACE parity at 10y (not measured). PCI > CABG in ACS (hypothesis-generating). And after OPTIMAL: a meaningful incremental benefit of routine IVUS over angio in LM PCI at expert centers.
What would actually settle the PCI vs CABG question: a modern RCT of contemporary LM PCI (operator-discretion intracoronary imaging, POT discipline, contemporary DES, optimal DAPT) vs multi-arterial CABG, MACE prespecified through 10 years, with women, ACS presentations, and non-White patients adequately represented.
Until then: nuanced shared decisions.
#CardiologyX #PCI
Very well said!
One thing to add, I do think we can push the edge a little more against “biology”.. and we have seen it!
A 90-120 min PCI with atherectomy+scoring+IVL (together when needed) + post dilation with NC/OPN is NOT THE SAME as 30-60 min PCI with only one or even two tools plaque modification then post dilation.
Whether you used IVUS or not, you know results will be different.
Very well said!
One thing to add, I do think we can push the edge a little more against “biology”.. and we have seen it!
A 90-120 min PCI with atherectomy+scoring+IVL (together when needed) + post dilation with NC/OPN is NOT THE SAME as 30-60 min PCI with only one or even two tools plaque modification then post dilation.
Whether you used IVUS or not, you know results will be different.
My thoughts on IVUS-CHIP & OPTIMAL
Yes, I'm also still digesting the results from IVUS-CHIP and OPTIMAL. I think we all are. And I understand why we as a community are having some trouble sitting with these results.
But first, I have to disclose my conflicts of interest: I'm a proctor and speaker for Boston Scientific, specifically for CHIP interventions. I've been doing this for years. So yes, I have skin in this game too, and these results challenge some of my own deeply held beliefs about how we do interventional cardiology. That's exactly why I think we owe it to ourselves to think clearly here, not defensively.
So let's look at what happened. IVUS-CHIP: HR 1.25 (0.97–1.60). OPTIMAL: HR 1.11 (0.87–1.42). Two large, well-designed European trials, both published simultaneously in NEJM, both neutral — and both trending numerically against IVUS. That stings. I get it.
But here's what's been bothering me about the reaction. The most common defense I keep seeing is: "IVUS-CHIP failed because only 48% of lesions met the predefined optimization criteria." And I understand the instinct — if the intervention wasn't properly delivered, how can we judge it? Fair enough. But let's check the receipts.
ULTIMATE — the trial we all love to cite as proof that IVUS works — achieved optimization in 53%. RENOVATE — arguably the strongest positive IVUS trial we have — achieved ~58%. OCTIVUS — 55% in the IVUS arm. IVUS-CHIP: 48%.
Do you see the problem? The difference is marginal, but the way we treat these numbers is completely asymmetric. We celebrate ULTIMATE at 53% as a win for IVUS. We dismiss IVUS-CHIP at 48% as a flawed trial. That's not consistent. Either suboptimal implementation invalidates all of these trials, or it invalidates none of them. We have to pick one.
And honestly, I think the real answer is simpler than we want it to be. Maybe 50–55% optimization isn't a failure of any particular trial. Maybe it's a biological ceiling. Diffuse disease, heavy calcium, tortuous anatomy — there are lesions where clean landing zones simply don't exist, no matter how good the operator or the imaging. Look at the substrates: IVUS-CHIP had 45.8% severe calcification and a mean distal edge plaque burden of 47.6% — nearly failing the optimization criterion by definition. RENOVATE had 13.5% severe calcification and 40.6% distal plaque burden. Same tool, same criteria, vastly different biology. We can't keep blaming the operator when the anatomy won't cooperate.
And this leads to an uncomfortable thought: maybe reaching stent optimization criteria says more about the anatomy you're working with than the technique you're using. We can achieve what the vessel allows us to achieve — nothing more. Better anatomy = higher optimization rates = better outcomes. That's not IVUS working better. That's easier disease behaving better. And if that's true, then the positive trials may have been telling us more about their patient population than about the tool itself.
There's another criticism that deserves pushback: "In OPTIMAL, operators only acted on IVUS findings in about 30% of cases — so IVUS wasn't really used." But let's be fair here. A diagnostic tool can't do anything by itself. It depends entirely on how we react to what it shows us. And saying that operators "didn't act" in 70% of cases assumes there was something to act on. We don't actually know that. Maybe the result was already good. Maybe the IVUS confirmed what the operator had already achieved by angiography alone. And if that's the case, it doesn't indict the tool or the trial — it tells you something important about operator quality. These weren't operators ignoring IVUS. These were operators who were already so good that IVUS had nothing left to add.
Now, here's the part that I think nobody really wants to say out loud: maybe IVUS already won. Not by proving superiority in a trial — but by making us better operators over the past decade.
Look at the post-dilation rates in the angiography arm across the major IVUS trials: ULTIMATE 57%, RENOVATE 75%, IVUS-CHIP 84.5%, OPTIMAL 96%. Look at that progression. Operators who've used IVUS routinely for years have internalized everything it taught them — sizing, post-dilation, POT, landing zone selection. When they get randomized to the angiography arm, they turn off the screen, but they don't turn off the IVUS-calibrated brain. POT in 85% of cases. Systematic post-dilation. Aggressive sizing. The control arm in these trials isn't naive angiography. It's IVUS without IVUS.
So the real comparison isn't imaging vs no imaging. It's formal IVUS vs the knowledge that IVUS has already embedded into how we practice. And when the gap between those two narrows to nothing, the incremental benefit of the screen disappears. That's not a failure. If anything, that's graduation.
To be clear: this does NOT mean IVUS is useless, and it certainly doesn't mean you should stop using it. What it does mean is that in expert European centers — with operators who've spent years calibrating their eyes with imaging — the marginal gain of formal IVUS guidance over their IVUS-informed angiography is effectively zero.
One thing I'd genuinely like to see from both trials: the same analysis ULTIMATE did — outcomes in patients who actually achieved optimization criteria vs those who didn't. In ULTIMATE, that landmark analysis showed TVF of 4.2% vs 9.2% (HR 0.44). That was the strongest argument we had that when IVUS-guided optimization is truly achieved, it works. If IVUS-CHIP and OPTIMAL show the same pattern, the conversation changes entirely: the problem isn't IVUS — it's that we can't implement it fully in half the patients. And if they don't show that pattern, we need to accept that too.
But here's the pill I think we all need to swallow, myself included: we can't keep invoking "optimization failure" only when results disappoint us. 53% in ULTIMATE = proof IVUS works. 48% in IVUS-CHIP = proof the trial was flawed. That's not how science works. That's narrative fitting. And we're better than that.
#CardiologyX #IVUS #PCI #OPTIMAL #CHIPIVUS #ACC26
IVUS or Angiography Guidance for Percutaneous Coronary Intervention in Complex Coronary Bifurcation Lesions: The DKCRUSH VIII Randomized Clinical Trial | JACC https://t.co/KYDU2jg4tw
IVUS or Angiography Guidance for Percutaneous Coronary Intervention in Complex Coronary Bifurcation Lesions: The DKCRUSH VIII Randomized Clinical Trial | JACC https://t.co/KYDU2jg4tw
@DrChuckSimonton We know unloading improves perfusion
This wasn’t a trial designed to evaluate its role in CS. It was designed to evaluate unloading in anterior MIs before revascularization w an arbitrary 30 minute delay. Would simultaneous use have made a difference? ie revasc + Impella?
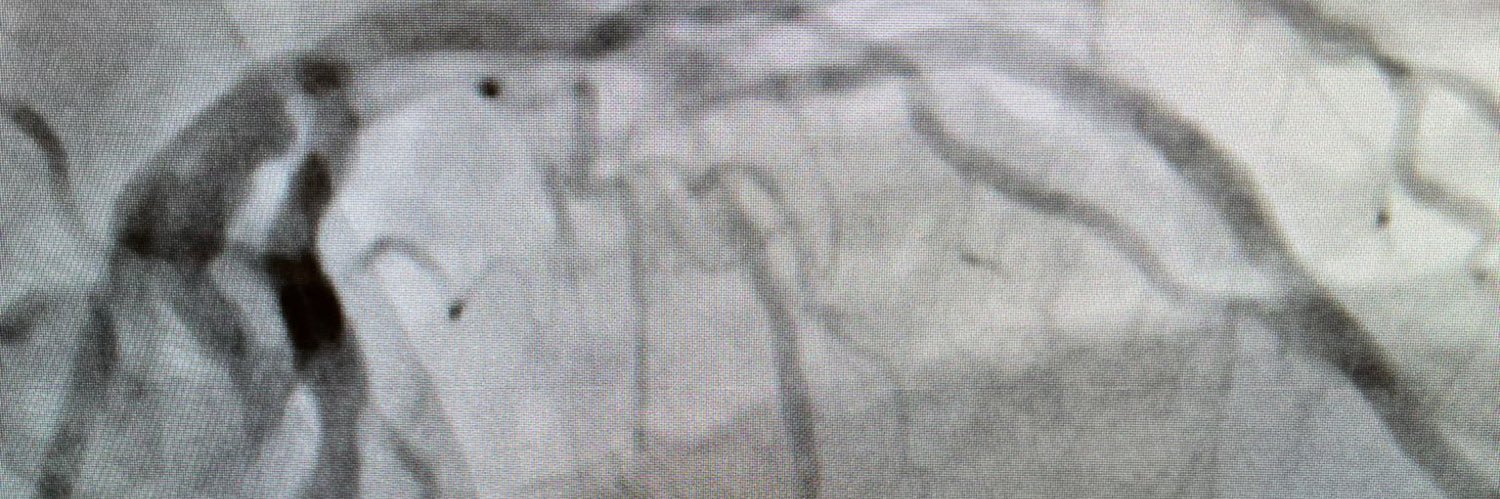
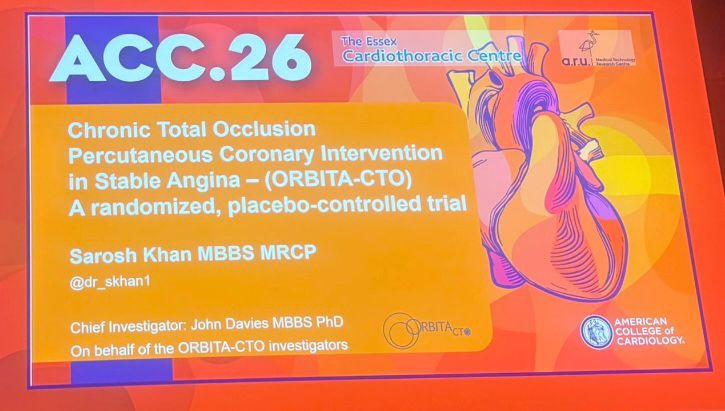
1/16 🧵 ORBITA-CTO: The first randomized, placebo-controlled trial of CTO PCI.
📰 Published in JACC, presented at #ACC26.
🔬 Finally, sham-controlled evidence for what we do in the cath lab every day.
One of the best designed studies I have ever seen!
A biostatistical deep dive. Let's go. 👇
We give oral anticoagulants in patients with AF because it lowers ischemic stroke risk.
If LAAO devices want to be alternatives to anticoagulation one of the key questions MUST be “what does the device do to the ischemic stroke risk?”
#ACC26
@DFCapodanno I know it’s a completely minute detail in face of this innovative outstanding procedure.. but did you plan to follow up or close the LAD-RV fistula that was created?!
And congratulations! 👏🏻 👏🏻 👏🏻
#IC Daily Read!
10.1016/j.jcin.2025.07.024
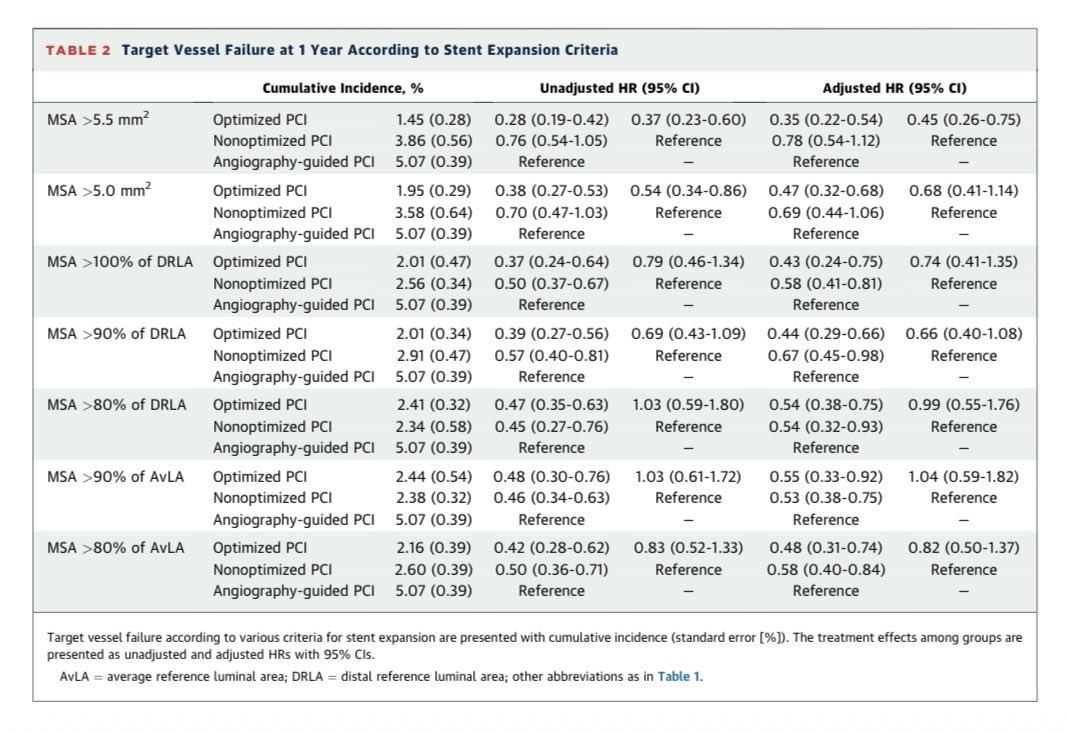
Validation of Intravascular Ultrasound–
Defined Optimal Stent Expansion Criteria
for Favorable 1-Year Clinical Outcomes: An Individual Patient Data Meta-Analysis of IVUS-XPL,
ULTIMATE and IVUS-ACS Randomized Trials.
Post-PCI stent expansion meeting an absolute criterion of MSA >5.5 mm 2 was associated with the
most favorable clinical outcomes.
Re “Our intent here is
not to downplay the importance of all-cause mortality, but rather to call out the false premise that all-
cause mortality is immune to type II error if the follow-up is long enough.”
-Isn’t that how STITCHES won?
-How about the crystal clear KM curve showing superiority of IVI-guided PCI with continuous separation over years?!
-Moreover, we as Interventionists know the value of ACB in diffuse disease.. but for some reason most of these young patients we refer end up with only ONE arterial graft, and come back in 5-10 years with no revascularization options!
Re “Our intent here is
not to downplay the importance of all-cause mortality, but rather to call out the false premise that all-
cause mortality is immune to type II error if the follow-up is long enough.”
-Isn’t that how STITCHES won?
-How about the crystal clear KM curve showing superiority of IVI-guided PCI with continuous separation over years?!
-Moreover, we as Interventionists know the value of ACB in diffuse disease.. but for some reason most of these young patients we refer end up with only ONE arterial graft, and come back in 5-10 years with no revascularization options!
#IC Daily read!
Evidence-Based Practices in the Cardiac Catheterization Laboratory: Invasive Epicardial Coronary Physiologic Assessment: A Scientific Statement From the American Heart Association | Circulation https://t.co/rbV2MwNkJl