Grab some coffee and come chat with me over at Subtack, where I talk stocks, economy, macro, and what I am seeing in the markets--> https://t.co/9ENlm6OO3Y
This morning: ECB hiked (first since 2023).
Next week: Fed expected to hold (~98% odds), at Warsh's first meeting.
One of them is rerunning a famous mistake.
Full breakdown + what I'm watching: https://t.co/JHW0oTC3jI
(5/5)
Inflation just printed 4.2% — hottest in 3 years.
Strip out energy: 2.9%.
Core CPI came in BELOW forecasts.
Same report. Two different economies. The difference is one barrel of crude. 🧵
(1/5)
SpaceX’s IPO is going to be fun to watch. It’s a giant sales pitch to the AI companies that want to go public soon.
The pitch is not the IPO itself. The pitch is whether the underwriter’s trading desk can support the price post IPO.
We have a weakening market, summer, the mid-term election cycle, PLUS everyone is waiting to see what the new Fed Chair will say next week.
Wall Street’s trading desks will be busy next week, as they will be pulling out all the tools.
Stocks vs Yield correlations:
The correlation during the first wave of inflation (1972–1975) was only modestly negative (mean -0.17). It took the second wave (1977–1980) to push it to extreme levels (mean -0.32). The market had to learn that inflation was structural, not transitory, before the correlation fully reflected it.
That pattern rhymes with today. CPI re-accelerated from 2.4% in late 2024 to 3.81% in April 2026 (Bureau of Labor Statistics, May 12, 2026). If the market is in the early stages of recognizing a second inflation wave, the 1970s template suggests the negative correlation could persist and deepen before it reverts.
I just published this week’s Signal & Noise report:
https://t.co/yMdCxdhOio
In This Issue:
-What the current market rotation says about the health of the market
-Notable “big picture” charts
-Why NVDA will play an important part in whether we get a summer rally in the stock market
-The ARTAIS Universe and which stocks are passing my screening process
- Full chart pack for this week, covering my opinion on the stocks that pass the screening process
Point and Figure chart is showing Gold miners ($GDX) switching to “X”s. Or, as Tom Dorsey would always say, “The Offense is on the field”.
Gold itself is at an inflection point. If Gold follows GDX, then we should see a breakout higher in Gold prices.
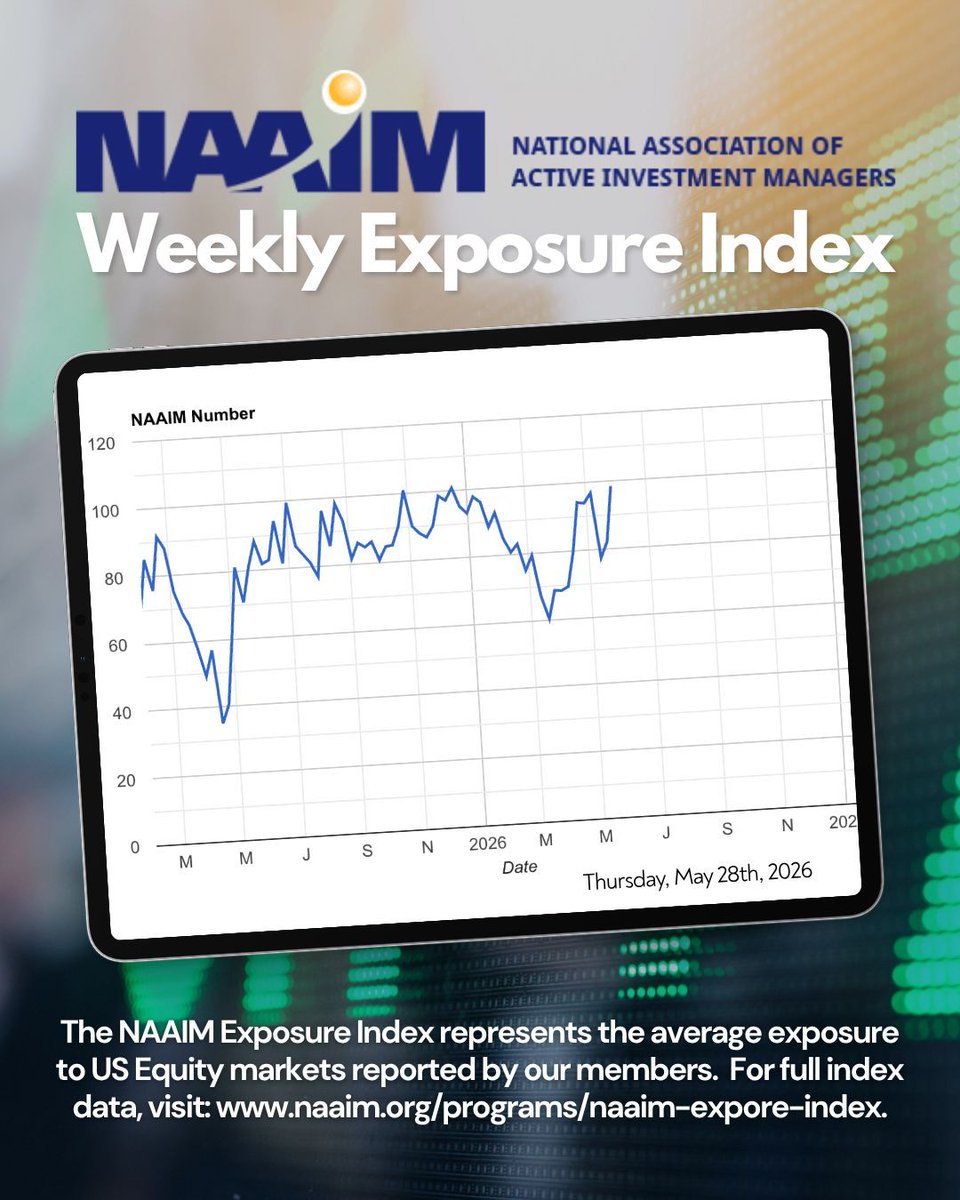
NAAIM Exposure Index (this week): 98.39 (Q1 avg 82.00). Active managers are showing notably high US equity exposure. Full chart & data: https://t.co/Fy7a9yqoVI #NAAIM#NAAIMExposureIndex
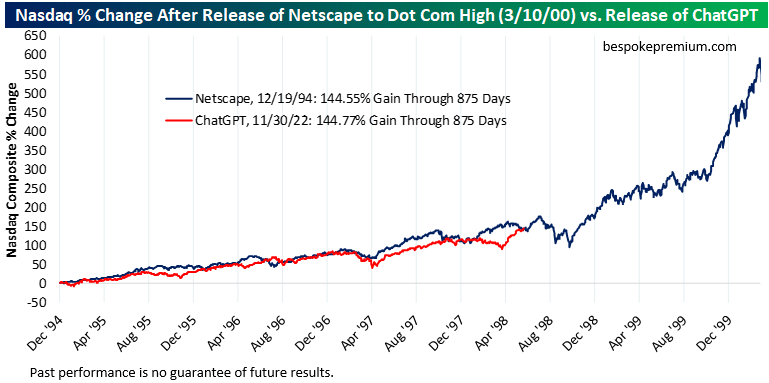
UPDATE:
Nasdaq at 875 trading days after the release of Netscape on 12/19/94: +144.55%.
Nasdaq at 875 trading days after the release of ChatGPT on 11/30/22: +144.77%.
Past performance is no guarantee of future results!