Think tank created and supported by Silicon Valley's major sectors. Providing regional data, research, and analysis through the Institute for Regional Studies.
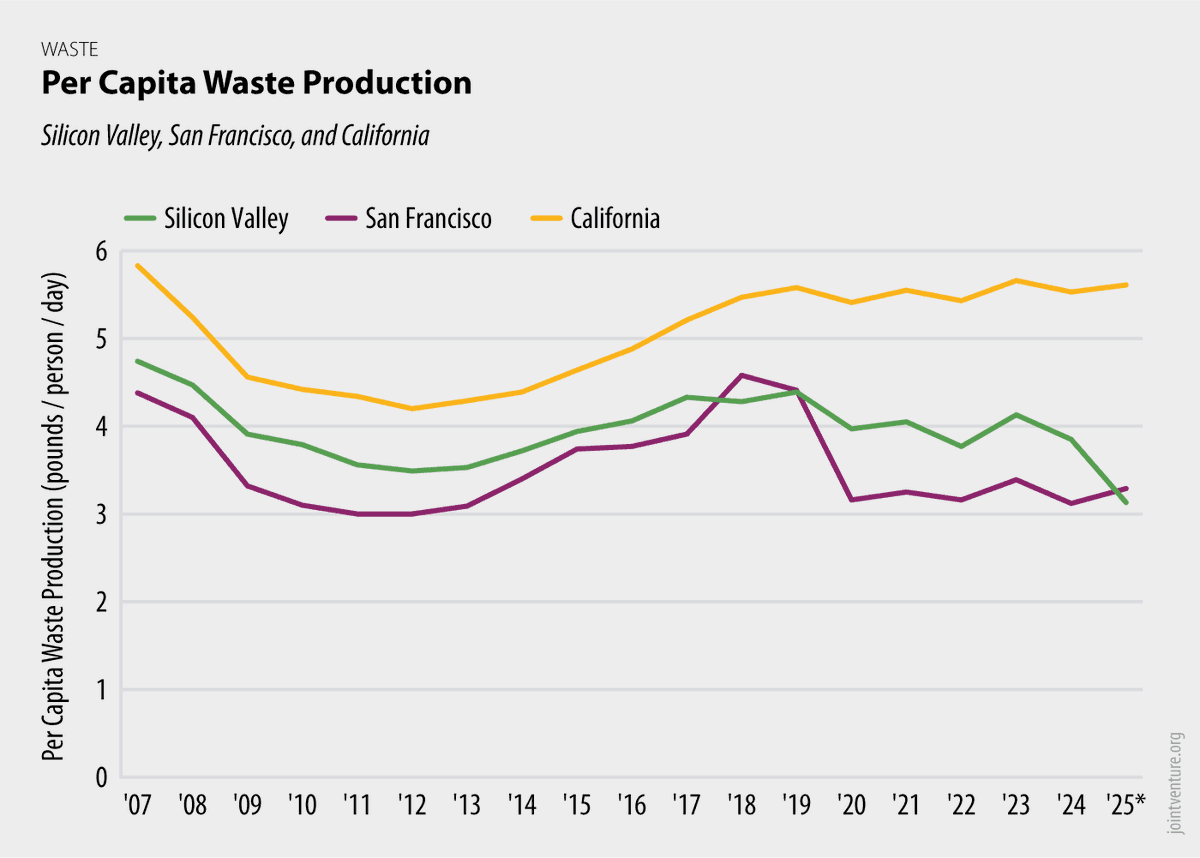
Silicon Valley residents produced just 3.1 pounds of waste per person per day in 2025, the lowest level on record since 1995. Per capita waste production was about 5% lower than San Francisco and 44% lower than the statewide average.
Dig into the data: https://t.co/Z3vNu1uCBm
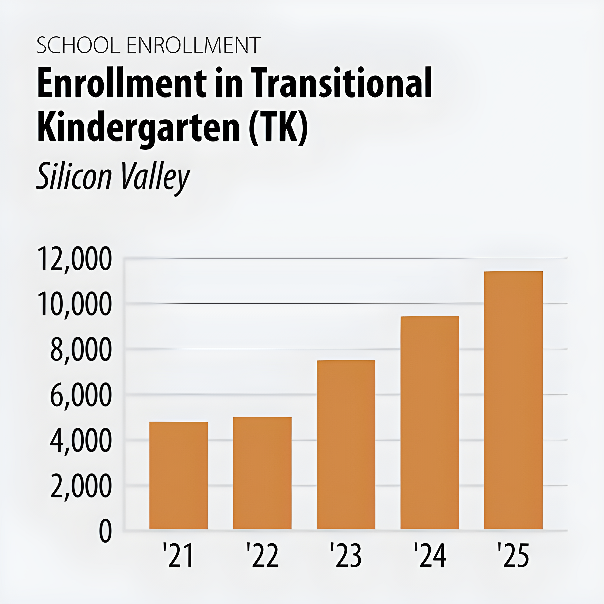
Enrollment in Transitional Kindergarten (TK) more than doubled in Silicon Valley between 2021 and 2025, rising to more than 11,000 students following the rollout of California’s universal TK program. In 2025, 31% of TK students were socioeconomically disadvantaged.
Net foreign migration to Silicon Valley fell 42% in 2025 from the previous year, but remained positive and well above pandemic-era lows. Net domestic migration remained negative, with nearly 20,000 more residents leaving the region than moving in.
https://t.co/v4AUvjjjRG
Private company valuations in Silicon Valley and San Francisco continue to rise. The region was home to 312 unicorns and 27 decacorns at the end of 2025. Its unicorn count has nearly tripled over the past 5 years and the region now accounts for roughly half of all U.S. unicorns.
Greenhouse gas emissions in Silicon Valley fell an estimated 29% between 2019 and 2025. Cleaner electricity generation was the largest driver of the decline, while transportation-related emissions dropped an estimated 18% due to reduced driving and increased EV adoption.
Transportation costs in the Bay Area have risen faster than overall inflation since 2021. The cost of basic transportation needs for a Silicon Valley family of four reached nearly $9,900 annually in 2025, consuming up to 14% of gross income in a minimum-wage household.
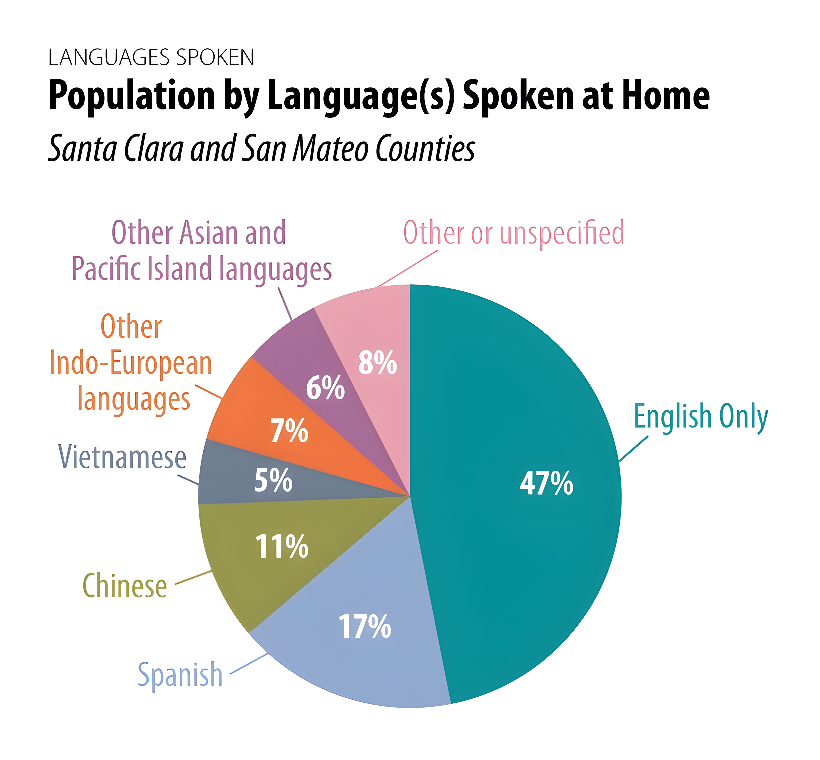
Silicon Valley is linguistically diverse, with more than half of residents (53%) speaking a language other than English at home. The most common languages other than English spoken in Silicon Valley households include Spanish (17%), Chinese (11%), and Vietnamese (5%).
Women make up 46% of Silicon Valley’s civilian workforce, but only 40% of employees at the region’s 20 largest technology employers. Women are disproportionately underrepresented in leadership roles (33%) and technical roles (31%) at these major tech companies.
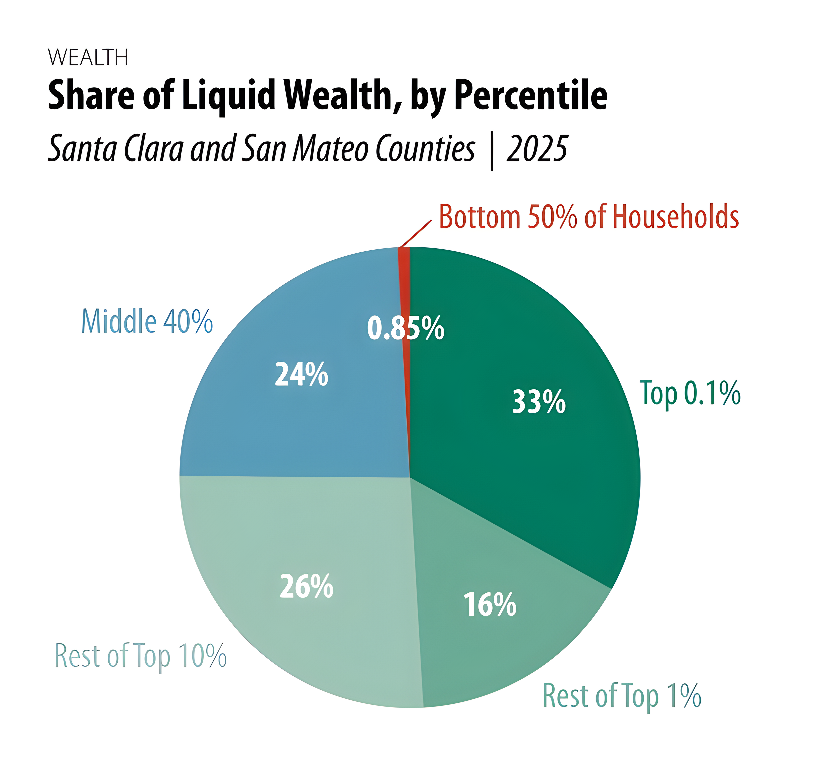
Silicon Valley households held an estimated $1.17 trillion in wealth in 2025 — an average of $1.3 million per household. The top 10% held 75% of the region’s wealth, up 5 percentage points since 2023, while the bottom half held less than 1%.
See more: https://t.co/KBFtbPT022
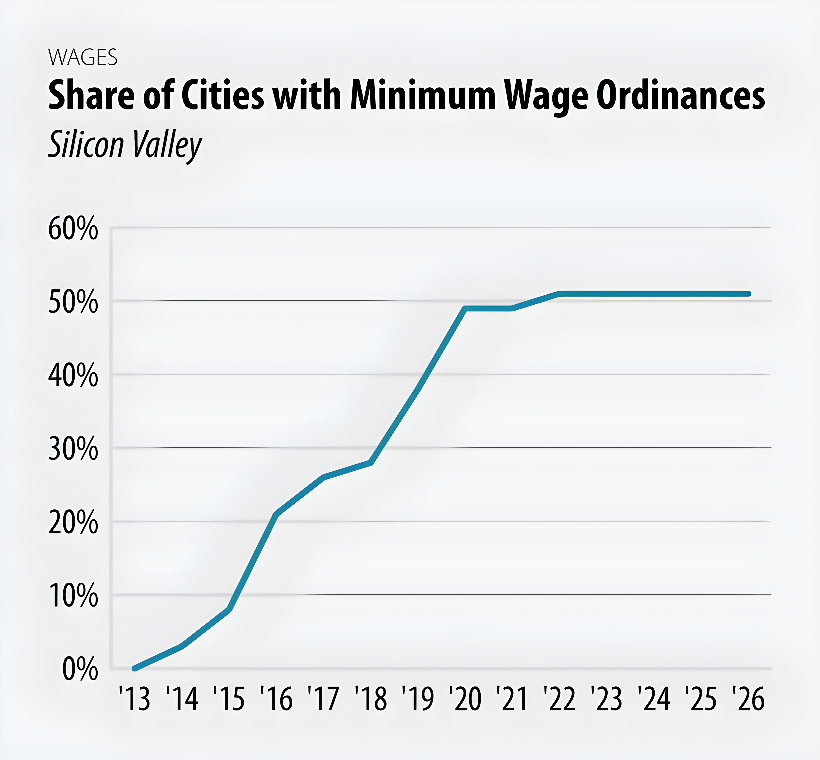
More than half of Silicon Valley’s cities have set minimum wages above California’s $16.90, up from no cities in 2013. These wages range from $17.50 per hour in Daly City to $19.70 in Mountain View. Approximately 11% of the region’s employed population relies on a minimum wage.
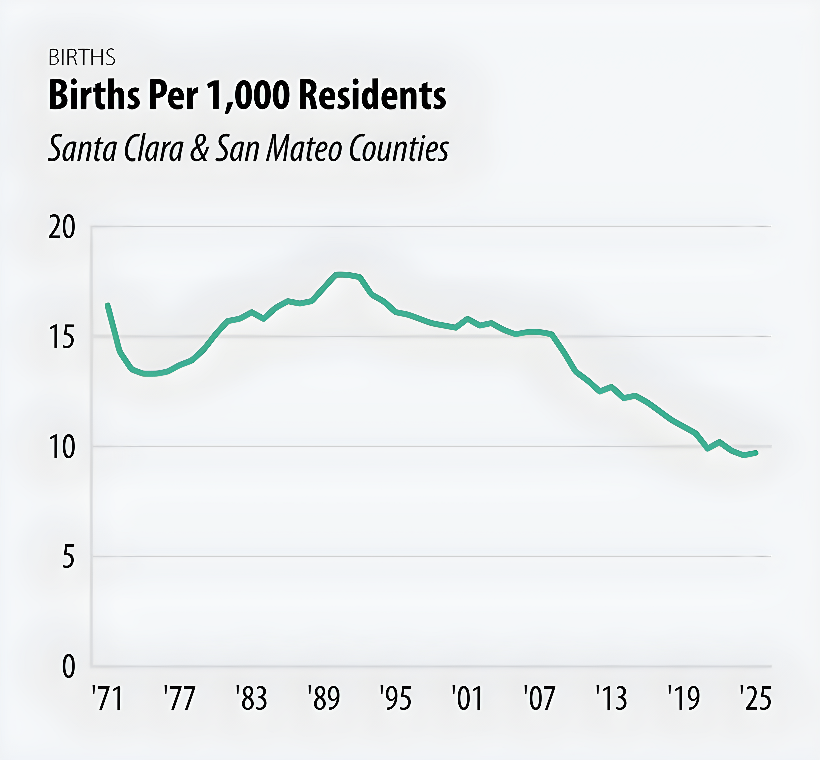
The birth rate in Silicon Valley has declined steadily over the past several decades, falling 46% from a high of 17.8 births per 1,000 residents in 1990. Just under 26,000 children were born in Silicon Valley in 2025 — a rate of fewer than 10 per 1,000 residents.
Silicon Valley and San Francisco companies completed 15 initial public offerings in 2025, raising a collective $7.1 billion and accounting for 7% of all U.S. IPOs. Regional IPOs climbed through the late 2010s and peaked in 2021 at nearly 50, then fell sharply.
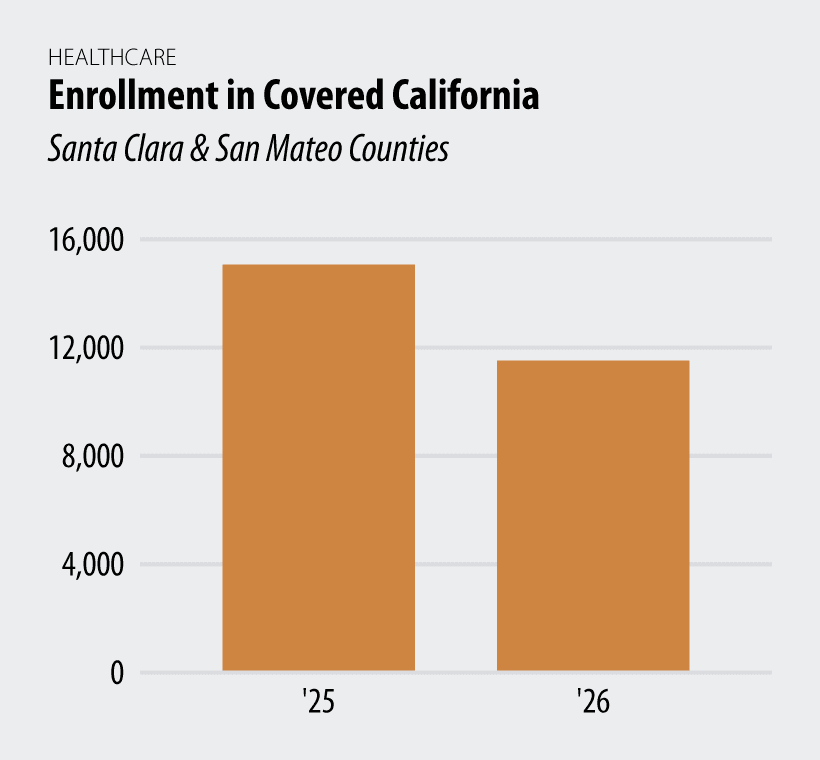
Health insurance enrollment among Silicon Valley residents via Covered California — the state’s health insurance marketplace — fell 31% from last year, triggered by federal policy changes affecting eligibility, subsidies, and overall costs. Enrollment fell 45% across California.
Home game attendance across Silicon Valley’s major collegiate and professional teams reached 2019 levels last year, capping a multi-year recovery driven largely by the San Francisco Giants. However, collegiate attendance remains below pre-pandemic levels.
https://t.co/sEXYtxmXMd
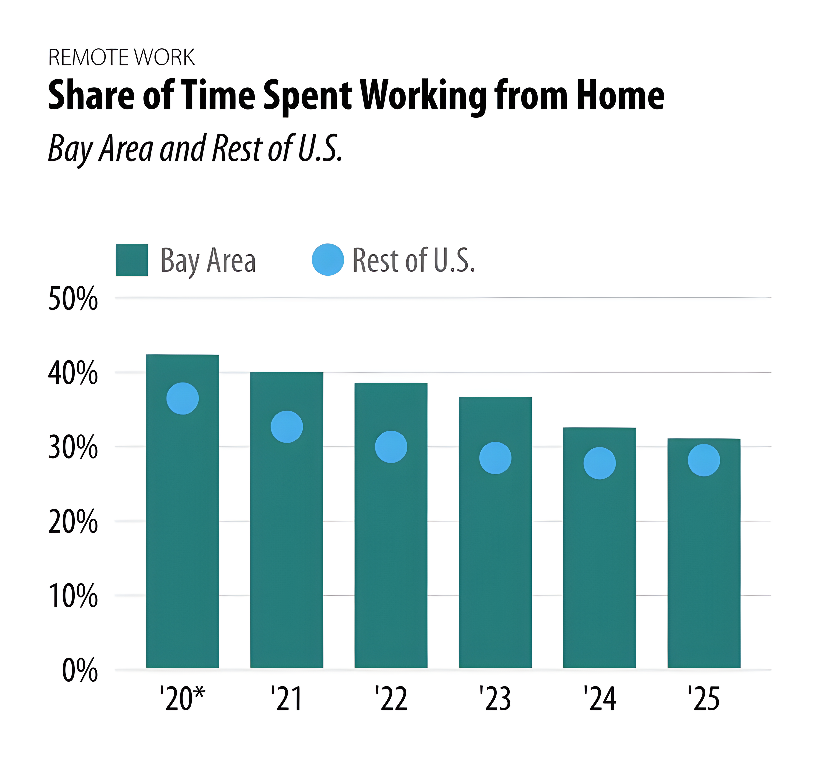
The average Bay Area employee worked from home nearly one-third of their time last year (about 1.5 days of a five-day workweek). Rates of remote work in the Bay Area had been higher than in other major U.S. regions since the pandemic, but the gap narrowed significantly in 2025.
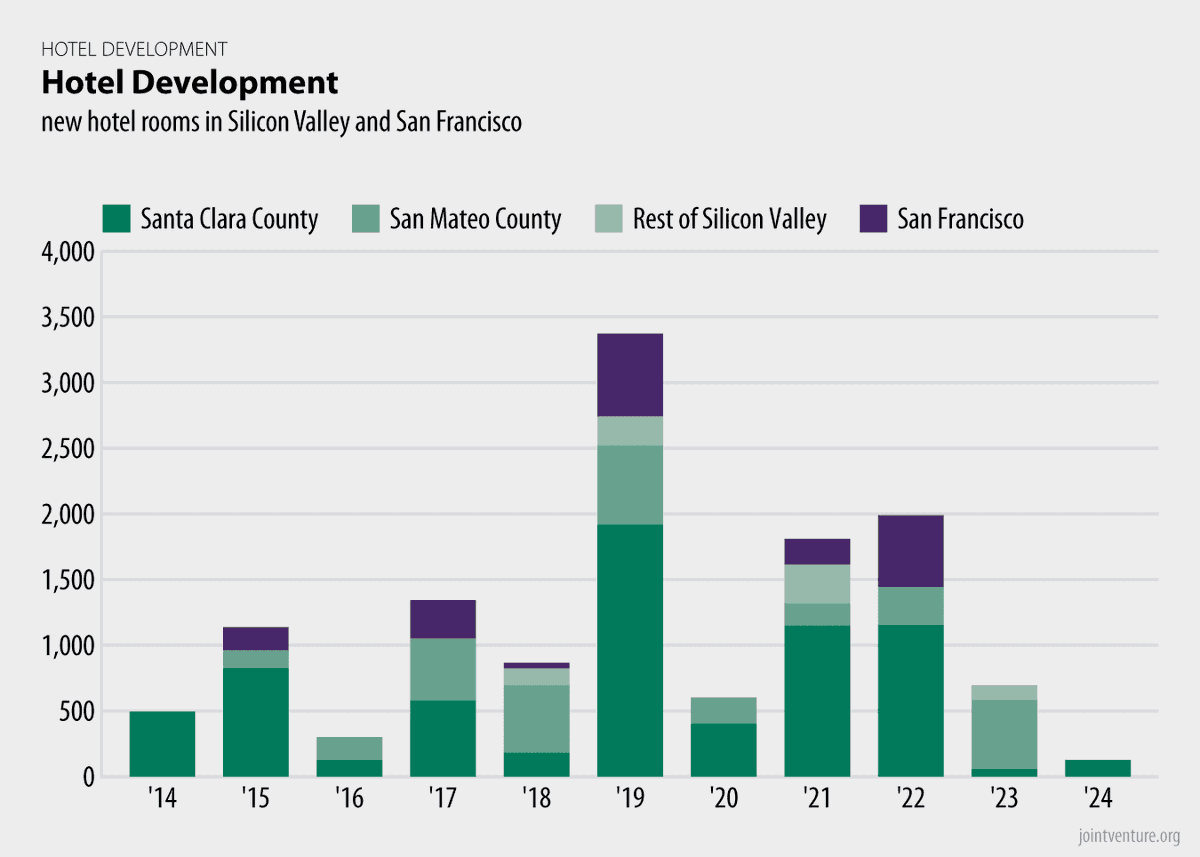
Silicon Valley added a record 3,372 hotel rooms in 2019, but development slowed sharply by 2024, with just 127 new rooms completed. Only one new hotel opened in 2024, down from five in 2023 and nine in 2022.
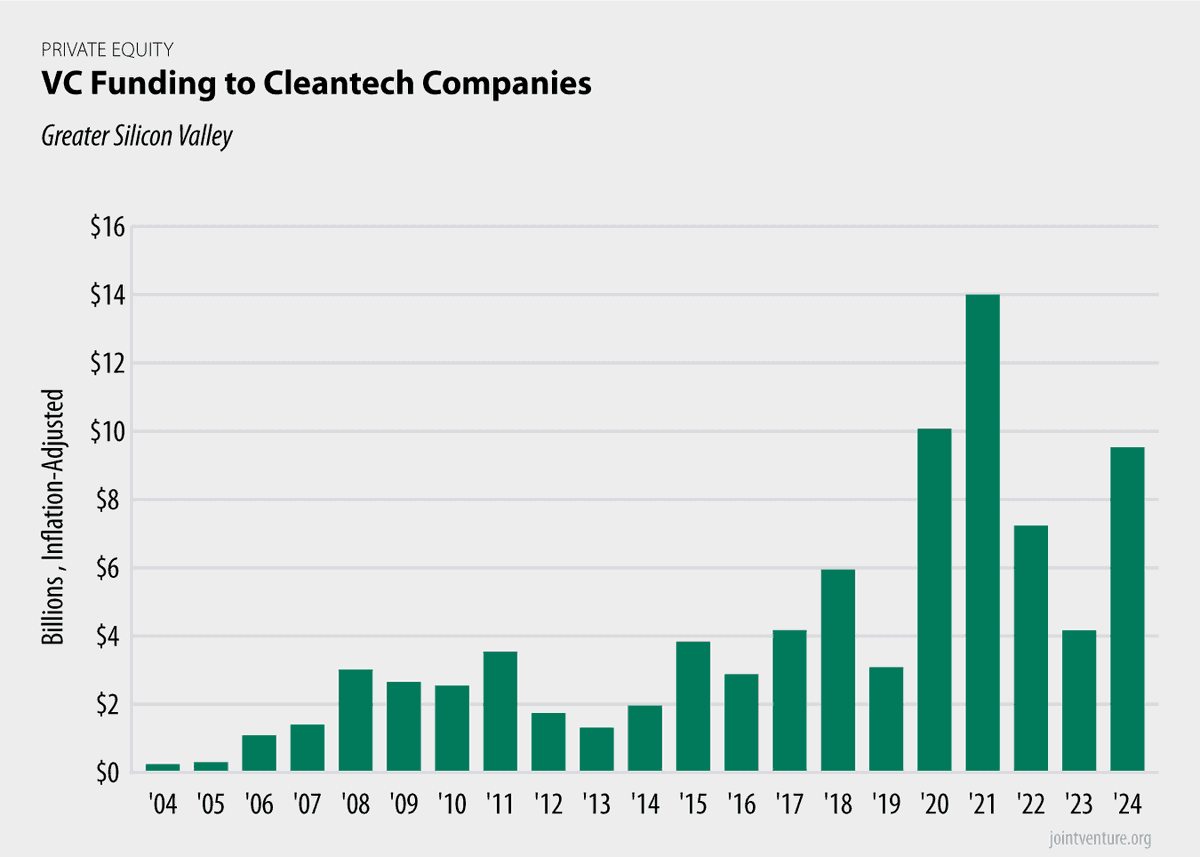
Venture capital funding for Silicon Valley cleantech — technology that reduces environmental impact — peaked in 2021 at nearly $14B, a fourfold increase over 2011 and 40 times more than 2001. In 2024, cleantech startups raised $9.5B across 134 disclosed deals.
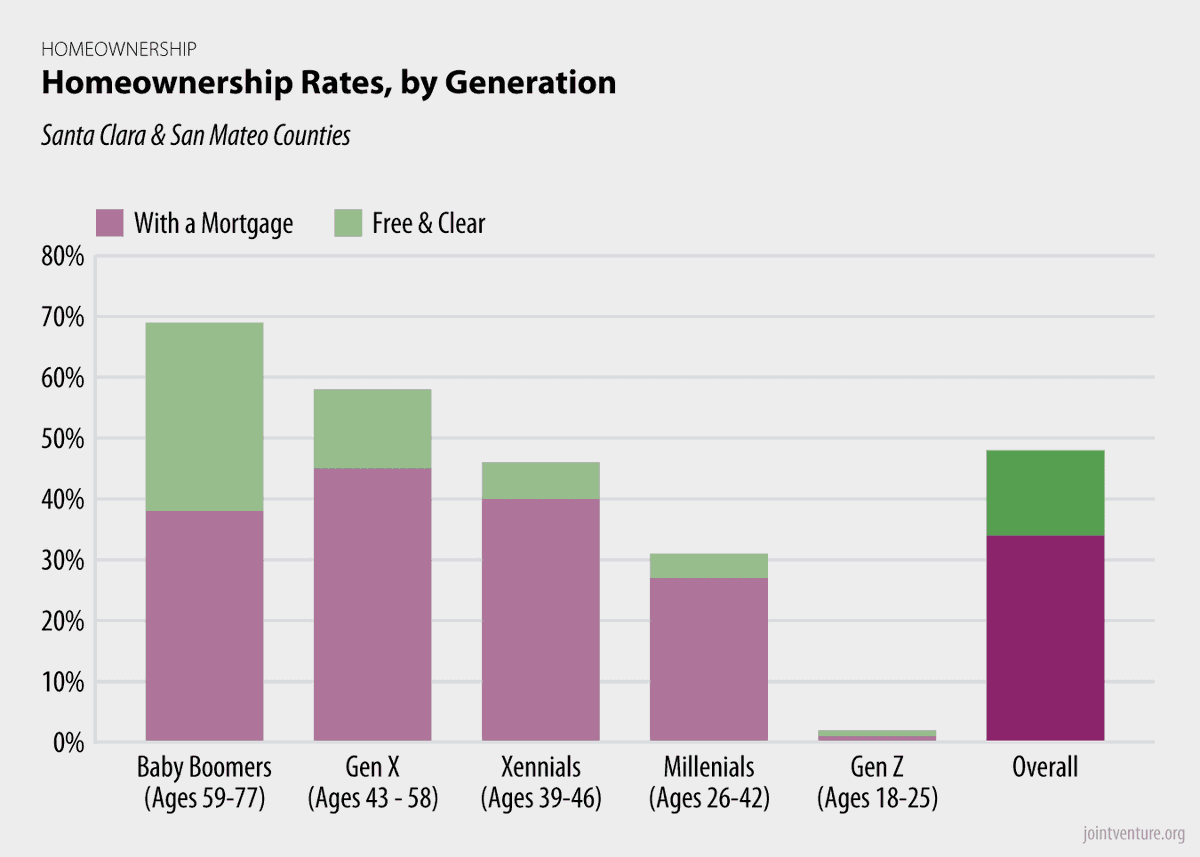
Homeownership in Silicon Valley varies sharply by generation. Baby Boomers are the most likely to own their homes (68%); they are also the most likely to own without mortgages (45%). Less than one quarter of Generation X and 13% of Millennials own their homes outright.
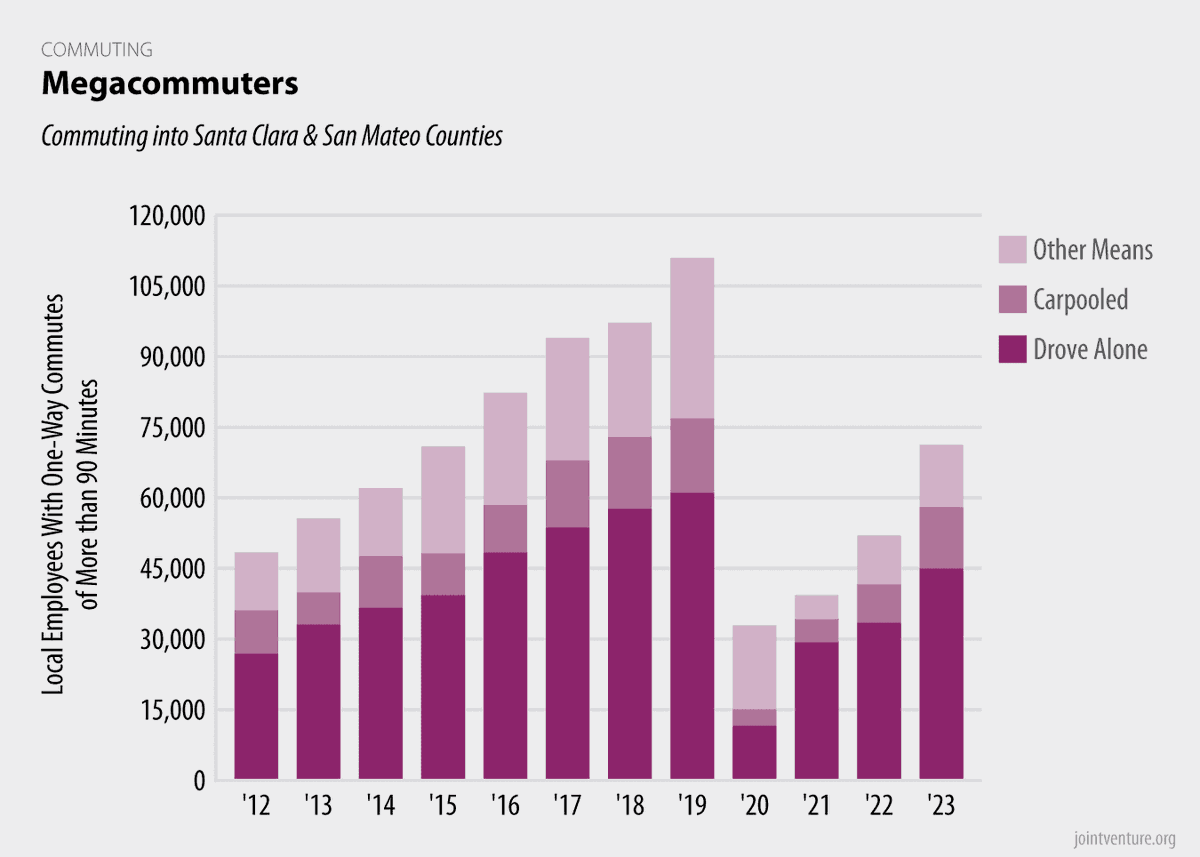
In 2023, more than 70,000 Silicon Valley commuters spent more than three hours a day traveling to and from work. Of these, 63% drove alone, 18% carpooled, and 16% used transit. Megacommuting has risen steadily since 2020, but 2023 levels remained well below pre-pandemic levels.
One in six public high school students (16%) in Silicon Valley were chronically absent in 2024, meaning they missed more than 10% of expected school days. While this rate is lower than the previous year (19%), it remains 6 percentage points higher than pre-pandemic absenteeism.