S&P 500 plunged 2.64% (-200.57 pts) to 7,383.74. Dow dropped 1.35% (-695.15 pts) to 50,866.78. Nasdaq cratered 4.18% (-1,121.53 pts) to 25,709.43. Russell 2000 tumbled 3.47% (-101.83 pts) to 2,833.50.
VIX exploded 37.36% to 21.15, its highest level since March.
U.S. stock indexes ended sharply lower on June 5, 2026, as a jobs report that more than doubled forecasts triggered a brutal "good news is bad news" selloff. Nasdaq suffered its worst single day since February, and the VIX spiked 37% in one of the most volatile closes of the year
🚨MARKET MOVES YOU CAN’T IGNORE
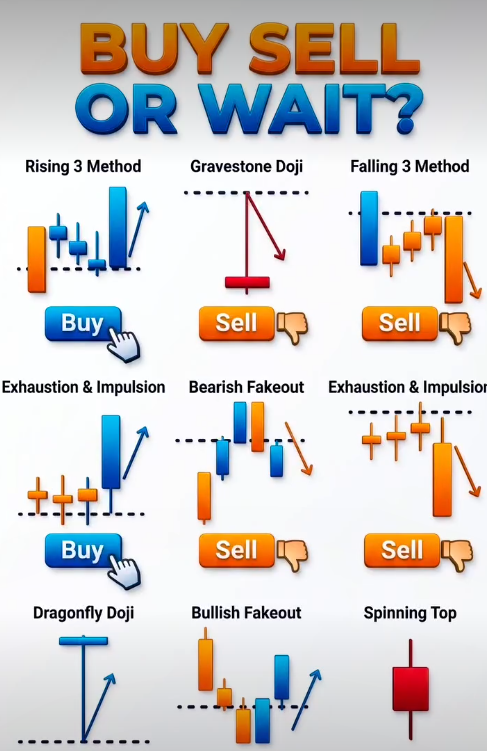
✅ Price action tells the truth before indicators do
✅ Candlestick patterns reveal momentum shifts early
✅ Reversal signals help you avoid bad trades
✅ Continuation patterns guide trend‑following entries
✅ Support & resistance levels shape high‑probability setups
FIBONACCI LEVELS — COMPLETE GUIDE
What is Fibonacci?
Fibonacci is a mathematical sequence.
In trading, it is used to identify potential support and resistance levels.
Important Fibonacci ratios:
0.236
0.382
0.500
0.618 ⭐
0.786
MOVING AVERAGES STRATEGY:
1. Understand the Basics What is a Moving Average (MA)? A moving average smooth's price data to identify trends.
Types:
1.Simple MA (SMA) and Exponential MA (EMA).
2. Types of Moving Averages Simple Moving Average (SMA): Average prices over a specific time.
Less responsive to recent price changes.
Exponential Moving Average (EMA): Gives more weight to recent prices. More sensitive to short-term price movement.
3. Common Time Periods Short-Term: 5, 10, 20-day MAs Medium-Term: 50-day MA Long-Term: 100-day, 200-day MA
4. Key Strategies
a) Golden Cross 50-day MA crosses above 200-day MA → Bullish signal (Buy)
b) Death Cross 50-day MA crosses below 200-day MA → Bearish signal (Sell)
c) MA Crossover Strategy Buy when short-term MA crosses above long-term MA. Sell when short-term MA crosses below long-term MA.
d) Support & Resistance MAs act as dynamic support during uptrends and resistance during downtrends.
e) Trend Confirmation Price above MA = Uptrend Price below MA = Downtrend
5. Advanced Techniques Double/Triple MA Strategies: Use combinations like 20-50-200 EMAs for refined signals. MA Envelope/Bands: Measure volatility by plotting % bands above/below an MA. Confluence Zones: Look for overlap between MA signals and other indicators like RSI, MACD.
6. Timeframe Considerations Use different MAs based on trading style: Scalping: 5-min or 15-min with 5/20 EMAs Day Trading: 1H to 4H with 20/50/100 MAs Swing/Position Trading: Daily/Weekly charts with 50/200 MAs
7. Risk Management Use stop-loss below moving average. Combine with volume and confirmation indicators. Never rely on MAs alone – avoid false breakouts.
8. Backtesting and Optimization Test different MA periods on historical data. Adjust for asset volatility and trading style.
Most traders search for a better strategy.
I focus on a better process.
30–60 minutes per day.
30 minutes per week.
The same routine.
The same setups.
The same rules.
That's how consistency is built.
Here's my complete trading process 👇
S&P 500 gained 0.41% (+30.63 pts) to 7,584.31. Dow surged 1.73% (+874.86 pts) to 51,561.93, just shy of its all-time high. Nasdaq slipped 0.09% (-23.02 pts) to 26,830.96. Russell 2000 outperformed, jumping 1.58% (+45.82 pts) to 2,939.33. VIX dropped 5.17% to 15.23.
U.S. stock indexes ended mixed on June 4, 2026, as a massive Dow rebound driven by a powerful rotation into value and industrial stocks offset a sharp tech selloff triggered by disappointing earnings from Broadcom and CrowdStrike.
READING PRICE ACTION LIKE A PRO
✅ Spot the fakeout before the crowd reacts
✅ Wait for the trendline break to confirm weakness
✅ Use the retest as your clean entry trigger
✅ Follow the shift in market structure, not emotions
✅ Ride the reversal move with confidence and disciplineSave this post for your next chart review.