Dear Self, thank you for being authentic, resilient, and uniquely awesome. Here's🥂 to another year of growth, learning, and celebration. I'm excited to mark another 365 days around the sun.
Happy Birthday to me🎉🎂
@3MTTNigeria Tried to apply but after taking the technical test, it doesn’t tick done, rather it takes you back to retake the test again, despite passing the initial one
Closing the chapter on 2024 and getting ready to write a new one. Cheers to a fresh start, new opportunities, and an extremely incredible 2025🥰💃🏻
#ThankYou2024 #2025
As 2024 ends, remember that your worth isn't defined by one year's accomplishments. It's okay to not have crushed your goals or achieved everything you wanted to. Just making it through the year is an achievement in itself. Be easy on yourself and aim towards a greater 2025!!!
Adjusting your lines of code after an error message & seeing it run smoothly leaves you with this feeling of great satisfaction.
Errors aren't failures, remember "Every bug fixed brings you closer to mastery"
I’m loving this baby steps to being perfect
#LearningJourney#python
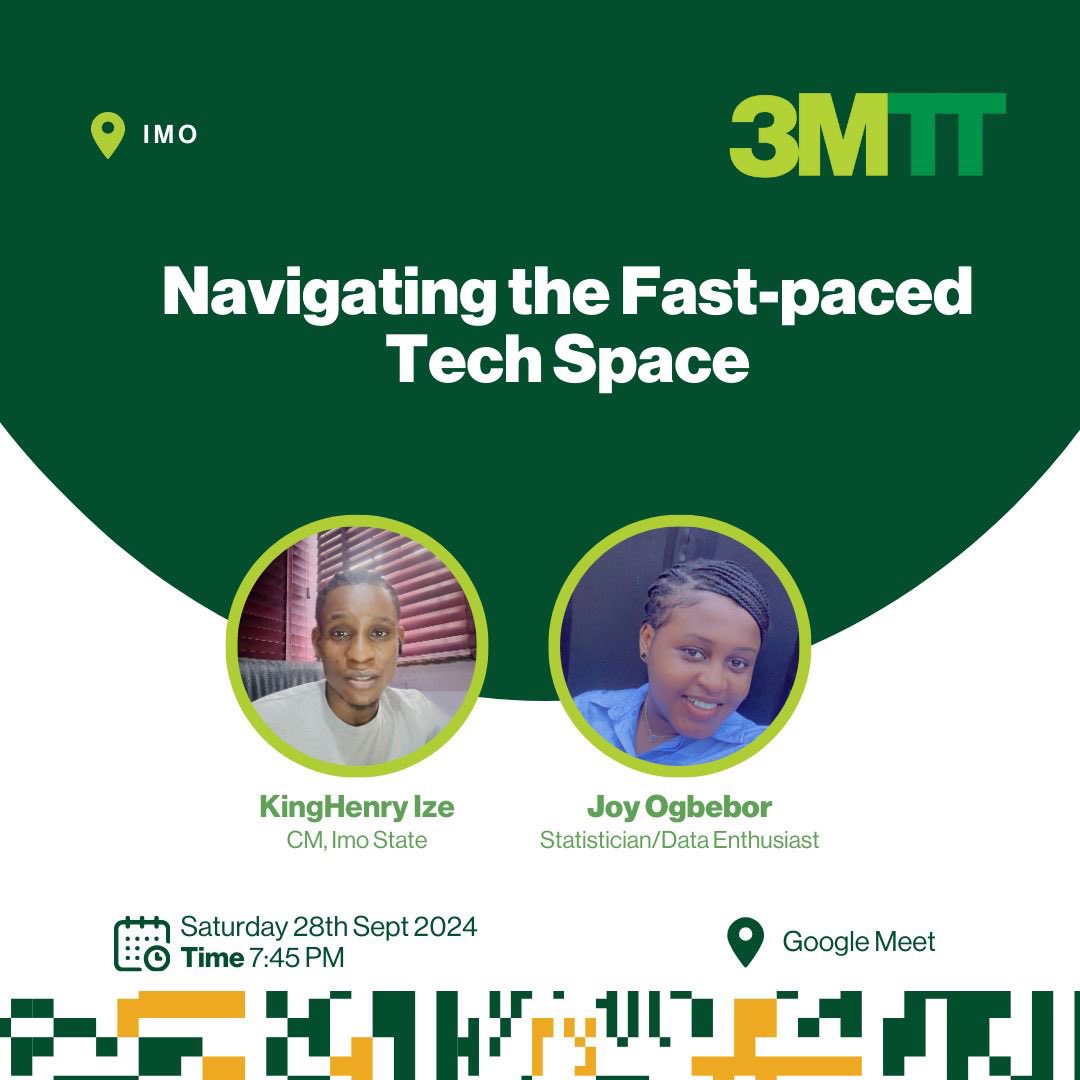
Privileged to connect and speak with the vibrant 3MTT Imo State community in a few minutes! Thanks to the community manager @KingHenrycruz , for this opportunity.
First-time jitters but I’m eager to share. Wish me luck…and of course a stable network 😁
Working with data has taught me;
The importance of objective analysis
The value of evidence-based strategy
And the potential for data-driven innovation.
Data changes everything!
Data-based decision making is UNBEATABLE!
Data is more than just numbers or words,
It’s a game changer for informed decison making
It’s a catalyst for business growth and optimization
It’s a powerful tool for story telling and communication.
@HassanSodiqOlu1@DataKliq Ask yourself questions like;
1. What month do we record high/low sales?
2. Which regions/states/products are performing well/poorly?
3. Are there any surprises or anomalies?
For now, Don't worry about the 'hows', Focus on the insights, not the technicalities.
Dashboard building with PowerBI
Sharing one of the projects from the @DataKliq bootcamp.
Analyzed Adidas sales data to uncover key trends and insights
Key Insights: Sales by State,Sales distribution by method,Monthly sales trend, Annual sales etc
@HassanSodiqOlu1@DataKliq Explore the visuals:
1. Map: Darker areas indicate higher sales regions.
2. Bar charts/Column chart/Pie chart: Compare sales across methods, products, time etc