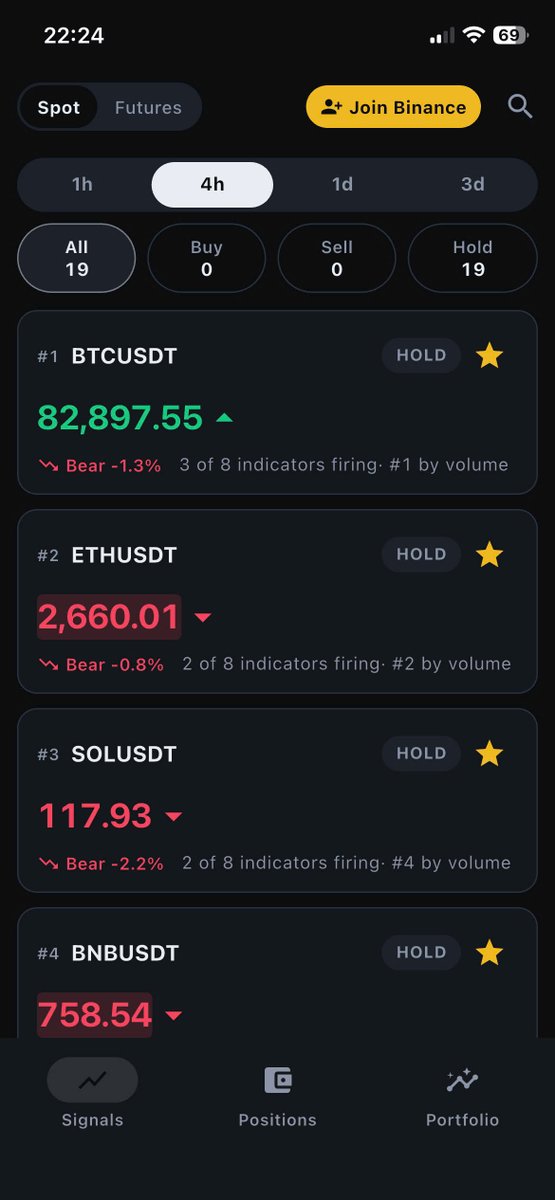
I'm building Swing Signal app: buy/sell signals for the top Binance pairs, with every strategy's hit rate shown next to the call.
No "100% win rate". Just the record, losses included.
I'll post the board here daily. First read: all 10 top pairs are BUY on the 1D.
#trading
US ISM services is out at 14:00 UTC, with $BTC at $85.9K, just under a level it has failed at three times in two weeks: $87K.
If the data sends it back up there, do you buy the fourth test or wait for a daily close above? 👇
Asked from Swing Signal, launching in 8 days
$BTC is out of its 8-day range: $86.8K, +3.7% in 24h, after topping $87.2K in the payrolls hour. September's high was $87.4K.
6 of our top 10 are up. $QNT is the outlier at -10.3%.
The 4H board is still all HOLD, a fifth day.
Board: Swing Signal, on iOS & Android 13 Oct
$BTC ($83.7K): buy zones $83.3K (1D) and $79.2K (3D). Sell zones $86.3K (1D) and $87.4K, September's high (3D).
$ETH (2,693): buy zones 2,670 (1D) and 2,486 (3D). Sell zone near 2,805 on both, also its September high.
Zones scored in Swing Signal, out 13 Oct
Three of our top 10 ran hard in 24h: $QNT +20.9%, $NEAR +9.7%, WLD +8.8%.
None is a daily BUY. On NEAR's 4H chart, 3 strategies say trend up and 1 says stretched, and none of the 3 has a positive record on that chart.
The split, not just a label: Swing Signal, 13 Oct.
Which side has been right on this chart?
The pullback signal hit 52.1% over 447 past calls. The RSI overbought call hit 37.3% over 102. That's why each call in the app shows the split and every strategy's record, not just a BUY or SELL.
How a Swing Signal call is made, using tonight's only daily BUY: $QNT.
8 strategies read each chart, and they ask different questions. Trend ones ask: is price moving with strength? Stretched ones ask: has it run too far from its average?
On QNT's daily chart, 5 of 8 fire:
Trend up (2): ADX 47.7, and a pullback to 44.8% of the up leg.
Stretched (3): RSI 76.5, price 8.1% through its upper Bollinger band, 3.3 ATR above its EMA.
3 stay on hold. Firing isn't agreeing.
Building Swing Signal in public.
It reads the top Binance USDT pairs on 4H, 1D and 3D, and shows each call next to the hit rate of the strategy behind it.
Tonight the 4H board is all HOLD. $BTC is -2.4% at $83.0K and 9 of the top 10 are red. Nothing clean to act on.
Spot $BTC ETFs took in $2.4B last week, the most since October 2025. That turned 2026 net flows positive at +$934M. Friday alone was $134.5M.
BTC sits at $84.8K. Our daily board says HOLD: 1 strategy says trend up (ADX 44), 1 says stretched.
Last 24h across our top 10:
ONDO +20.4%
NEAR +14.5%
XRP +8.2%
ZEC +7.7%
DOGE +6.3%
SOL +6.1%
LTC +4.7%
$ETH +2.6%
$BTC +1.0%
BNB +0.8%
Alts led, BTC lagged. Only NEAR, ONDO and LTC read BUY on our daily board. One big day isn't a trend yet.
Yesterday our daily board was 10 of 10 BUY. After Wednesday's close, all 10 top pairs read HOLD.
$BTC is down 2.2% in 24h at $83.6K, 4.3% under Monday's $87.4K high.
ADX still says trend up on all 10. What faded is the heat: 1 of 10 still has RSI above 70.
$BTC on our 1D board: 3 strategies say trend up, 3 say stretched.
On the 3D: 1 trend up, 3 stretched (RSI 73, 2.35 ATR above its EMA, at the R3 pivot band).
Both still read BUY. Since then BTC slid 2.6% to $84.0K.
$BTC tagged $87.4K, its highest since January.
Our daily board is 10 for 10: every top-10 pair is flashing BUY.
But BTC is also 9% above its 15-day EMA with RSI at 74. Strong trend, stretched price.
Not chasing here. Watching for a pullback or a daily close above $87.4K.
MCKid is inspired by the Vietnamese artist MCK. This collection features the cool monkey kid on the block that everyone loves. 🐵
The MCkid collection is now available on https://t.co/yHjm9OAj7X! 🔥
We will be featuring more artworks soon so make sure to follow us @metagetx! 🤩
More and more brands are entering the #NFT and #Web3 space. Follow us @metagetx as we share with you more tips on how to jump onto this bandwagon! 🎉
#Metagetx is now live! Sign up now at https://t.co/yHjm9OAj7X! 💥
Follow us @metagetx for more!
🔗https://t.co/VFWb2zTBUM