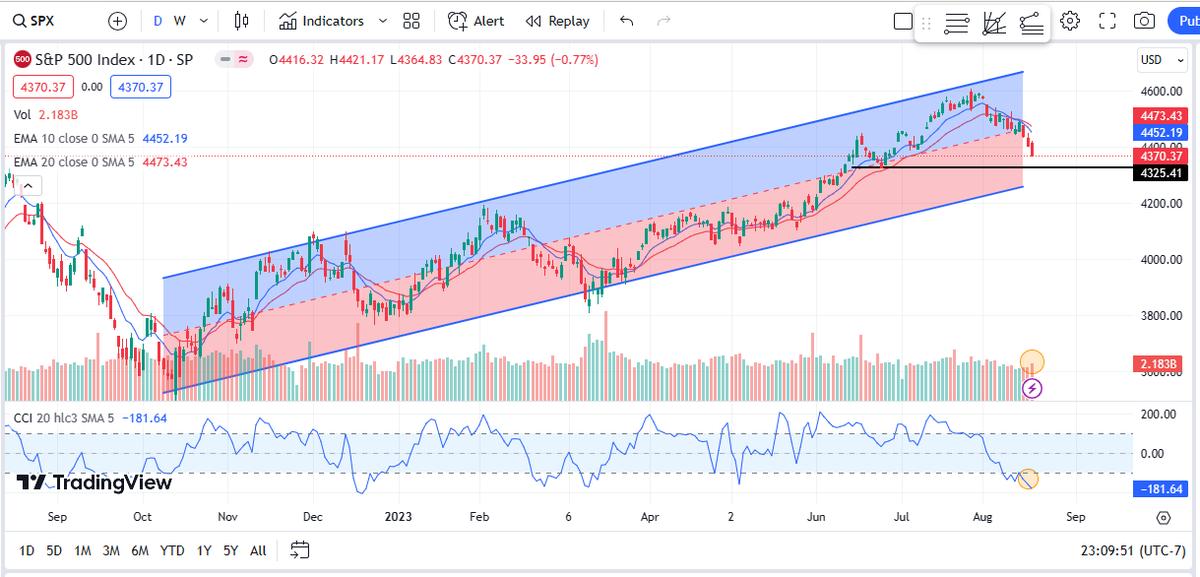
$SPX daily chart , going down in regression trend, todays volume is high with bearish engulfing candle is not good for bulls.
CCI is in oversold region but candle and volume are still favoring bears.
I see support at 4325 and resistance at 4372.
S&P is close to my buy signal , number of stocks in $SPX are above 20 day moving average below 15 is acting as buy signal , right now it is at 18.
$SPX $QQQ $IWM
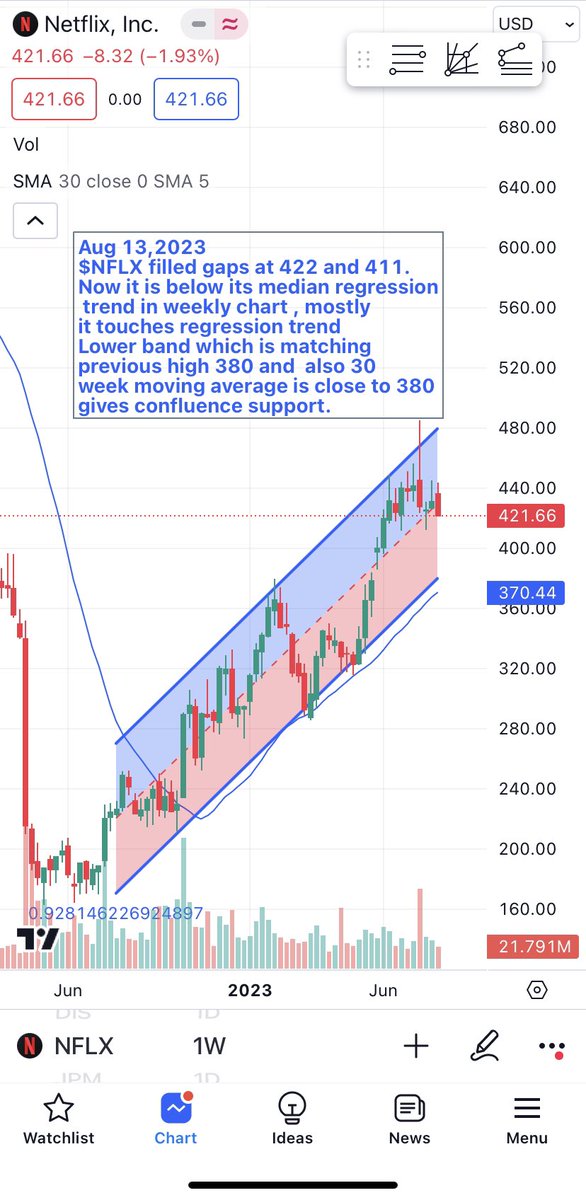
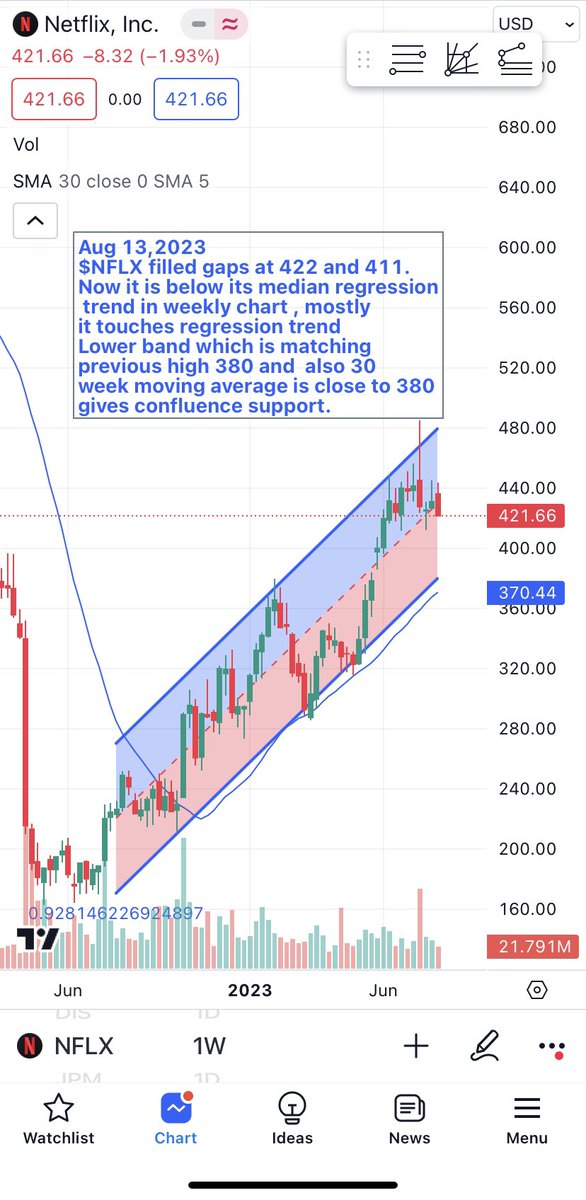
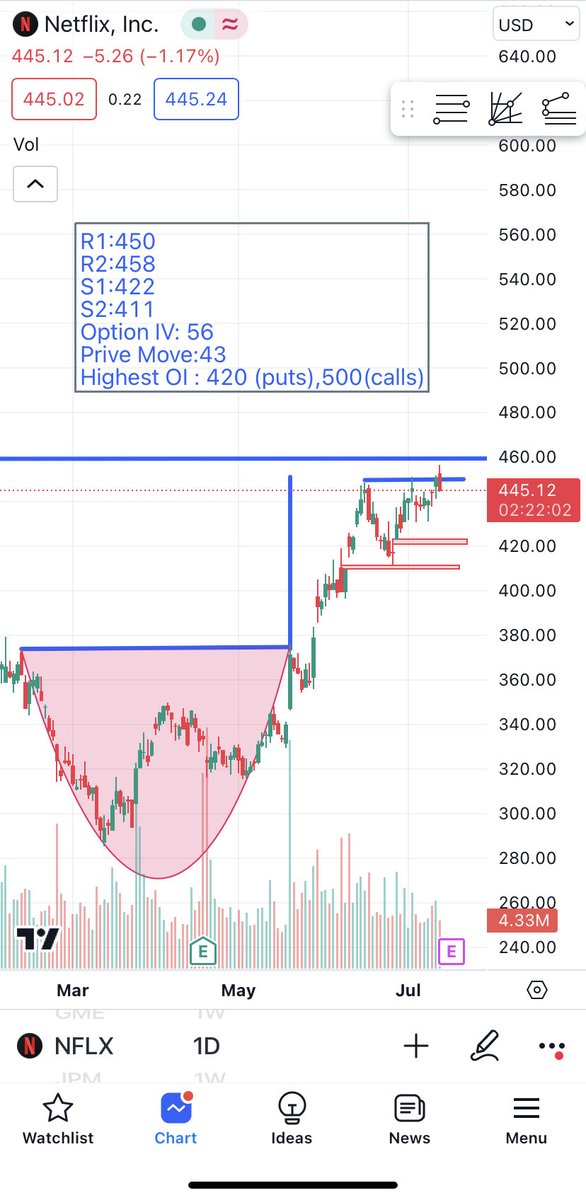
Now $NFLX filled the gap and going to 380 level to touch regression trend lower band which is a 30 weekly moving average and also previous high,all 3 acts as good support
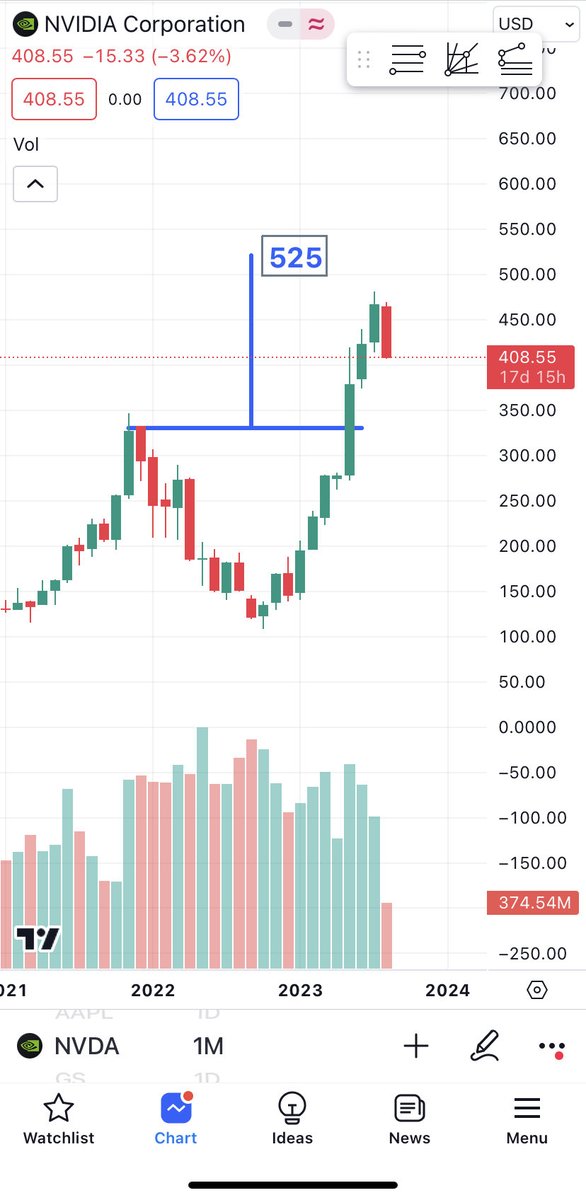
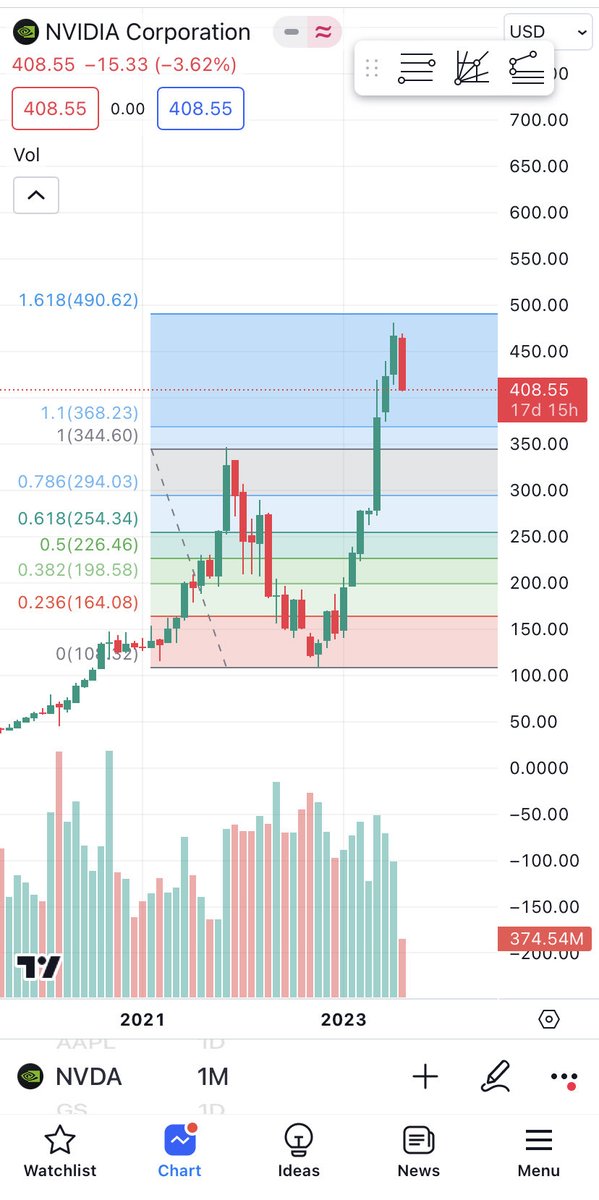
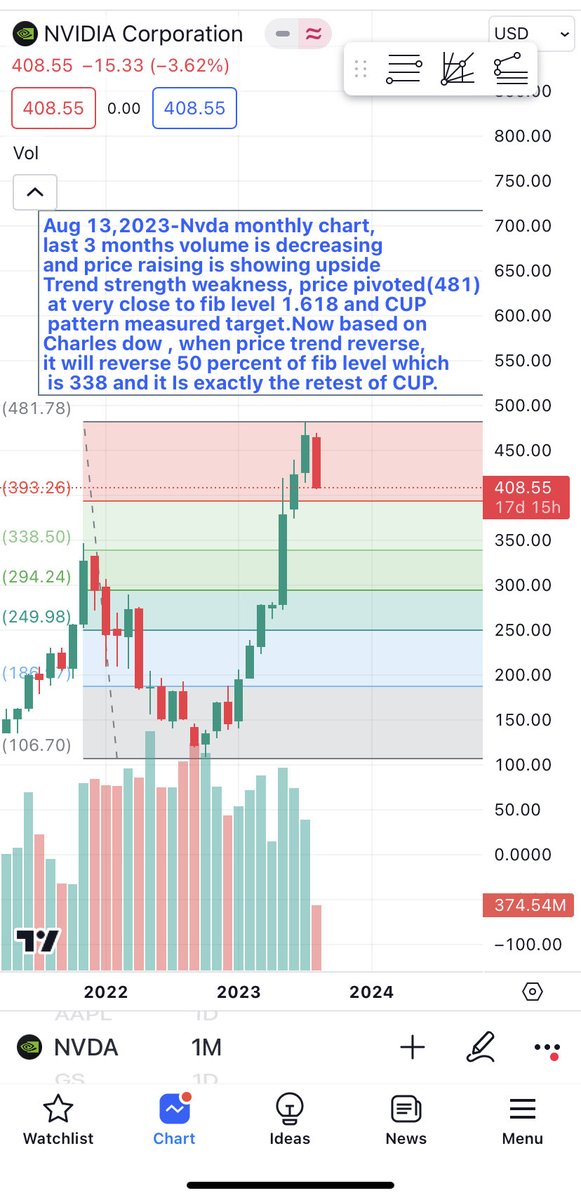
$NVDA chart analysis , fig -1 : it almost touched fib level 1.618 and retraced.
Fig-2 : CUP pattern measured target 525 also close to fin level 1.618
Now nvda made a pivot at 481 and retracing levels 393, if it breaks 338.
$SPY $QQQ
$GME is setting up good symmetrical triangle in daily chart and descending triangle in weekly chart , it can blast on either side of direction $SPY $IWM $QQQ
$SPY In my video I called $SPY can go upto 450 , today it hit my target and rejected , my next target is https://t.co/JtCBginLiQ is the link to see my targets on $RBLX $UPST https://t.co/CRMvIfa6Os
After 2019, first time fed fund rates are higher than core inflation , which is good market and this is one major point fed looks at during rate hike decision making. Let’s see how Powell consider this on his next meeting $SPY $QQQ $IWM $TSLA
Today my sell indicator hit and just closed below , I use number of stocks is SPX are above 20 SMA hit 86 as sell signal (swing high pivot ).also spy is close to my target 450, if it break then 455.
$QQQ in daily chart made a inverted hammer (shooting star) today and yesterday made a hammer, this together created a doji kind candle , looks like this will be the next week range 364-370
$SPY $TSLA $NVDA
$GS DAILY chart has gaps at 316 and 335, in my yesterday YouTube video I mentioned it may fill the gap at 316 which is matching symmetrical triangle lower wedge.$SPY $IWM $QQQ
https://t.co/FkU3ErVYvh
$RIVN went up like rocket in last few days and left a gap at 16.68 , which js fib level 0.5, upside target 21.67 and then retraces to 16.68
$SPY $IWM $QQQ