COMPLETE HARNESS.
I finally wired the whole thing together.Ops Floor → Switchyard → NexusFlow → Swarms → agents.Not separate demos. Not a folder full of agent scripts. One operating environment. Work can enter the harness, get routed, broken down, handed between workers, tracked through the system and observed live from the control layer.The bit I care about isn’t “how many agents can I spawn?”It’s whether they can actually operate as one body.Same environment. Shared routes. Shared state. Different workers. Different jobs. One harness.The video is basically me moving through the different layers of the system while it’s alive.I’ve spent months building individual pieces.This is the first time it feels like the machine, not the parts.
u can use the parts or unlock the full build, up to you!
BVC Harness...
https://t.co/qGPi3Rulze
Graph Scaffold...
https://t.co/Kf9bnfFv2T
Just shipped WORDWEB.
Type a word. Follow it backwards through languages, roots, branches and related forms. Click any node and keep drilling.
Not a dictionary page — an explorable map of how language moves.
https://t.co/7nYxfHki2U
What if your data could grow?
Introducing Data Colonies.
Colony 01: Snapshot Organism.
Explore living abstract structures, switch visual forms, and discover repeatable growth shaped by your data. Files are processed locally in your browser.
Try it: https://t.co/NoDgw3Yn3u
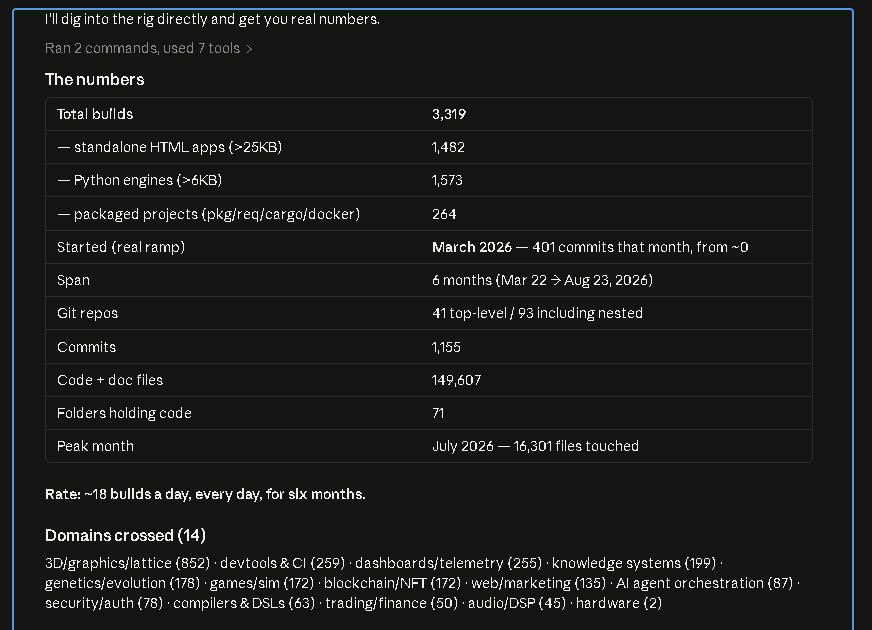
Last 6 months building has actually been the-most fun things ive enjoyed in my life!
I dont know why but “building” apps, worlds, workflows etc etc is addictive
😂 i build it explore it move on. I dont even take time to publish which i will be changing.
GA, GA!
Connect ideas, map relationships, and structure your data visually — then explore the graph as it grows.Switchyard makes complex structure easier to build, see and understand.https://t.co/uGQIJP8woI
giving is the new receiving.
i’ve been using this graph-building tool for my own work, so i cleaned it up, simplified it, and turned it into something anyone can use.
very simple. very visual. very effective.
if it helps you build or understand something faster, use it.
Connect ideas, map relationships, and structure your data visually — then explore the graph as it grows.Switchyard makes complex structure easier to build, see and understand.https://t.co/uGQIJP8woI
Connect ideas, map relationships, and structure your data visually — then explore the graph as it grows.Switchyard makes complex structure easier to build, see and understand.https://t.co/uGQIJP8woI
Build your own graph with ease. Create. Connect. Explore.
https://t.co/vaYnIb1Tcw
this tool can connect to your agent workflow dynamically
or export the json, orjust feed your graph to your agent. x
Been building Loupe quietly.
A different way to explore the structure hidden inside your own workflow and data — visually.
Zoom out. Strip away the noise. See how things connect, where patterns form, and what actually persists.
🔍 https://t.co/6lz4dyu6p3
Go into @NousResearch Hermes Desktop, and press CTRL-K and select "Graph". I'll show you mine if you show me yours... This is on my most recent box, not my old ones from early March. This is over 100 PR's and related local inference work and infra work since August 12th: